South Lakeland District Council election, 2010
The 2010 South Lakeland District Council election took place on 6 May 2010 to elect members of South Lakeland District Council in Cumbria, England. One third of the council was up for election and the Liberal Democrats stayed in overall control of the council.[1]
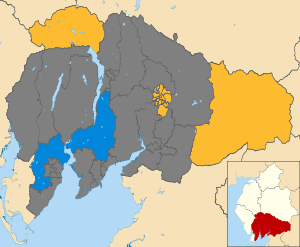
After the election, the composition of the council was
- Liberal Democrat 34
- Conservative 16
- Labour 1[2]
Background
Before the election the Liberal Democrats had controlled the council since winning a majority at the 2006 election.[3] Going in to the 2010 election they held 36 seats, compared to 14 for the Conservatives and 1 seat for the Labour party.[3]
18 seats were being contested in the election with the Liberal Democrats defending all of them.[4]
Election result
The results saw the Liberal Democrat maintain their majority on the council despite losing 2 seats to the Conservatives.[4] The Conservatives gains came in the seats of Mid Furness and Staveley-in-Cartmel, and left the Liberal Democrats on 34 seats, compared to 16 for the Conservatives.[4] Overall turnout in the election was 72.25%,[5] due to the election being held at the same time as the general election.[4]
| South Lakeland Local Election Result 2010[5][2] | ||||||||||
|---|---|---|---|---|---|---|---|---|---|---|
| Party | Seats | Gains | Losses | Net gain/loss | Seats % | Votes % | Votes | +/− | ||
| Liberal Democrat | 16 | 0 | 2 | -2 | 88.9 | 60.1 | 15,877 | +2.7% | ||
| Conservative | 2 | 2 | 0 | +2 | 11.1 | 33.6 | 8,866 | -6.0% | ||
| Labour | 0 | 0 | 0 | 0 | 0 | 5.5 | 1,456 | +2.9% | ||
| Green | 0 | 0 | 0 | 0 | 0 | 0.8 | 203 | +0.4% | ||
Ward results
| Party | Candidate | Votes | % | ± | |
|---|---|---|---|---|---|
| Liberal Democrat | David Vatcher | 1,531 | 61.7 | ||
| Conservative | Alan Clarke | 826 | 33.3 | ||
| Labour | Kathy Cross | 123 | 5.0 | ||
| Majority | 705 | 28.4 | |||
| Turnout | 2,480 | 62.1 | |||
| Liberal Democrat hold | Swing | ||||
| Party | Candidate | Votes | % | ± | |
|---|---|---|---|---|---|
| Liberal Democrat | Sonia Lawson | 786 | 68.6 | -0.7 | |
| Conservative | James Alexander | 359 | 31.4 | +0.7 | |
| Majority | 427 | 37.3 | -1.4 | ||
| Turnout | 1,145 | 76.9 | |||
| Liberal Democrat hold | Swing | ||||
| Party | Candidate | Votes | % | ± | |
|---|---|---|---|---|---|
| Liberal Democrat | Clive Graham | 695 | 60.7 | -4.4 | |
| Conservative | Colin Bell | 321 | 28.0 | +8.0 | |
| Labour | Kieran Roberts | 129 | 11.3 | +11.3 | |
| Majority | 374 | 32.7 | -12.4 | ||
| Turnout | 1,145 | 67.5 | |||
| Liberal Democrat hold | Swing | ||||
| Party | Candidate | Votes | % | ± | |
|---|---|---|---|---|---|
| Liberal Democrat | Brendan Jameson | 855 | 75.3 | +4.9 | |
| Conservative | Marilyn Molloy | 280 | 24.7 | +6.3 | |
| Majority | 575 | 50.7 | -1.2 | ||
| Turnout | 1,135 | 66.3 | |||
| Liberal Democrat hold | Swing | ||||
| Party | Candidate | Votes | % | ± | |
|---|---|---|---|---|---|
| Liberal Democrat | Andy Shine | 883 | 72.6 | -5.0 | |
| Conservative | David Perry | 334 | 27.4 | +5.0 | |
| Majority | 549 | 45.1 | -10.1 | ||
| Turnout | 1,217 | 79.3 | |||
| Liberal Democrat hold | Swing | ||||
| Party | Candidate | Votes | % | ± | |
|---|---|---|---|---|---|
| Liberal Democrat | Philip Dixon | 723 | 65.1 | -17.8 | |
| Conservative | Deborah Huck | 250 | 22.5 | +5.4 | |
| Labour | Allan Ring | 138 | 12.4 | +12.4 | |
| Majority | 473 | 42.6 | -23.1 | ||
| Turnout | 1,111 | 67.0 | |||
| Liberal Democrat hold | Swing | ||||
| Party | Candidate | Votes | % | ± | |
|---|---|---|---|---|---|
| Liberal Democrat | Julie Dawson | 611 | 60.1 | -8.3 | |
| Conservative | Emma Hine | 208 | 20.5 | +7.5 | |
| Labour | Tony Rothwell | 198 | 19.5 | +0.9 | |
| Majority | 403 | 39.6 | -10.2 | ||
| Turnout | 1,017 | 62.3 | |||
| Liberal Democrat hold | Swing | ||||
| Party | Candidate | Votes | % | ± | |
|---|---|---|---|---|---|
| Liberal Democrat | David Evans | 873 | 71.8 | -10.2 | |
| Conservative | Lyndsay Slater | 343 | 28.2 | +10.2 | |
| Majority | 530 | 43.6 | -20.4 | ||
| Turnout | 1,216 | 73.6 | |||
| Liberal Democrat hold | Swing | ||||
| Party | Candidate | Votes | % | ± | |
|---|---|---|---|---|---|
| Liberal Democrat | Clare Feeney-Johnson | 863 | 69.2 | -16.0 | |
| Conservative | Stephen Chambers | 297 | 23.8 | +9.0 | |
| Labour | Charles Haigh | 87 | 7.0 | +7.0 | |
| Majority | 566 | 45.4 | -25.0 | ||
| Turnout | 1,247 | 75.1 | |||
| Liberal Democrat hold | Swing | ||||
| Party | Candidate | Votes | % | ± | |
|---|---|---|---|---|---|
| Liberal Democrat | Brenda Gray | 702 | 54.0 | -14.2 | |
| Conservative | Alan Bobbett | 546 | 42.0 | +10.2 | |
| Labour | Rae Cross | 51 | 3.9 | +3.9 | |
| Majority | 156 | 12.0 | -24.4 | ||
| Turnout | 1,299 | 77.5 | |||
| Liberal Democrat hold | Swing | ||||
| Party | Candidate | Votes | % | ± | |
|---|---|---|---|---|---|
| Liberal Democrat | Jonathan Brook | 787 | 65.1 | -14.3 | |
| Conservative | Dan Ross | 320 | 26.5 | +5.9 | |
| Labour | Lois Sparling | 101 | 8.4 | +8.4 | |
| Majority | 467 | 38.7 | -20.2 | ||
| Turnout | 1,208 | 72.1 | |||
| Liberal Democrat hold | Swing | ||||
| Party | Candidate | Votes | % | ± | |
|---|---|---|---|---|---|
| Liberal Democrat | Graham Vincent | 775 | 62.9 | -17.3 | |
| Conservative | Pam Flitcroft | 336 | 27.3 | +7.5 | |
| Labour | Penelope Henderson | 121 | 9.8 | +9.8 | |
| Majority | 439 | 35.6 | -24.8 | ||
| Turnout | 1,232 | 71.9 | |||
| Liberal Democrat hold | Swing | ||||
| Party | Candidate | Votes | % | ± | |
|---|---|---|---|---|---|
| Liberal Democrat | Sylvia Emmott | 850 | 65.2 | -17.7 | |
| Conservative | Nigel Byrom | 381 | 29.2 | +12.1 | |
| Labour | Ian Law | 72 | 5.5 | +5.5 | |
| Majority | 469 | 36.0 | -29.8 | ||
| Turnout | 1,303 | 80.6 | |||
| Liberal Democrat hold | Swing | ||||
| Party | Candidate | Votes | % | ± | |
|---|---|---|---|---|---|
| Liberal Democrat | Stephen Coleman | 738 | 65.2 | -18.7 | |
| Conservative | Derrick Wade | 279 | 24.6 | +8.5 | |
| Labour | John Batteson | 115 | 10.2 | +10.2 | |
| Majority | 459 | 40.5 | -27.4 | ||
| Turnout | 1,132 | 75.5 | |||
| Liberal Democrat hold | Swing | ||||
| Party | Candidate | Votes | % | ± | |
|---|---|---|---|---|---|
| Liberal Democrat | Rob Boden | 709 | 60.3 | -8.8 | |
| Conservative | Keith Dawson | 291 | 24.8 | +9.9 | |
| Labour | Paul Braithwaite | 175 | 14.9 | -1.1 | |
| Majority | 418 | 35.6 | -17.5 | ||
| Turnout | 1,175 | 69.2 | |||
| Liberal Democrat hold | Swing | ||||
| Party | Candidate | Votes | % | ± | |
|---|---|---|---|---|---|
| Conservative | Caroline Airey | 1,132 | 48.8 | ||
| Liberal Democrat | Jane Carson | 986 | 42.5 | ||
| Green | Jo-Anna Duncalf | 203 | 8.7 | ||
| Majority | 146 | 6.3 | |||
| Turnout | 2,321 | 73.2 | |||
| Conservative gain from Liberal Democrat | Swing | ||||
| Party | Candidate | Votes | % | ± | |
|---|---|---|---|---|---|
| Liberal Democrat | Ian McPherson | 1,962 | 51.6 | ||
| Conservative | Anne Fenwick | 1,691 | 44.5 | ||
| Labour | Derek Longmire | 146 | 3.8 | ||
| Majority | 271 | 7.1 | |||
| Turnout | 3,799 | 78.1 | |||
| Liberal Democrat hold | Swing | ||||
| Party | Candidate | Votes | % | ± | |
|---|---|---|---|---|---|
| Conservative | Ted Walsh | 672 | 55.1 | +7.7 | |
| Liberal Democrat | Sue Sanderson | 548 | 44.9 | -7.7 | |
| Majority | 124 | 10.2 | |||
| Turnout | 1,220 | 76.7 | |||
| Conservative gain from Liberal Democrat | Swing | ||||
References
- ↑ "South Lakeland". BBC News Online. 19 April 2009. Retrieved 13 August 2011.
- 1 2 "Local elections 2010". London: guardian.co.uk. 2010-05-07. Retrieved 2011-08-14.
- 1 2 "South Lakeland District Council election battle". The Westmorland Gazette. 22 April 2010. Retrieved 14 August 2011.
- 1 2 3 4 Kirk, Scott (7 May 2010). "Lib Dems retain control of South Lakeland District Council". The Westmorland Gazette. Retrieved 14 August 2011.
- 1 2 3 4 5 6 7 8 9 10 11 12 13 14 15 16 17 18 19 20 "South Lakeland District Council elections - 6 May 2010" (PDF). South Lakeland District Council. Retrieved 13 August 2011.
| Cumbria County Council | |
|---|---|
| Allerdale Borough Council | |
| Barrow-in-Furness Borough Council | |
| Carlisle City Council | |
| Copeland Borough Council | |
| Eden District Council |
|
| South Lakeland District Council | |
| Cumberland County Council |
|
| Westmorland County Council |
|
| |