Kildare County Council election, 1999
Kildare County Council election, 1999

|
|
|
|
|
|
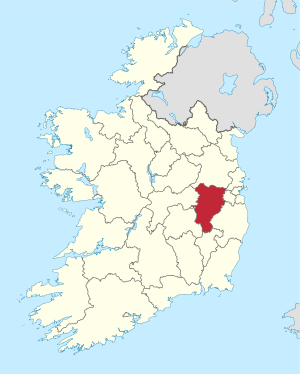
| Map showing the area of Kildare County Council |
|
Council control after election
TBD
|
|
|
An election to Kildare County Council took place on 10 June 1999 as part of that year's Irish local elections. 25 councillors were elected from six electoral divisions by PR-STV voting for a five-year term of office.
Results by party
Results by Electoral Area
Athy
| Athy - 3 seats |
| Party | Candidate | % 1st Pref | Count 1 | Count 2 | Count 3 | Count 4 | Count 5 | Count 6 |
|
Labour Party |
Jack WallTD |
20.93 |
1,382 |
|
|
|
|
|
|
Fine Gael |
Rainsford Hendy* |
19.25 |
1,271 |
1,286 |
1,393 |
1,419 |
1,590 |
1,785 |
|
Fianna Fáil |
Martin Miley* |
17.81 |
1,176 |
1,187 |
1,210 |
1,292 |
1,563 |
2,313 |
|
Fianna Fáil |
Mark Dalton |
16.04 |
1,059 |
1,068 |
1,092 |
1,197 |
1,400 |
|
|
Fianna Fáil |
Vincent Corcoran |
11.07 |
731 |
754 |
756 |
759 |
|
|
|
Sinn Féin |
Paddy Wright* |
7.66 |
506 |
521 |
541 |
|
|
|
|
Fine Gael |
John Lynch |
3.74 |
247 |
250 |
|
|
|
|
|
Labour Party |
Mags O'Brien |
3.48 |
230 |
|
|
|
|
|
| Electorate: 12,461 Valid: 6,602 (52.98%) Spoilt: 130 Quota: 1,651 Turnout: 6,732 (54.02%) |
Celbridge
| Celbridge - 3 seats |
| Party | Candidate | % 1st Pref | Count 1 | Count 2 | Count 3 | Count 4 | Count 5 | Count 6 |
|
Independent |
Kate Walsh |
43.14 |
2,167 |
|
|
|
|
|
|
Labour Party |
Emmet StaggTD |
25.14 |
1,263 |
|
|
|
|
|
|
Fianna Fáil |
Geraldine Conway |
9.14 |
459 |
617 |
646 |
713 |
786 |
1,120 |
|
Fianna Fáil |
Gay Boylan |
7.39 |
371 |
531 |
560 |
600 |
672 |
|
|
Green Party |
Marie Percival |
4.06 |
204 |
380 |
411 |
|
|
|
|
Fine Gael |
Mark Clinton |
4.04 |
203 |
309 |
424 |
497 |
|
|
|
Independent |
Mairead Byrne |
3.96 |
199 |
391 |
425 |
551 |
723 |
929 |
|
Fine Gael |
Brian Mullarkey |
3.13 |
157 |
276 |
|
|
|
|
| Electorate: 11,182 Valid: 5,023 (44.92) Spoilt: 35 Quota: 1,256 Turnout: 5,058 (45.23%) |
Clane
| Clane - 4 seats |
| Party | Candidate | % 1st Pref | Count 1 | Count 2 | Count 3 | Count 4 | Count 5 | Count 6 | Count 7 | Count 8 | Count 9 |
|
Fianna Fáil |
Michael Fitzpatrick |
17.26 |
1,352 |
1,385 |
1,406 |
1,426 |
1,477 |
1,498 |
1,510 |
1,546 |
1,578 |
|
Independent |
Tony McEvoy |
17.25 |
1,351 |
1,365 |
1,380 |
1,438 |
1,514 |
1,717 |
|
|
|
|
Fianna Fáil |
P.J. Sheridan* |
13.06 |
1,023 |
1,030 |
1,038 |
1,062 |
1,078 |
1,106 |
1,121 |
1,296 |
1,354 |
|
Fine Gael |
Jim Reilly* |
12.05 |
944 |
951 |
1,001 |
1,026 |
1,192 |
1,236 |
1,256 |
1,692 |
|
|
Fine Gael |
Brendan Weld |
9.37 |
734 |
743 |
756 |
796 |
837 |
917 |
948 |
|
|
|
Fianna Fáil |
Seamus Davey |
8.23 |
645 |
647 |
664 |
751 |
810 |
986 |
1,015 |
1,134 |
1,169 |
|
Independent |
John Nealon |
6.50 |
509 |
511 |
514 |
594 |
667 |
|
|
|
|
|
Independent |
Bernie Holton |
5.45 |
427 |
432 |
538 |
583 |
|
|
|
|
|
|
Labour Party |
Rose Murphy |
4.61 |
361 |
417 |
502 |
|
|
|
|
|
|
|
Labour Party |
Garry Stynes |
4.21 |
330 |
350 |
|
|
|
|
|
|
|
|
Labour Party |
Joan Mooney |
2.02 |
158 |
|
|
|
|
|
|
|
|
| Electorate: 16,438 Valid: 7,834 (47.66%) Spoilt: 113 Quota: 1,567 Turnout: 7,947 (48.35%) |
Kildare
| Kildare - 6 seats |
| Party | Candidate | % 1st Pref | Count 1 | Count 2 | Count 3 | Count 4 | Count 5 | Count 6 | Count 7 | Count 8 | Count 9 | Count 10 | Count 11 |
|
Fianna Fáil |
Seán Ó Fearghail* |
16.32 |
1,737 |
|
|
|
|
|
|
|
|
|
|
|
Fianna Fáil |
Fiona O'Loughlin |
14.02 |
1,492 |
1,546 |
|
|
|
|
|
|
|
|
|
|
Fine Gael |
Fionnuala Dukes |
10.02 |
1,067 |
1,099 |
1,101 |
1,102 |
1,126 |
1,170 |
1,245 |
1,300 |
1,391 |
1,458 |
1,683 |
|
Progressive Democrats |
Senator John Dardis* |
9.11 |
970 |
979 |
980 |
981 |
999 |
1,019 |
1,029 |
1,116 |
1,154 |
1,247 |
1,344 |
|
Fianna Fáil |
John O'Neill* |
8.81 |
938 |
962 |
968 |
972 |
980 |
1,002 |
1,004 |
1,063 |
1,213 |
1,349 |
1,423 |
|
Labour Party |
Jim Keane* |
7.96 |
847 |
860 |
860 |
860 |
927 |
954 |
970 |
1,004 |
1,055 |
1,090 |
1,274 |
|
Fine Gael |
Michael Nolan, Snr* |
6.84 |
728 |
730 |
731 |
731 |
744 |
759 |
795 |
860 |
880 |
1,072 |
1,112 |
|
Independent |
Francis Browne* |
6.13 |
653 |
673 |
673 |
674 |
681 |
694 |
718 |
763 |
944 |
1,006 |
|
|
Fianna Fáil |
Breda Connolly |
5.48 |
583 |
609 |
610 |
611 |
617 |
626 |
673 |
699 |
|
|
|
|
Independent |
Seamus Finn |
5.35 |
569 |
571 |
573 |
574 |
592 |
615 |
619 |
726 |
737 |
|
|
|
Independent |
Murty Aspell |
4.79 |
510 |
515 |
519 |
519 |
536 |
553 |
553 |
|
|
|
|
|
Fine Gael |
Allan Foxe |
2.07 |
220 |
224 |
224 |
224 |
228 |
229 |
|
|
|
|
|
|
Labour Party |
Tom Ennis |
1.84 |
206 |
208 |
208 |
208 |
|
|
|
|
|
|
|
|
Independent |
Percy Podger |
1.00 |
196 |
204 |
212 |
213 |
217 |
|
|
|
|
|
|
|
Independent |
Harry Price |
0.27 |
29 |
29 |
|
|
|
|
|
|
|
|
|
| Electorate: 25,040 Valid: 10,745 (42.51%) Spoilt: 126 Quota: 1,521 Turnout: 10,871 (43.02%) |
Leixlip
| Leixlip - 4 seats |
| Party | Candidate | % 1st Pref | Count 1 | Count 2 | Count 3 | Count 4 |
|
Fianna Fáil |
Paul Kelly |
21.53 |
1,437 |
|
|
|
|
Labour Party |
Catherine Murphy* |
19.24 |
1,284 |
1,311 |
1,366 |
|
|
Labour Party |
John McGinley* |
16.54 |
1,104 |
1,107 |
1,158 |
1,355 |
|
Fine Gael |
Senan Griffin* |
15.33 |
1,023 |
1,029 |
1,110 |
1,257 |
|
Labour Party |
Colm Purcell* |
13.81 |
922 |
937 |
965 |
1,091 |
|
Green Party |
Leo Armstrong |
8.25 |
551 |
555 |
626 |
|
|
Fianna Fáil |
Laura Canning |
5.30 |
354 |
400 |
|
|
| Electorate: 16,315 Valid: 6,675 (40.91%) Spoilt: 75 Quota: 1,336 Turnout: 6,750 (41.37%) |
Naas
| Naas - 5 seats |
| Party | Candidate | % 1st Pref | Count 1 | Count 2 | Count 3 | Count 4 | Count 5 | Count 6 | Count 7 | Count 8 | Count 9 | Count 10 | Count 11 |
|
Independent |
Anthony Lawlor* |
16.32 |
1,209 |
1,323 |
1,333 |
1,358 |
1,414 |
1,473 |
1,575 |
|
|
|
|
|
Fianna Fáil |
Seán PowerTD |
11.85 |
1,061 |
1,135 |
1,146 |
1,171 |
1,223 |
1,280 |
1,338 |
1,346 |
1,828 |
|
|
|
Fine Gael |
Billy Hillis |
10.12 |
906 |
912 |
916 |
943 |
949 |
1,239 |
1,298 |
1,309 |
1,340 |
1,368 |
1,371 |
|
Independent |
Mary Glennon |
11.85 |
875 |
1,180 |
1,228 |
1,284 |
1,363 |
1,517 |
|
|
|
|
|
|
Progressive Democrats |
Timmy Conway* |
7.99 |
715 |
724 |
735 |
775 |
848 |
905 |
977 |
991 |
1,171 |
1,278 |
1,283 |
|
Fianna Fáil |
Willie Callaghan |
7.94 |
711 |
767 |
771 |
800 |
870 |
910 |
945 |
950 |
|
|
|
|
Labour Party |
Paddy McNamara |
7.64 |
684 |
699 |
705 |
727 |
752 |
777 |
|
|
|
|
|
|
Fine Gael |
Pat O'Reilly |
6.65 |
595 |
600 |
606 |
614 |
664 |
|
|
|
|
|
|
|
Green Party |
J.J. Power* |
6.64 |
594 |
617 |
634 |
794 |
841 |
864 |
1,042 |
1,064 |
1,147 |
1,213 |
1,230 |
|
Independent |
Seamus Moore |
5.62 |
462 |
468 |
474 |
483 |
|
|
|
|
|
|
|
|
Green Party |
Louise Burchall |
4.41 |
395 |
403 |
410 |
|
|
|
|
|
|
|
|
|
Independent |
Anthony Egan |
4.41 |
395 |
397 |
|
|
|
|
|
|
|
|
|
|
Fianna Fáil |
Liam Kelly |
3.98 |
356 |
|
|
|
|
|
|
|
|
|
|
| Electorate: 22,432 Valid: 8,950 (39.90%) Spoilt: 102 Quota: 1,492 Turnout: 9,052 (40.35%) |
External links