Canarian parliamentary election, 2007
Canarian parliamentary election, 2007
|
|
|
|
All 60 seats in the Parliament of Canarias
31 seats needed for a majority |
| Registered |
1,537,139  6.8% 6.8% |
| Turnout |
940,852 (61.2%)
 3.4 pp 3.4 pp |
| |
First party |
Second party |
Third party |
| |
 |
 |
.jpg) |
| Leader |
Juan Fernando López Aguilar |
Paulino Rivero |
José Manuel Soria |
| Party |
PSOE |
CC |
PP |
| Leader since |
28 October 2006 |
3 February 2007 |
16 July 1999 |
| Last election |
17 seats, 25.4% |
23 seats, 32.9% |
17 seats, 30.6% |
| Seats won |
26 |
19 |
15 |
| Seat change |
9 |
4 |
2 |
| Popular vote |
322,833 |
226,122 |
224,883 |
| Percentage |
34.5% |
24.2% |
24.0% |
| Swing |
9.1 pp |
8.7 pp |
6.6 pp |
|
|
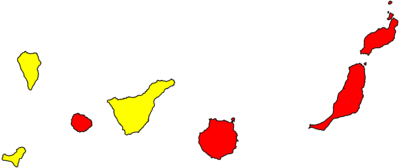
| Island-level units won by PSOE (red) and CC (yellow) |
|
|
The 2007 Canarian parliamentary election was held on Sunday, 27 May 2007, to elect the 7th Canarian Parliament, the unicameral regional legislature of the Spanish autonomous community of the Canary Islands. At stake were all 60 seats in the Parliament, determining the President of the Canary Islands.
Electoral system
The 60 members of the Canarian Parliament were elected in 7 multi-member districts using the D'Hondt method and a closed-list proportional representation system. Unlike other regions, districts did not coincide with provincial limits, being determined by law for each of the main islands to become a district of its own. The electoral system came regulated under the Autonomous Statute of Autonomy. Each district was assigned a fixed set of seats, distributed as follows: El Hierro (3), Fuerteventura (7), Gran Canaria (15), La Gomera (4), La Palma (8), Lanzarote (8) and Tenerife (15).
Voting was on the basis of universal suffrage in a secret ballot. Only lists polling above 30% of the total vote in each district or above 6% in all of the community (which include blank ballots—for none of the above) were entitled to enter the seat distribution.[1]
Results
Overall
← Summary of the 27 May 2007 Canarian Parliament election results →
| |
| Party |
Vote |
Seats |
| Votes |
% |
±pp |
Won |
+/− |
|
Spanish Socialist Workers' Party (PSOE) |
322,833 | 34.51 | 9.09 |
26 | 9 |
|
Canarian Coalition-Canarian Nationalist Party (CC-PNC) |
226,122 | 24.17 | 8.73 |
19 | 4 |
|
People's Party (PP) |
224,883 | 24.04 | 6.57 |
15 | 2 |
| |
|
New Canaries (NCa) |
50,749 | 5.43 | New |
0 | ±0 |
|
Nationalist Canarian Centre (CCN) |
46,676 | 4.99 | New |
0 | ±0 |
|
The Greens (LV) |
17,793 | 1.90 | 0.08 |
0 | ±0 |
|
Commitment for Gran Canaria (CGC) |
8,512 | 0.91 | New |
0 | ±0 |
|
Canarian United Left (IUC) |
6,558 | 0.70 | 0.61 |
0 | ±0 |
|
Canarian People's Alternative-25 May Citizen Alternative (APCa-AC25M) |
4,824 | 0.52 | 0.50 |
0 | ±0 |
|
Canarian Nationalist Alternative (ANC) |
2,539 | 0.27 | New |
0 | ±0 |
|
Unity of the People (UP) |
1,485 | 0.16 | New |
0 | ±0 |
|
Communist Party of the Canarian People (PCPC-PCPE) |
1,338 | 0.14 | 0.05 |
0 | ±0 |
|
Nationalist Maga Alternative (AMAGA) |
1,079 | 0.12 | New |
0 | ±0 |
|
Gran Canaria Party (PGC) |
1,073 | 0.11 | New |
0 | ±0 |
|
Centre Coalition (CCCAN) |
1,006 | 0.11 | New |
0 | ±0 |
| Parties with less than 0.1% of the vote |
4,753 |
0.51 |
– |
0 |
3 |
|
Alternative Island (ISAL) |
870 | 0.09 | New |
0 | ±0 |
|
Humanist Party (PH) |
777 | 0.08 | 0.06 |
0 | ±0 |
|
Canarian People's Unity Movement (MUPC) |
584 | 0.06 | New |
0 | ±0 |
|
Citizen Union, Independent Progresists of Canarias (UC) |
557 | 0.06 | New |
0 | ±0 |
|
Commitment for Tenerife (CTF) |
466 | 0.05 | New |
0 | ±0 |
|
The Falange (FE) |
327 | 0.03 | New |
0 | ±0 |
|
People's Unity Movement (MUP) |
304 | 0.03 | New |
0 | ±0 |
|
National Democracy (DN) |
302 | 0.03 | 0.01 |
0 | ±0 |
|
Citizen Initiative for Fuerteventura (ICF) |
286 | 0.03 | New |
0 | ±0 |
|
Canarian Pensionist Tagoror (TPC) |
280 | 0.03 | 0.02 |
0 | ±0 |
|
Canarian Nationalist Federation (FNC) |
N/A | N/A | 4.83 |
0 | 3 |
|
Blank ballots |
13,237 | 1.42 | 0.14 |
|
| |
| Total |
935,460 | 100.00 | |
60 | ±0 |
| |
| Valid votes |
935,460 | 99.43 | 0.01 |
|
| Invalid votes |
5,392 | 0.57 | 0.01 |
| Votes cast / turnout |
940,852 | 61.21 | 3.41 |
| Abstentions |
596,287 | 38.79 | 3.41 |
| Registered voters |
1,537,139 | |
| |
| Source: Argos Information Portal |
| Vote share |
|---|
|
|
|
|
|
| PSOE |
|
34.51% |
| CC-PNC |
|
24.17% |
| PP |
|
24.04% |
| NCa |
|
5.43% |
| CCN |
|
4.99% |
| LV |
|
1.90% |
| Others |
|
3.55% |
| Blank ballots |
|
1.42% |
| Parliamentary seats |
|---|
|
|
|
|
|
| PSOE |
|
43.33% |
| CC-PNC |
|
31.67% |
| PP |
|
25.00% |
References
