Torfaen (Assembly constituency)
Coordinates: 51°41′46″N 3°03′47″W / 51.696°N 3.063°W
| Welsh Assembly county constituency | |
|---|---|
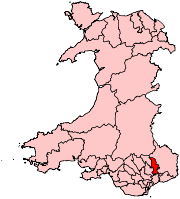 | |
| Torfaen shown as one of the 40 Welsh Assembly constituencies | |
| Created: | 1999 |
| Electoral region: | South Wales East |
| AM: | Lynne Neagle |
| Party: | Labour |
Torfaen is a constituency of the National Assembly for Wales. It elects one Assembly Member by the first past the post method of election. Also, however, it is one of eight constituencies in the South Wales East electoral region, which elects four additional members, in addition to eight constituency members, to produce a degree of proportional representation for the region as a whole.
Boundaries
The constituency was created for the first election to the Assembly, in 1999, with the name and boundaries of the Torfaen Westminster constituency.
The other seven constituencies of the South Wales East electoral region are Blaenau Gwent, Caerphilly, Islwyn, Merthyr Tydfil and Rhymney, Monmouth, Newport East and Newport West.
Voting
In general elections for the National Assembly for Wales, each voter has two votes. The first vote may be used to vote for a candidate to become the Assembly Member for the voter's constituency, elected by the first past the post system. The second vote may be used to vote for a regional closed party list of candidates. Additional member seats are allocated from the lists by the d'Hondt method, with constituency results being taken into account in the allocation.
Members of the National Assembly for Wales
| Election | Member | Party | ||
|---|---|---|---|---|
| 1999–present | Lynne Neagle | Labour |  | |
Elections
Elections in the 2010s
| Party | Candidate | Votes | % | ± | |
|---|---|---|---|---|---|
| Labour | Lynne Neagle | 9,688 | 42.4 | −4.0 | |
| UKIP | Susan Boucher | 5,190 | 22.6 | +22.6 | |
| Conservative | Graham Smith | 3,931 | 17.1 | +2.3 | |
| Plaid Cymru | Matthew Woolfall-Jones | 2,860 | 12.4 | +0.2 | |
| Green | Steven Jenkins | 681 | 3.0 | +3.0 | |
| Liberal Democrat | Alison Willott | 628 | 2.7 | −1.1 | |
| Majority | 4,498 | 19.8 | -7.5 | ||
| Turnout | 22,978 | 38.1 | +1.9 | ||
| Labour hold | Swing | ||||
| Party | Candidate | Votes | % | ± | |
|---|---|---|---|---|---|
| Labour | Lynne Neagle | 10,318 | 46.2 | +3.5 | |
| Independent | Elizabeth Haynes | 4,230 | 18.9 | N/A | |
| Conservative | Natasha Batool Asghar | 3,306 | 14.8 | −4.7 | |
| Plaid Cymru | Jeff Rees | 2,716 | 12.2 | +0.3 | |
| BNP | Susan Harwood | 906 | 4.1 | N/A | |
| Liberal Democrats | Will Griffiths | 852 | 3.8 | −7.6 | |
| Majority | 6,088 | 27.3 | +4.1 | ||
| Turnout | 22,328 | 36.2 | −0.9 | ||
| Labour hold | Swing | ||||
Elections in the 2000s
| Party | Candidate | Votes | % | ± | |
|---|---|---|---|---|---|
| Labour | Lynne Neagle | 9,921 | 42.7 | −9.2 | |
| Conservative | Graham Stephen Smith | 4,525 | 19.5 | +3.2 | |
| Blaenau Gwent PV | Ian Michael Williams | 3,348 | 14.4 | N/A | |
| Plaid Cymru | Rhys Gwyn ab Ellis | 2,762 | 11.9 | +1.2 | |
| Liberal Democrats | Patrick Mervyn Legg | 2,659 | 11.4 | −2.6 | |
| Majority | 5,396 | 23.2 | -12.4 | ||
| Turnout | 23,215 | 37.1 | +5.2 | ||
| Labour hold | Swing | −6.2 | |||
| Party | Candidate | Votes | % | ± | |
|---|---|---|---|---|---|
| Labour | Lynne Neagle | 10,152 | 51.9 | +13.9 | |
| Conservative | Nick Ramsay | 3,188 | 16.3 | +7.3 | |
| Liberal Democrats | Michael German | 2,746 | 14.0 | +3.1 | |
| Plaid Cymru | Aneurin J.M. Preece | 2,092 | 10.7 | −0.2 | |
| UKIP | David J. Rowlands | 1,377 | 7.0 | N/A | |
| Majority | 6,964 | 35.6 | +14.5 | ||
| Turnout | 19,555 | 31.7 | −7.5 | ||
| Labour hold | Swing | ||||
Elections in the 1990s
| Party | Candidate | Votes | % | ± | |
|---|---|---|---|---|---|
| Labour | Lynne Neagle | 9,080 | 38.0 | N/A | |
| Independent Labour | Michael B. Gough | 3,795 | 15.9 | N/A | |
| Independent | Ingrid A. Nut | 2,828 | 11.8 | N/A | |
| Plaid Cymru | Noel G. Turner | 2,614 | 10.9 | N/A | |
| Liberal Democrats | Jean E. Gray | 2,614 | 10.9 | N/A | |
| Conservative | Kay P. Thomas | 2,152 | 9.0 | N/A | |
| Local Socialist | Stephen P. Smith | 839 | 3.5 | N/A | |
| Majority | 5,285 | 22.1 | N/A | ||
| Turnout | 23,922 | 39.2 | N/A | ||
| Labour win (new seat) | |||||