Islwyn (Assembly constituency)
Coordinates: 51°39′11″N 3°11′24″W / 51.653°N 3.190°W
| Welsh Assembly county constituency | |
|---|---|
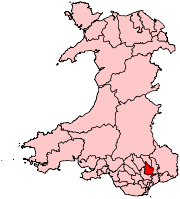 | |
| Islwyn shown as one of the 40 Welsh Assembly constituencies | |
| Created: | 1999 |
| Electoral region: | South Wales East |
| AM: | Rhianon Passmore |
| Party: | Labour |
Islwyn is a constituency of the National Assembly for Wales. It elects one Assembly Member by the first past the post method of election. Also, however, it is one of eight constituencies in the South Wales East electoral region, which elects four additional members, in addition to eight constituency members, to produce a degree of proportional representation for the region as a whole.
Boundaries
The constituency was created for the first election to the Assembly, in 1999, with the name and boundaries of the Islwyn Westminster constituency.
The other seven constituencies of the South Wales East electoral region are Blaenau Gwent, Caerphilly, Merthyr Tydfil and Rhymney, Monmouth, Newport East, Newport West and Torfaen.
Voting
In general elections for the National Assembly for Wales, each voter has two votes. The first vote may be used to vote for a candidate to become the Assembly Member for the voter's constituency, elected by the first past the post system. The second vote may be used to vote for a regional closed party list of candidates. Additional member seats are allocated from the lists by the d'Hondt method, with constituency results being taken into account in the allocation.
Members of the National Assembly for Wales
| Election | Member | Party | ||
|---|---|---|---|---|
| 1999 | Brian Hancock | Plaid Cymru | ||
| 2003 | Irene James | Labour | ||
| 2011 | Gwyn R Price | Labour | .jpg) | |
| 2016 | Rhianon Passmore | Labour | ||
Results
Elections in the 2010s
| Party | Candidate | Votes | % | ± | |
|---|---|---|---|---|---|
| Labour | Rhianon Passmore | 10,050 | 45.0 | −12.9 | |
| UKIP | Joe Smyth | 4,944 | 22.2 | +22.2 | |
| Plaid Cymru | Lyn Ackerman | 4,349 | 19.5 | −2.2 | |
| Conservative | Paul Williams | 1,775 | 8.0 | −4.0 | |
| Liberal Democrats | Matthew Kidner | 597 | 2.7 | −0.4 | |
| Green | Katy Beddoe | 594 | 2.7 | +2.7 | |
| Majority | 5,106 | ||||
| Turnout | 22,309 | 40.8 | +2.5 | ||
| Labour hold | Swing | ||||
| Party | Candidate | Votes | % | ± | |
|---|---|---|---|---|---|
| Labour | Gwyn R Price | 12,116 | 57.9 | +20.2 | |
| Plaid Cymru | Steffan Lewis | 4,527 | 21.7 | +0.1 | |
| Conservative | David Chipp | 2,497 | 11.9 | +4.3 | |
| BNP | Peter Whalley | 1,115 | 5.3 | N/A | |
| Liberal Democrats | Tom Sullivan | 653 | 3.1 | −1.7 | |
| Majority | 7,589 | 36.3 | +26.9 | ||
| Turnout | 20,908 | 38.3 | −4.7 | ||
| Labour hold | Swing | +10.1 | |||
Elections in the 2000s
| Party | Candidate | Votes | % | ± | |
|---|---|---|---|---|---|
| Labour | Irene James | 8,883 | 37.7 | −18.2 | |
| Independent | Kevin Etheridge | 6,665 | 28.3 | N/A | |
| Plaid Cymru | Alan Pritchard | 5,084 | 21.6 | +2.7 | |
| Conservative | Paul Williams | 1,797 | 7.6 | −1.5 | |
| Liberal Democrats | Mark Maguire | 1,135 | 4.8 | −1.3 | |
| Majority | 2,218 | 9.4 | −26.3 | ||
| Turnout | 23,564 | 43.0 | +3.6 | ||
| Labour hold | Swing | +23.3 | |||
| Party | Candidate | Votes | % | ± | |
|---|---|---|---|---|---|
| Labour | Irene James | 11,246 | 55.2 | +16.1 | |
| Plaid Cymru | Brian Hancock | 3,926 | 19.3 | −22.7 | |
| Tinker Against the Assembly | Paul Taylor | 2,201 | 10.8 | N/A | |
| Conservative | Terri-Anne Matthews | 1,848 | 9.1 | +2.1 | |
| Liberal Democrats | Huw Price | 1,268 | 6.2 | −3.6 | |
| Majority | 7,320 | 35.7 | |||
| Turnout | 20,489 | 39.6 | −7.7 | ||
| Labour gain from Plaid Cymru | Swing | +19.4 | |||
Elections in the 1990s
| Party | Candidate | Votes | % | ± | |
|---|---|---|---|---|---|
| Plaid Cymru | Brian Hancock | 10,042 | 42.0 | N/A | |
| Labour | Shane Williams | 9,438 | 39.4 | N/A | |
| Liberal Democrats | Caroline J. Bennett | 2,351 | 9.8 | N/A | |
| Conservative | Chris Stevens | 1,621 | 6.8 | N/A | |
| Socialist Alliance | Ian Thomas | 475 | 2.0 | N/A | |
| Majority | 604 | 2.5 | N/A | ||
| Turnout | 23,927 | 47.3 | N/A | ||
| Plaid Cymru win (new seat) | |||||
References
- ↑ "Wales elections > Islwyn". BBC News. 6 May 2011.