Teechart
TeeChart is a charting library for programmers developed and managed by Steema Software of Girona, Spain.[1] It is available as commercial and non-commercial software. Borland (later handing on the IDE business to Embarcadero Technologies) has included a standard version of TeeChart as an integral part of the toolbox palette in most Borland Delphi and C++ Builder Integrated development environment (IDEs) since 1997, and TeeChart currently forms a part of Embarcadero RAD Studio 10 Seattle.[2][3] TeeChart Pro version is a commercial product that offers shareware releases for all of its formats, TeeChart. Lite for .NET [4] is a free charting component for the Microsoft Visual Studio .NET community and TeeChart for PHP [5] is an open-source library for PHP environments. The TeeChart Charting Library offers Charts, Maps and Gauge (instrument)[6] in versions for Delphi VCL and FireMonkey (FMX), Activex, C Sharp (programming language) for Microsoft Visual Studio .NET, Java (programming language) and PHP. Full sourcecode has always been available for all versions except the ActiveX version. TeeChart's user interface is translated into 37 languages.[7]
History
The first version of TeeChart was authored in 1995 by David Berneda, co-founder of Steema, using the Borland Delphi Visual Component Library programming environment[1] and TeeChart was first released as a shareware version and made available via Compuserve in the same year.[8] It was written in the first version of Delphi VCL, as a 16-bit Charting Library named TeeChart version 1.[8] The next version of TeeChart was released as a 32-bit library (Delphi 2 supported 32-bit compilation) but was badged as TeeChart VCL v3 to coincide with Borland's naming convention for inclusion on the toolbox palette of Borland Delphi v3 in 1997[2] and with C++ Builder v3 in 1998.[9] It has been on the Delphi/C++ Builder toolbox palette ever since. The current version is Embarcadero RAD Studio 10 Seattle.[3]
TeeChart's first ActiveX version named "version 3" too, to match the VCL version's nomenclature, was released in 1998.[8] The version was optimised to work with Microsoft's Visual Studio v97 and v6.0 developer suites that include Visual Basic and Microsoft Visual C++ programming languages. Support for new programming environments followed with TeeChart's first native C# version for Microsoft Visual Studio .NET released in 2002[8] and TeeChart.Lite for .NET, a free charting component, released for Visual Studio.NET in 2003[8] and supporting too, Mono (programming). Steema Software released the first native TeeChart Java (programming language) version in 2006[8] and TeeChart's first native PHP version was released in 2009 and published as open-source in June 2010.[8] Mobile versions of TeeChart, for Android (operating system) devices and Windows Phone 7 devices were released during the first half of 2011.[8] In 2012 TeeChart extended functionality to iPhone/iPad and BlackBerry OS devices and a new JavaScript version was released in the same year to support HTML5 Canvas. In 2013 Steema launched TeeChart for .NET Chart for Windows Store applications and included support for Microsoft's Windows Phone 8 mobile platform.[8] TeeChart for Xamarin.Forms written with 100% C# code and cross-platform support for .NET desktops, Windows Phone, iOS and Android was released in 2014. Also since 2014 Webforms charts now offers HTML5 interactivity.[8]
Usage
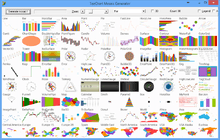
TeeChart is a general purpose charting component designed for use in differing ambits, offering a wide range of aesthetics to chart data. Generally TeeCharts published in the field, in areas where large amounts of data must be interpreted regularly, remain by designer choice in their simplest form to maximize the "data-ink ratio".[10] Sloan Digital Sky Survey, SDSS Web Services' use for charting "Scientific .. plotting of online data"[11] at The Virtual Observatory Spectrum Services[12] reflects that approach. The SDSS chart authors choose to represent data using TeeChart's standard 2D line display. Speed is also a factor when choosing how to most effectively plot data. Realtime data, at frequencies of up to tens or hundreds of data points or more per second, require the most processor economic approach to charting. Computer processing time dedicated to the plotting of data needs to be as lightweight as possible, freeing-up computer tasks "to achieve real-time data acquisition, display and analysis".[13]
An important and stated aspect of many data visualisation applications is the ability to offer interactivity to the user; NASA's document, the Orbital Debris Engineering Model Model ORDEM 3.0 - User's Guide, 2014, states that "The user may manipulate the graphs to zoom, pan, and copy to the clipboard and export to various file types"[14] and Computer and Computing Technologies in Agriculture II, Volume 1, Daoliang, Li; Chunjiang, Zhao (2009), also using TeeChart, states "the properties at any point in the chart can be viewed moving the mouse over it".[15] Writing about control education, Juha Lindfors states "The desired charting functionality (such as zooming and scaling) is achieved..".[16]
Charting applications have become increasingly 'onlined', made available either to a wider public or to a territorially remote userbase via networked applications. The World wide web (the Web) has become "by far, the most popular Internet protocol" to disseminate online applications. Most major IDEs now offer environments for web application developede aimed at browser hosted applications. Charting components, TeeChart among them, have adapted to provide models that work within a browser environment, often using static images and scripted layering techniques such as Ajax (programming) to offer a level of interactivity, improve response times and hide apparent delay from the user. Options to enrich client, browser-side processing flexibility are exploited by TeeChart libraries via modules that offer 'micro-environments' within the browser, such as the long established ActiveX technology, Adobe Flash, Microsoft Silverlight or Java Applets. Serverside environments offer too, a means to interact with browser based script to dynamically respond to charting requests. Joomla and CodeIgniter are host environments for TeeChart PHP and an example of an Embarcadero IntraWeb VCL designed application using TeeChart, is documented here.[17]
Programmer reference
The Code Project includes a demo that uses TeeChart.Lite, called 'Self-Organizing Feature Maps (Kohonen maps)' written by Bashir Magomedovl[18] and SourceForge includes a Database Stress and Monitor that also uses TeeChart.Lite.[19]
Books and information sources that include substantial sections about working with the Delphi version of TeeChart include "Mastering Delphi 6" by Marco Cantù,[20] "C++ Builder 5 developer's guide",[21] a video Delphi Tutorial on charting JPEG compression[22] and support forums and reference pages at TeeChart Support Forums.[23] Non-English language document sources include, in Czech "Myslíme v jazyku Delphi 7: knihovna zkušeného programátora" by Marco Cantù,[24] and Chinese, Delphi 6,[25] Delphi,[26] and Delphi 5.[27]
See also
References
- 1 2 Steema Software SL. "Steema Software Company Page". Retrieved September 2015. Check date values in:
|access-date=(help) - 1 2 Bob Swart. "Porting Delphi 1.x code to 32-bits". www.drbob42.com. Retrieved May 2010. Check date values in:
|access-date=(help) - 1 2 Embarcadero Technologies (2011), Embarcadero RAD Studio Feature Matrix (PDF), retrieved September 2015 Check date values in:
|access-date=(help) - ↑ Steema Software SL. "TeeChart .NET Lite Charting Components". Retrieved September 2015. Check date values in:
|access-date=(help) - ↑ Steema Software SL. "TeeChart PHP Open Source Charting Components". Retrieved September 2015. Check date values in:
|access-date=(help) - ↑ Steema Software SL. "TeeChart Gallery". Retrieved September 2015. Check date values in:
|access-date=(help) - ↑ Steema Software SL. "TeeChart VCL / FMX specifications". Retrieved September 2015. Check date values in:
|access-date=(help) - 1 2 3 4 5 6 7 8 9 10 Steema Software SL. "Key dates and build history". Retrieved September 2015. Check date values in:
|access-date=(help) - ↑ Biggs, Maggie (1998), "Borland Rounds out C++ Builder", InfoWorld, 20 (8): 108, ISSN 0199-6649
- ↑ Tufte, Edward Rolf (2001), The visual display of quantitative information, Graphics Press, ISBN 978-0-9613921-4-7
- ↑ Budavári, Tamás (2004), Coding against the Universe (PDF), Royal Observatory Edinburgh, p. 10, retrieved February 2016 Check date values in:
|access-date=(help) - ↑ The Virtual Observatory Spectrum Services
- ↑ Zheng, Xiaofeng; Zeng, Qiyong; Wu, Kai; Yu, Zhonghua; Li, Xiaotong (2010), IEEE Computer Society, ed., Cutting Temperature and Force Data Acquisition and Measuring System Design in High Speed Machining, Changsha, China, pp. 882–885, ISBN 978-0-7695-3962-1
- ↑ Stansbery, Eugene G.; Krisko, Paula H. (April 2014), "NASA Orbital Debris Engineering Model ORDEM 3.0 - User's Guide" (PDF), www.sti.nasa.gov, Texas: NASA Orbital Debris Program Office, p. 17, retrieved April 2014 Check date values in:
|access-date=(help) - ↑ Daoliang, Li; Chunjiang, Zhao (2009), Computer and Computing Technologies in Agriculture II, Volume 1, New York: Springer Science+Business Media, p. 82, ISBN 978-1-4419-0208-5
- ↑ Lindfors, Juha (2003), Advances in control education 2003, Oxford: Elsevier, p. 172, ISBN 978-0-08-043559-6
- ↑ Reddy, S.M.; Mazumder, R.; Evans, D.A.D; Collins, A.S. (2009), Palaeoproterozoic Supercontinents and Global Evolution, London: The Geological Society, p. 31, ISBN 978-1-86239-283-0
- ↑ Magomedovl, Bashir (November 7, 2006). "Self-Organizing Feature Maps (Kohonen maps)". www.codeproject.com/\. Retrieved May 2010. Check date values in:
|access-date=(help) - ↑ mehyaa (October 30, 2009). "Database Stress and Monitor". Retrieved May 2010. Check date values in:
|access-date=(help) - ↑ Cantù, Marco (2001), "Chapter 13: Delphi's Database Architecture", Mastering Delphi 6 - Mastering Series, California: Sybex, p. 550, ISBN 978-0-7821-2874-1
- ↑ Hollingworth, Jarrod (2000), C++ Builder 5 developer's guide, USA: Sams Publishing, p. 932, ISBN 978-0-672-31972-3
- ↑ Christie, Alister (July 30, 2008). "Delphi Programming Tutorial #38 - Charting Jpeg Compression". CodeGearGuru.com. Retrieved April 2014. Check date values in:
|access-date=(help) - ↑ TeeChart Support Forums
- ↑ Cantù, Marco (2003), Myslíme v jazyku Delphi 7: knihovna zkušeného programátora (in Czech), Praga: Grada Publishing, p. 17, ISBN 978-80-247-0694-8
- ↑ 刘艺 (2002), "Chapter 17", in DynoMedia, Delphi 6 企业级解决方案及应用剖析 (in Chinese), ISBN 978-7-111-10435-3
- ↑ 杨宗志 (2001), "Chapter 10", Delphi 数据库程序设计 (in Chinese), Beijing: Tsinghua University Press, p. 201, ISBN 978-7-900637-44-4
- ↑ DynoMedia, ed. (2000), "Chapter 9", Delphi 5 数据库开发技术 (in Chinese), p. 245, ISBN 978-7-111-07820-3