St Albans City and District Council election, 2015
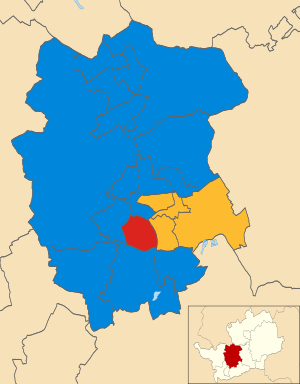
2015 local election results in St Albans
The 2015 St Albans City and District Council election is scheduled to take place on 7 May 2015 to elect members of St Albans City and District Council in England.[1] This is on the same day as other local elections.
Ward results
Ashley
| Party | Candidate | Votes | % | ± | |
|---|---|---|---|---|---|
| Liberal Democrat | Mohammad Zia | 1,306 | |||
| Labour | Anne Lyons | 1,248 | |||
| Conservative | Emre Kaya | 1,193 | |||
| Green | Robert Whitford | 360 | |||
| UKIP | Charles Mason | 313 | |||
| Majority | |||||
| Turnout | |||||
| Liberal Democrat hold | Swing | ||||
Batchwood
| Party | Candidate | Votes | % | ± | |
|---|---|---|---|---|---|
| Conservative | Timothy Smith | 1,368 | |||
| Labour | Martin Leach | 1,348 | |||
| Liberal Democrat | Elizabeth Needham | 654 | |||
| UKIP | Matthew Dovey | 378 | |||
| Green | Lee Evans | 300 | |||
| Majority | |||||
| Turnout | |||||
| Conservative gain from Labour | Swing | ||||
Clarence
| Party | Candidate | Votes | % | ± | |
|---|---|---|---|---|---|
| Liberal Democrat | Samuel Rowlands | 1,606 | |||
| Conservative | Barry Sumpter | 1,375 | |||
| Labour | Jane Cloke | 683 | |||
| Green | Charis Jennings | 399 | |||
| TUSC | Keith Hussey | 28 | |||
| Majority | |||||
| Turnout | |||||
| Liberal Democrat hold | Swing | ||||
Colney Heath
| Party | Candidate | Votes | % | ± | |
|---|---|---|---|---|---|
| Liberal Democrat | Christopher Brazier | 1,421 | |||
| Conservative | Stella Nash | 994 | |||
| Labour | John Paton | 417 | |||
| UKIP | Christopher Thorpe | 255 | |||
| Green | Timothy Robinson | 159 | |||
| Majority | |||||
| Turnout | |||||
| Liberal Democrat hold | Swing | ||||
Cunningham
| Party | Candidate | Votes | % | ± | |
|---|---|---|---|---|---|
| Liberal Democrat | Robert Donald | 1,233 | |||
| Conservative | Michael Roth | 936 | |||
| Labour Co-op | John Metcalf | 743 | |||
| UKIP | Alan Malin | 371 | |||
| Green | Rebecca Hurst | 217 | |||
| Majority | |||||
| Turnout | |||||
| Liberal Democrat hold | Swing | ||||
Harpenden East
| Party | Candidate | Votes | % | ± | |
|---|---|---|---|---|---|
| Conservative | Michael Wakely | 2,020 | |||
| Independent | Phillipa Martyn | 829 | |||
| Labour Co-op | Rosemary Ross | 632 | |||
| Liberal Democrat | Paul De Kort | 571 | |||
| Majority | |||||
| Turnout | |||||
| Conservative hold | Swing | ||||
Harpenden North
| Party | Candidate | Votes | % | ± | |
|---|---|---|---|---|---|
| Conservative | Albert Pawle | 2,179 | |||
| Independent | John Chambers | 565 | |||
| Labour | Linda Spiri | 524 | |||
| Liberal Democrat | Aileen King | 467 | |||
| Green | William Day | 324 | |||
| Majority | |||||
| Turnout | |||||
| Conservative hold | Swing | ||||
Harpenden South
| Party | Candidate | Votes | % | ± | |
|---|---|---|---|---|---|
| Conservative | Brian Ellis | 2,756 | |||
| Labour | George Fraser | 600 | |||
| Liberal Democrat | Gillian Tattersfield | 503 | |||
| Independent | John Hansen | 293 | |||
| Majority | |||||
| Turnout | |||||
| Conservative hold | Swing | ||||
Harpenden West
| Party | Candidate | Votes | % | ± | |
|---|---|---|---|---|---|
| Conservative | Daniel Chichester-Miles | 2,670 | |||
| Labour Co-op | David Lawlor | 633 | |||
| Liberal Democrat | Jeffrey Phillips | 582 | |||
| Independent | Paul Howe | 496 | |||
| Majority | |||||
| Turnout | |||||
| Conservative hold | Swing | ||||
London Colney
| Party | Candidate | Votes | % | ± | |
|---|---|---|---|---|---|
| Conservative | Simon Calder | 1,882 | |||
| Labour | Jacob Quagliozzi | 1,737 | |||
| UKIP | Colin Botterill | 587 | |||
| Liberal Democrat | Matthew Farrell | 434 | |||
| Green | Anna Kinnersley | 198 | |||
| Majority | |||||
| Turnout | |||||
| Conservative gain from Labour | Swing | ||||
Marshalswick North
| Party | Candidate | Votes | % | ± | |
|---|---|---|---|---|---|
| Conservative | Carolyn Bolton | 1,443 | |||
| Liberal Democrat | Geoffrey Churchard | 1,326 | |||
| Labour | Richard Harris | 485 | |||
| UKIP | Michael Hollins | 337 | |||
| Green | James Lomas | 256 | |||
| Majority | |||||
| Turnout | |||||
| Conservative gain from Liberal Democrat | Swing | ||||
Marshalswick South
| Party | Candidate | Votes | % | ± | |
|---|---|---|---|---|---|
| Conservative | Mehmey Gaygusuz | 1,915 | |||
| Liberal Democrat | Mark Pedroz | 1,055 | |||
| Labour | Vivienne Windle | 721 | |||
| Green | Miriam Gilbert | 391 | |||
| UKIP | David Dickson | 217 | |||
| Majority | |||||
| Turnout | |||||
| Conservative hold | Swing | ||||
Park Street
| Party | Candidate | Votes | % | ± | |
|---|---|---|---|---|---|
| Conservative | Paul Wright | 1,519 | |||
| Liberal Democrat | Jadwiga Baillie | 1,203 | |||
| UKIP | Paul Tilyard | 593 | |||
| Labour Co-op | Martin McGrath | 587 | |||
| Green | Lesley Baker | 185 | |||
| Majority | |||||
| Turnout | |||||
| Conservative hold | Swing | ||||
Redbourn
| Party | Candidate | Votes | % | ± | |
|---|---|---|---|---|---|
| Conservative | Paul Wright | 2,075 | |||
| Labour | Nicholas Pullinger | 541 | |||
| UKIP | Daragh Cahalane | 400 | |||
| Liberal Democrat | Michael Morton | 337 | |||
| Green | Joseph French | 210 | |||
| Majority | |||||
| Turnout | |||||
| Conservative hold | Swing | ||||
Sandridge
| Party | Candidate | Votes | % | ± | |
|---|---|---|---|---|---|
| Conservative | Frances Leonard | 1,703 | |||
| Liberal Democrat | Stefania Estacchini | 501 | |||
| Labour | Michael Gary-Higgings | 415 | |||
| Green | Paul Quinn | 305 | |||
| Majority | |||||
| Turnout | |||||
| Conservative hold | Swing | ||||
Sopwell
| Party | Candidate | Votes | % | ± | |
|---|---|---|---|---|---|
| Labour | Eileen Harris | 1,347 | |||
| Liberal Democrat | David Poor | 1,055 | |||
| Conservative | Panagiotis Yfantoudas | 880 | |||
| UKIP | Valerie Hargrave | 315 | |||
| Green | Gail Jackson | 282 | |||
| Majority | |||||
| Turnout | |||||
| Labour hold | Swing | ||||
St. Peters
| Party | Candidate | Votes | % | ± | |
|---|---|---|---|---|---|
| Conservative | Alexander Campbell | 1,634 | |||
| Liberal Democrat | Matthew Jones | 1,250 | |||
| Labour | Alexander Veitch | 778 | |||
| Green | Jill Mills | 741 | |||
| UKIP | Michael Douglas | 191 | |||
| Majority | |||||
| Turnout | |||||
| Conservative hold | Swing | ||||
St. Stephen
| Party | Candidate | Votes | % | ± | |
|---|---|---|---|---|---|
| Conservative | David Winstone | 2,078 | |||
| Liberal Democrat | Alison Ross | 920 | |||
| UKIP | Peter Whitehead | 527 | |||
| Labour | Janet Blackwell | 442 | |||
| Green | Lydia El-Khouri | 163 | |||
| Majority | |||||
| Turnout | |||||
| Conservative hold | Swing | ||||
Verulam
| Party | Candidate | Votes | % | ± | |
|---|---|---|---|---|---|
| Conservative | Jessica Chivers | 2,183 | |||
| Liberal Democrat | Trisha Windsor-Williams | 1,298 | |||
| Labour Co-op | Michael Bartlet | 533 | |||
| Green | Mark Ewington | 282 | |||
| UKIP | Colin Donald | 252 | |||
| Majority | |||||
| Turnout | |||||
| Conservative hold | Swing | ||||
Wheathampstead
| Party | Candidate | Votes | % | ± | |
|---|---|---|---|---|---|
| Conservative | Sandra Wood | 2,244 | |||
| Liberal Democrat | Harriet Sherlock | 746 | |||
| Labour Co-op | Gavin Ross | 456 | |||
| Green | Ian Troughton | 283 | |||
| Majority | |||||
| Turnout | |||||
| Conservative hold | Swing | ||||
References
- ↑ "Upcoming elections & referendums". The Electoral Commission. Archived from the original on 15 March 2015. Retrieved 24 April 2015.
This article is issued from Wikipedia - version of the 9/15/2016. The text is available under the Creative Commons Attribution/Share Alike but additional terms may apply for the media files.