South Australian state election, 2002
|
| 9 February 2002 (2002-02-09) |
|
|
|
|
|
State elections were held in South Australia on 9 February 2002. All 47 seats in the South Australian House of Assembly were up for election. The incumbent Liberal Party of Australia led by Premier of South Australia Rob Kerin was defeated by the Australian Labor Party led by Leader of the Opposition Mike Rann.
House of Assembly (IRV) — Turnout 93.59% (CV) — Informal 3.12%
| Party |
Votes |
% |
Swing |
Seats |
Change |
|---|
| |
Liberal Party of Australia |
378,929 |
39.97 |
-0.43 |
20 |
-3 |
| |
Australian Labor Party |
344,559 |
36.34 |
+1.18 |
23 |
+2 |
| |
Australian Democrats |
71,026 |
7.49 |
-8.95 |
0 |
0 |
| |
Family First Party |
25,025 |
2.64 |
* |
0 |
0 |
| |
One Nation Party |
22,833 |
2.41 |
* |
0 |
0 |
| |
SA Greens |
22,332 |
2.36 |
* |
0 |
0 |
| |
Nationals SA |
13,748 |
1.45 |
-0.29 |
1 |
0 |
| |
Independents |
40,288 |
4.25 |
+1.12 |
3 |
+2 |
| |
Other |
29,292 |
3.09 |
|
0 |
0 |
| |
Total |
948,032 |
|
|
47 |
|
| |
Australian Labor Party |
WIN |
49.10 |
+0.60 |
24 |
+3 |
| |
Liberal Party of Australia |
|
50.90 |
-0.60 |
23 |
-3 |
Independents: Rory McEwen, Bob Such, Peter Lewis
Background
This was the first election since Labor narrowly lost as opposition in the 1997 election, doing much better than most analysts predicted, forcing the Liberals to minority government after their comprehensive loss in the 1993 election where Labor were reduced to just ten seats. Coming into the 2002 election, the Liberal Government had faced a number of scandals including the Motorola affair, over which Premier John Olsen was forced to resign. He was succeeded by Rob Kerin, who had only six months to govern before the election was called.
Labor won two seats from the Liberals, the districts of Adelaide (Jane Lomax-Smith) and Colton (Paul Caica). This gave Labor 23 seats, Liberals 20 seats, SA Nationals one seat, and three seats to independents. In order to form majority government, a party needed 24 seats out of 47. Most analysts expected Kerin to form a minority government with the support of all four of the crossbench.
On 13 February, Liberal-turned-independent Peter Lewis announced that he had signed an agreement with Labor leader Mike Rann to support a Labor Government in exchange for holding a constitutional convention, making him speaker of the House of Assembly, and concessions for his electorate including the phasing out of commercial fishing in the River Murray, prioritising the eradication of the branched broomrape weed, changing water rates for irrigation, fast-tracking a feasibility study for a weir and lock at Wellington, and improving rural roads. This agreement effectively made Rann premier-elect. However, following parliamentary precedent established by Don Dunstan following the 1968 election, the Kerin Government refused to resign until after Rann and Labor demonstrated that they had majority support on the floor of the House of Assembly. Kerin argued that since the Liberals had won a 50.9 percent two-party vote, they had a mandate to stay in office. The Liberal Government was defeated on the floor of the House of Assembly on 5 March 2002, with Rann becoming Premier and leader of the Rann Government on 6 March.
Post-election Pendulum
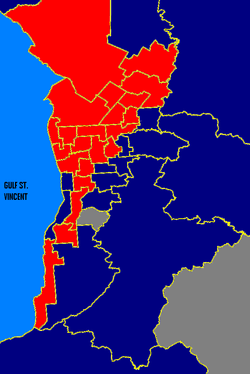
Metro SA: ALP in red, Liberal in blue, Independents in white. These boundaries are based on the 2006 electoral redistribution.
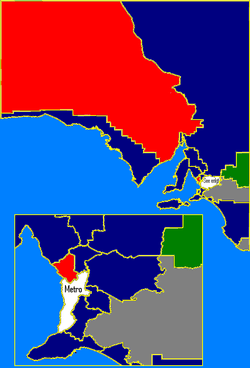
Rural SA: ALP in red, Liberal in blue, Independents in white, Nationals in green. These boundaries are based on the 2006 electoral redistribution.
In the Legislative Council, Liberal won 5 seats (Robert Lawson, Caroline Schaefer, Angus Redford, David Ridgway, Terry Stephens), Labor won 4 seats (Gail Gago, Paul Holloway, Terry Roberts, John Gazzola), Australian Democrats won 1 seat (Sandra Kanck), and the recently formed Family First party won their first ever seat in an Australian parliament (Andrew Evans).
This left the overall numbers in the Legislative Council at: Liberal 9, Labor 7, Democrats 3, Family First 1, and 2 independents (Terry Cameron and Nick Xenophon).
The sole balance of power was held unbroken by the Australian Democrats since their inception in the mid-1970s. Though the Democrats would exceed 16 percent of the vote in 1997, during the parliamentary term the Democrats lost the sole balance of power for the first time, sharing the balance of power with independent members, slowly losing numbers and influence, until they were eventually without parliamentary representation as of the 2010 election.
See also
References
External links
- General information
- Political Parties
.jpg)
