Souris—Moose Mountain
Souris—Moose Mountain Saskatchewan electoral district Saskatchewan electoral district |
|---|
|
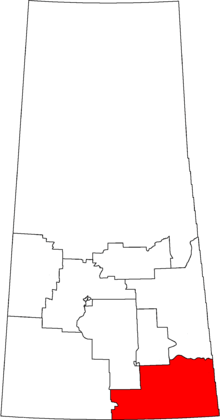
Souris—Moose Mountain in relation to other Saskatchewan federal electoral districts as of the 2013 Representation Order. |
| Federal electoral district |
|---|
| Legislature |
House of Commons |
|---|
| MP |
Robert Kitchen
Conservative |
|---|
| District created |
1987 |
|---|
| First contested |
1988 |
|---|
| Last contested |
2015 |
|---|
| District webpage |
profile, map |
|---|
| Demographics |
|---|
| Population (2011)[1] |
72,058 |
|---|
| Electors (2015) |
51,580 |
|---|
| Area (km²)[2] |
43,184 |
|---|
| Pop. density (per km²) |
1.7 |
|---|
| Census subdivisions |
Estevan, Weyburn, Moosomin, Grenfell, Carlyle, Kipling, Oxbow, Redvers, Carnduff |
|---|
Souris—Moose Mountain is a federal electoral district in Saskatchewan, Canada, that has been represented in the House of Commons of Canada since 1988.
Geography
This electoral district is located in Southeast Saskatchewan, encompassing the cities of Weyburn and Estevan. The riding extends from Radville in the west to the Manitoba border, and from Estevan to Grenfell and the Qu'Appelle River in the north.
History
This district was created in 1987 from Qu'Appelle—Moose Mountain and portions of the Assiniboia riding.
This riding lost a fraction of territory to Moose Jaw—Lake Centre—Lanigan and gained territory from Wascana during the 2012 electoral redistribution.
Members of Parliament
Current Member of Parliament
Its Member of Parliament is Ed Komarnicki, a lawyer. He was first elected to Parliament in the 2004 election. He is a member of the Conservative Party of Canada. While in the Opposition, Komarnicki was the Conservative critic for Labour and Housing. In the last parliamentary session, he served as a member on the 'Standing Committee on Human Resources, Skills Development, Social Development and the Status of Persons with Disabilities'.
Election results
| Canadian federal election, 2011 |
| Party |
Candidate |
Votes | % | ∆% | Expenditures |
|
Conservative | Ed Komarnicki | 21,598 | 74.0 | +3.5 | $45,028 |
|
New Democratic | Allan Arthur | 5,461 | 18.7 | +1.9 | $11,460 |
|
Liberal | Gerald Borrowman | 1,236 | 4.2 | –2.5 | $30,532 |
|
Green | Bob Deptuck | 898 | 3.1 | –2.9 | $483 |
| Total valid votes |
29,193 | 100.0 | | – |
| Total rejected ballots |
77 | 0.3 | 0.0 |
| Turnout |
29,270 | 64.0 | +3 |
| Eligible voters |
46,242 | – | – |
| Canadian federal election, 2008 |
| Party |
Candidate |
Votes | % | ∆% | Expenditures |
|
Conservative | Ed Komarnicki | 19,293 | 70.5 | +7.7 | $43,314 |
|
New Democratic | Raquel Fletcher | 4,599 | 16.8 | +2.9 | $6,182 |
|
Liberal | Marlin Belt | 1,834 | 6.7 | -11.8 | – |
|
Green | Bob Deptuck | 1,643 | 6.0 | +1.3 | $2,093 |
| Total valid votes/Expense limit |
27,369 | 100.0 | | $89,152 |
| Total rejected ballots |
90 | 0.3 | 0.0 |
| Turnout |
27,459 | 57 | -8 |
| Canadian federal election, 2006 |
| Party |
Candidate |
Votes | % | ∆% | Expenditures |
|
Conservative | Ed Komarnicki | 19,282 | 62.8 | +25.9 | $40,537 |
|
Liberal | Lonny McKague | 5,681 | 18.5 | -1.1 | $42,576 |
|
New Democratic | Michael Haukeness | 4,284 | 14.0 | +0.2 | $6,329 |
|
Green | Mathew Smith | 1,448 | 4.7 | +3.0 | $518 |
| Total valid votes |
30,695 | 100.0 | | – |
| Total rejected ballots |
83 | 0.3 | 0.0 |
| Turnout |
30,778 | 65.3 | +2.3 |
| Canadian federal election, 2004 |
| Party |
Candidate |
Votes | % | ∆% | Expenditures |
|
Conservative | Ed Komarnicki | 11,306 | 36.9 | -33.1 | $52,238 |
|
Independent | Grant Devine | 8,399 | 27.4 | – | $69,162 |
|
Liberal | Lonny McKague | 6,001 | 19.6 | +5.2 | $44,913 |
|
New Democratic | Robert Stephen Stringer | 4,202 | 13.7 | -1.9 | $15,033 |
|
Green | Sigfredo Gonzalez | 537 | 1.8 | – | |
|
Christian Heritage | Robert Thomas Jacobson | 191 | 0.6 | – | $194 |
| Total valid votes |
30,636 | 100.0 | | – |
| Total rejected ballots |
83 | 0.3 | -0.1 |
| Turnout |
30,719 | 63.0 | 0.0 |
| Canadian federal election, 2000 |
| Party |
Candidate |
Votes | % | ∆% | Expenditures |
|
Alliance | Roy Bailey | 19,278 | 63.3 | +22.1 | $32,614 |
|
New Democratic | Tom Cameron | 4,755 | 15.6 | -3.0 | $12,747 |
|
Liberal | Myles Fuchs | 4,371 | 14.3 | -12.9 | $11,644 |
|
Progressive Conservative | Larry Gabruch | 2,060 | 6.8 | -6.2 | – |
| Total valid votes |
30,464 | 100.0 | | – |
| Total rejected ballots |
98 | 0.3 | -0.1 |
| Turnout |
30,562 | 63.0 | +4.0 |
| Canadian federal election, 1997 |
| Party |
Candidate |
Votes | % | ∆% | Expenditures |
|
Reform | Roy Bailey | 13,732 | 41.2 | +10.5 | $24,042 |
|
Liberal | Bernie Collins | 9,077 | 27.2 | -5.0 | $42,840 |
|
New Democratic | Gary Lake | 6,209 | 18.6 | +2.1 | $26,063 |
|
Progressive Conservative | Greg Douglas | 4,333 | 13.0 | -2.0 | $11,530 |
| Total valid votes |
33,351 | 100.0 | | – |
| Total rejected ballots |
128 | 0.4 |
| Turnout |
33,479 | 67.0 |
See also
References
Notes
External links
.png)