Sheffield City Council election, 1988
| | |||||||||||||||||||||||||||||||
| |||||||||||||||||||||||||||||||
| |||||||||||||||||||||||||||||||
|
| |||||||||||||||||||||||||||||||
| Map showing the results of the 1988 Sheffield City Council elections. | |||||||||||||||||||||||||||||||
| |||||||||||||||||||||||||||||||
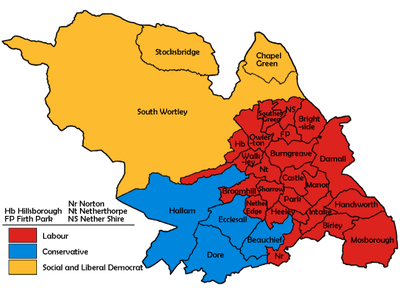
Elections to Sheffield City Council were held on 5 May 1988. One third of the council was up for election.
Election result
| Sheffield Local Election Result 1988 | ||||||||||
|---|---|---|---|---|---|---|---|---|---|---|
| Party | Seats | Gains | Losses | Net gain/loss | Seats % | Votes % | Votes | +/− | ||
| Labour | 23 | 1 | 0 | +1 | 76.6 | 58.9 | 84,640 | +7.8% | ||
| Conservative | 4 | 0 | 1 | -1 | 13.3 | 22.1 | 31,685 | +1.1% | ||
| Social and Liberal Democrats | 3 | 0 | 0 | 0 | 10.0 | 16.4 | 23,579 | -11.3% | ||
| Social Democratic | 0 | 0 | 0 | 0 | 0.0 | 1.8 | 2,591 | +1.8% | ||
| Green | 0 | 0 | 0 | 0 | 0.0 | 0.6 | 900 | +0.5% | ||
| Communist | 0 | 0 | 0 | 0 | 0.0 | 0.1 | 161 | +0.1% | ||
This result had the following consequences for the total number of seats on the Council after the elections:
| Party | Previous council | New council | |||
|---|---|---|---|---|---|
| Labour | 65 | 66 | |||
| Conservatives | 13 | 12 | |||
| Social and Liberal Democrats | 9 | 9 | |||
| Total | 87 | 87 | |||
| Working majority | 43 | 45 | |||
Ward results
| Party | Candidate | Votes | % | ± | |
|---|---|---|---|---|---|
| Conservative | Danny George | 2,456 | 34.4 | -2.3 | |
| Social and Liberal Democrats | Peter Moore | 2,365 | 33.1 | +0.2 | |
| Labour | Roy Munn | 2,181 | 30.6 | +0.2 | |
| Social Democratic | Robert Shillito | 128 | 1.8 | +1.8 | |
| Majority | 91 | 1.3 | -2.5 | ||
| Turnout | 7,130 | 46.8 | -6.3 | ||
| Conservative hold | Swing | -1.2 | |||
| Party | Candidate | Votes | % | ± | |
|---|---|---|---|---|---|
| Labour | Val Shepherd | 3,804 | 71.3 | +11.5 | |
| Conservative | Gordon Millward | 938 | 17.6 | -0.4 | |
| Social and Liberal Democrats | Cyril Skipworth | 588 | 11.0 | -11.2 | |
| Majority | 2,866 | 53.7 | +16.1 | ||
| Turnout | 5,330 | 32.9 | -6.3 | ||
| Labour hold | Swing | +5.9 | |||
| Party | Candidate | Votes | % | ± | |
|---|---|---|---|---|---|
| Labour | Peter Price | 2,658 | 81.0 | +9.9 | |
| Conservative | Jeremy Richardson | 350 | 10.7 | -1.0 | |
| Social and Liberal Democrats | Peter McNutt | 270 | 8.2 | -8.9 | |
| Majority | 2,308 | 70.3 | +16.3 | ||
| Turnout | 3,278 | 24.9 | -6.8 | ||
| Labour hold | Swing | +5.4 | |||
| Party | Candidate | Votes | % | ± | |
|---|---|---|---|---|---|
| Labour | Kevin Mahoney | 2,103 | 40.0 | +1.7 | |
| Conservative | Sid Cordle | 1,960 | 37.3 | +6.8 | |
| Social and Liberal Democrats | Jane Padget | 742 | 14.1 | -17.1 | |
| Green | Andrew Womack | 347 | 6.6 | +6.6 | |
| Social Democratic | Oliver Waterlow | 104 | 2.0 | +2.0 | |
| Majority | 143 | 2.7 | -4.4 | ||
| Turnout | 5,256 | 38.0 | -7.6 | ||
| Labour gain from Conservative | Swing | -2.5 | |||
| Party | Candidate | Votes | % | ± | |
|---|---|---|---|---|---|
| Labour | Phyllis Smith | 2,846 | 72.7 | +6.2 | |
| Labour | John Watson | 2,702 | |||
| Conservative | Dianne Watson | 543 | 13.9 | +1.9 | |
| Conservative | Anne Smith | 518 | |||
| Social and Liberal Democrats | Sheila Hughes | 292 | 7.4 | -14.1 | |
| Social and Liberal Democrats | Sheila Rehman | 288 | |||
| Social Democratic | Victoria Dean | 155 | 3.9 | +3.9 | |
| Communist | Brian Turley | 76 | 1.9 | +1.9 | |
| Majority | 2,159 | 58.8 | +13.8 | ||
| Turnout | 3,912 | 31.6 | -4.9 | ||
| Labour hold | Swing | ||||
| Labour hold | Swing | +2.1 | |||
| Party | Candidate | Votes | % | ± | |
|---|---|---|---|---|---|
| Labour | Thomas Bower | 2,795 | 84.3 | +6.8 | |
| Conservative | Joan Graham | 344 | 10.4 | -0.3 | |
| Social and Liberal Democrats | Donald Smith | 176 | 5.3 | -6.4 | |
| Majority | 2,451 | 73.9 | +8.1 | ||
| Turnout | 3,315 | 25.6 | -5.3 | ||
| Labour hold | Swing | +3.5 | |||
| Party | Candidate | Votes | % | ± | |
|---|---|---|---|---|---|
| Social and Liberal Democrats | David Chadwick | 3,161 | 47.4 | -6.8 | |
| Labour | Eldon Hanson | 3,005 | 45.0 | +6.0 | |
| Conservative | Cecilia Holt | 403 | 6.0 | -0.7 | |
| Social Democratic | David Richie | 103 | 1.5 | +1.5 | |
| Majority | 156 | 2.4 | -12.8 | ||
| Turnout | 6,672 | 37.1 | -9.8 | ||
| Social and Liberal Democrats hold | Swing | -6.4 | |||
| Party | Candidate | Votes | % | ± | |
|---|---|---|---|---|---|
| Labour | Sandra Robinson | 3,194 | 73.1 | +9.8 | |
| Conservative | Philip Kirby | 676 | 15.5 | -0.8 | |
| Social and Liberal Democrats | Dennis Boothroyd | 497 | 11.4 | -9.0 | |
| Majority | 2,518 | 57.6 | +14.7 | ||
| Turnout | 4,367 | 29.2 | -5.9 | ||
| Labour hold | Swing | +5.3 | |||
| Party | Candidate | Votes | % | ± | |
|---|---|---|---|---|---|
| Conservative | David Heslop | 3,685 | 57.2 | +5.7 | |
| Labour | Glenn Ellis | 1,850 | 28.7 | +3.0 | |
| Social and Liberal Democrats | Janice Sidebottom | 655 | 10.2 | -12.6 | |
| Social Democratic | Marguerite Crangle | 248 | 3.8 | +3.8 | |
| Majority | 1,835 | 28.5 | +2.7 | ||
| Turnout | 6,438 | 38.6 | -9.4 | ||
| Conservative hold | Swing | +1.3 | |||
| Party | Candidate | Votes | % | ± | |
|---|---|---|---|---|---|
| Conservative | Bobbie Fleming | 3,515 | 54.3 | +2.3 | |
| Labour | Timothy Plant | 1,468 | 22.7 | +3.3 | |
| Social and Liberal Democrats | Christine Freeman | 1,044 | 16.1 | -12.5 | |
| Green | Clare Jenkins | 280 | 4.3 | +4.3 | |
| Social Democratic | Peter Sorby | 165 | 2.5 | +2.5 | |
| Majority | 2,047 | 31.6 | +8.2 | ||
| Turnout | 6,472 | 41.0 | -7.9 | ||
| Conservative hold | Swing | -0.5 | |||
| Party | Candidate | Votes | % | ± | |
|---|---|---|---|---|---|
| Labour | Clive Betts | 3,475 | 82.7 | +7.9 | |
| Conservative | Andrew Cook | 367 | 8.7 | +8.7 | |
| Social and Liberal Democrats | John Wilcock | 235 | 5.6 | -19.6 | |
| Social Democratic | Glyn Evans | 125 | 3.0 | +3.0 | |
| Majority | 3,108 | 74.0 | +24.4 | ||
| Turnout | 4,202 | 30.5 | -5.2 | ||
| Labour hold | Swing | -0.4 | |||
| Party | Candidate | Votes | % | ± | |
|---|---|---|---|---|---|
| Conservative | Peter Jackson | 3,223 | 50.8 | +1.3 | |
| Labour | John Webster | 1,625 | 25.6 | +6.2 | |
| Social and Liberal Democrats | John Knight | 1,242 | 19.6 | -11.4 | |
| Social Democratic | Matthew Smith | 256 | 4.0 | +4.0 | |
| Majority | 1,598 | 25.2 | +6.7 | ||
| Turnout | 6,346 | 43.7 | -1.1 | ||
| Conservative hold | Swing | -2.4 | |||
| Party | Candidate | Votes | % | ± | |
|---|---|---|---|---|---|
| Labour | Harold Lambert | 3,588 | 63.7 | +12.1 | |
| Social and Liberal Democrats | Alice Smith | 1,317 | 23.4 | -15.4 | |
| Conservative | Shirley Clayton | 602 | 10.7 | +1.5 | |
| Green | Roger Dunn | 126 | 2.2 | +1.9 | |
| Majority | 2,271 | 40.3 | +27.5 | ||
| Turnout | 5,633 | 37.8 | -6.4 | ||
| Labour hold | Swing | +13.7 | |||
| Party | Candidate | Votes | % | ± | |
|---|---|---|---|---|---|
| Labour | Edward Lamb | 3,255 | 68.6 | +10.7 | |
| Conservative | Elizabeth Bradbury | 935 | 19.7 | -1.3 | |
| Social and Liberal Democrats | Valerie King | 381 | 8.0 | -13.0 | |
| Social Democratic | John Hetherington | 170 | 3.6 | +3.6 | |
| Majority | 2,320 | 48.9 | +12.0 | ||
| Turnout | 4,741 | 31.4 | -7.4 | ||
| Labour hold | Swing | +6.0 | |||
| Party | Candidate | Votes | % | ± | |
|---|---|---|---|---|---|
| Labour | Peter Duff | 3,107 | 50.4 | +3.6 | |
| Social and Liberal Democrats | David Swarbrick | 1,813 | 29.4 | -3.9 | |
| Conservative | Michael Warner | 1,098 | 17.8 | -2.0 | |
| Green | Jacqueline O'Neill | 147 | 2.4 | +2.4 | |
| Majority | 1,294 | 21.0 | +7.5 | ||
| Turnout | 6,165 | 40.1 | -6.8 | ||
| Labour hold | Swing | +3.7 | |||
| Party | Candidate | Votes | % | ± | |
|---|---|---|---|---|---|
| Labour | Philip Moscrop | 3,181 | 67.7 | +8.7 | |
| Conservative | Elizabeth Bradbury | 1,067 | 22.7 | +1.6 | |
| Social and Liberal Democrats | Douglas Oldfield | 293 | 6.2 | -13.6 | |
| Social Democratic | David Dean | 153 | 3.2 | +3.2 | |
| Majority | 2,114 | 45.0 | +7.1 | ||
| Turnout | 4,694 | 29.8 | -7.7 | ||
| Labour hold | Swing | +3.5 | |||
| Party | Candidate | Votes | % | ± | |
|---|---|---|---|---|---|
| Labour | Bill Jordan | 2,715 | 86.1 | +6.9 | |
| Conservative | Paul Anderton | 293 | 9.3 | +0.2 | |
| Social and Liberal Democrats | Leonard Middleton | 146 | 4.6 | -7.0 | |
| Majority | 2,422 | 76.8 | +9.2 | ||
| Turnout | 3,154 | 30.0 | |||
| Labour hold | Swing | +3.3 | |||
| Party | Candidate | Votes | % | ± | |
|---|---|---|---|---|---|
| Labour | Dorothy Walton | 4,328 | 67.7 | +8.4 | |
| Conservative | Caroline Gracey | 1,420 | 22.2 | +0.7 | |
| Social and Liberal Democrats | Kevin Smith | 402 | 6.3 | -12.9 | |
| Social Democratic | Roger Davison | 239 | 3.7 | +3.7 | |
| Majority | 2,908 | 45.5 | +7.7 | ||
| Turnout | 6,389 | 29.0 | -6.6 | ||
| Labour hold | Swing | +3.8 | |||
| Party | Candidate | Votes | % | ± | |
|---|---|---|---|---|---|
| Labour | Jan Flore | 2,772 | 48.9 | +10.4 | |
| Conservative | Henry Cornford | 1,816 | 32.1 | +3.4 | |
| Social and Liberal Democrats | George Manley | 858 | 15.1 | -14.3 | |
| Social Democratic | Stephen Ruttle | 216 | 3.8 | +3.8 | |
| Majority | 956 | 16.8 | +7.7 | ||
| Turnout | 5,662 | 40.3 | -6.0 | ||
| Labour hold | Swing | +3.5 | |||
| Party | Candidate | Votes | % | ± | |
|---|---|---|---|---|---|
| Labour | Roger Barton | 3,439 | 82.1 | +9.5 | |
| Conservative | Roger Barnsley | 404 | 9.6 | +9.6 | |
| Social and Liberal Democrats | George Clayton | 344 | 8.2 | -19.2 | |
| Majority | 3,035 | 72.5 | +27.3 | ||
| Turnout | 4,187 | 32.5 | -2.8 | ||
| Labour hold | Swing | -0.0 | |||
| Party | Candidate | Votes | % | ± | |
|---|---|---|---|---|---|
| Labour | Jennifer Harvey | 2,883 | 75.8 | +6.5 | |
| Conservative | David Knight | 519 | 13.6 | -1.2 | |
| Social and Liberal Democrats | David Cloke | 293 | 7.7 | -8.1 | |
| Social Democratic | Rachel Ritchie | 106 | 2.8 | +2.8 | |
| Majority | 2,364 | 62.2 | +8.7 | ||
| Turnout | 3,801 | 28.7 | -9.6 | ||
| Labour hold | Swing | +3.8 | |||
| Party | Candidate | Votes | % | ± | |
|---|---|---|---|---|---|
| Labour | John Butler | 3,468 | 67.4 | +8.0 | |
| Conservative | Russell Crane | 1,221 | 23.7 | +1.2 | |
| Social and Liberal Democrats | Ian Auckland | 454 | 8.8 | -9.3 | |
| Majority | 2,247 | 43.7 | +6.8 | ||
| Turnout | 5,143 | 38.4 | -6.5 | ||
| Labour hold | Swing | +3.4 | |||
| Party | Candidate | Votes | % | ± | |
|---|---|---|---|---|---|
| Labour | George Burrows | 3,165 | 85.0 | +16.4 | |
| Social and Liberal Democrats | Francis Pierce | 459 | 12.3 | -6.3 | |
| Conservative | Malcolm Smith | 100 | 2.7 | -10.0 | |
| Majority | 2,706 | 72.7 | +22.7 | ||
| Turnout | 3,724 | 29.1 | -7.1 | ||
| Labour hold | Swing | +11.3 | |||
| Party | Candidate | Votes | % | ± | |
|---|---|---|---|---|---|
| Labour | Alice Sargent | 3,172 | 85.4 | +6.9 | |
| Conservative | Mary Hyatt | 309 | 8.3 | -2.0 | |
| Social and Liberal Democrats | John Mayes | 233 | 6.3 | -4.9 | |
| Majority | 2,863 | 77.1 | +9.8 | ||
| Turnout | 3.714 | 26.2 | -5.0 | ||
| Labour hold | Swing | +4.4 | |||
| Party | Candidate | Votes | % | ± | |
|---|---|---|---|---|---|
| Labour | Mike Pye | 2,619 | 72.7 | +9.4 | |
| Conservative | Jane Godber | 525 | 14.6 | -4.2 | |
| Social and Liberal Democrats | Kathleen Brown | 279 | 7.7 | -8.0 | |
| Social Democratic | Patricia Major | 93 | 2.6 | +2.6 | |
| Communist | Walter Hartley | 85 | 2.3 | +0.1 | |
| Majority | 2,094 | 58.1 | +13.6 | ||
| Turnout | 3,601 | 28.2 | -5.7 | ||
| Labour hold | Swing | +6.8 | |||
| Party | Candidate | Votes | % | ± | |
|---|---|---|---|---|---|
| Social and Liberal Democrats | Alan Memmott | 2,796 | 39.6 | -9.1 | |
| Labour | Roy Darke | 2,708 | 38.3 | +7.3 | |
| Conservative | Lynn Wilson | 1,556 | 22.0 | +1.8 | |
| Majority | 88 | 1.3 | -16.4 | ||
| Turnout | 7,060 | 38.1 | -8.8 | ||
| Social and Liberal Democrats hold | Swing | -8.2 | |||
| Party | Candidate | Votes | % | ± | |
|---|---|---|---|---|---|
| Labour | Jimmy Boyce | 3,609 | 88.9 | +7.6 | |
| Conservative | Robert Usher | 242 | 5.9 | +5.9 | |
| Social and Liberal Democrats | Raymond Mellor | 209 | 5.1 | -13.6 | |
| Majority | 3,367 | 83.0 | +20.4 | ||
| Turnout | 4,060 | 32.3 | -3.6 | ||
| Labour hold | Swing | +0.8 | |||
| Party | Candidate | Votes | % | ± | |
|---|---|---|---|---|---|
| Social and Liberal Democrats | June Hibberd-Cooke | 1,636 | 43.7 | -9.3 | |
| Labour | Alf Meade | 1,630 | 43.5 | +7.6 | |
| Conservative | Stephen Gladman | 399 | 10.6 | -0.4 | |
| Social Democratic | George Wilson | 81 | 2.1 | +2.1 | |
| Majority | 6 | 0.2 | -16.9 | ||
| Turnout | 3,746 | 35.7 | -10.6 | ||
| Social and Liberal Democrats hold | Swing | -8.4 | |||
| Party | Candidate | Votes | % | ± | |
|---|---|---|---|---|---|
| Labour | Jean Cromar | 3,997 | 74.5 | +18.8 | |
| Conservative | Patricia Barnsley | 719 | 13.4 | +3.2 | |
| Social and Liberal Democrats | Penelope Smith | 399 | 7.4 | -26.6 | |
| Social Democratic | Margaret Ritchie | 249 | 4.6 | +4.6 | |
| Majority | 3,278 | 61.1 | +39.4 | ||
| Turnout | 5,364 | 37.1 | -6.6 | ||
| Labour hold | Swing | +7.8 | |||
References
| Metropolitan boroughs |
|
|---|---|
| District councils (England) |
|
| District councils (Scotland) |
|
| Barnsley Metropolitan Borough Council | |
|---|---|
| Doncaster Metropolitan Borough Council | |
| Rotherham Metropolitan Borough Council | |
| Sheffield City Council |
|
| South Yorkshire County Council |
|
| West Riding County Council | |
| |
This article is issued from Wikipedia - version of the 11/29/2016. The text is available under the Creative Commons Attribution/Share Alike but additional terms may apply for the media files.