Great Recession
| Great Recession |
|---|
The Great Recession was a period of general economic decline observed in world markets during the late 2000s and early 2010s. The scale and timing of the recession varied from country to country.[1][2] In terms of overall impact, the International Monetary Fund concluded that it was the worst global recession since World War II.[3][4] According to the US National Bureau of Economic Research (the official arbiter of US recessions) the recession, as experienced in that country, began in December 2007 and ended in June 2009, thus extending over 19 months.[5] The Great Recession was related to the financial crisis of 2007–08 and U.S. subprime mortgage crisis of 2007–09. The Great Recession has resulted in the scarcity of valuable assets in the market economy and the collapse of the financial sector in the world economy.[6][7]
Terminology
Two senses of the word "recession" exist: a less precise sense, referring broadly to "a period of reduced economic activity";[8] and the academic sense used most often in economics, which is defined operationally, referring specifically to the contraction phase of a business cycle, with two or more consecutive quarters of GDP contraction. Under the academic definition, the recession ended in the United States in June or July 2009.[9][10] In the broader, lay sense of the word however, many people use the term to refer to ongoing hardship (in the same way that the term "Great Depression" is also popularly used).[11][12][13][14][15][16]
Overview
The Great Recession met the IMF criteria for being a global recession, requiring a decline in annual real world GDP per‑capita (Purchasing Power weighted), only in the single calendar year 2009.[3][4] Despite the fact that quarterly data is being utilized as recession definition criteria by all G20 members, representing 85% of the world GDP,[17] the International Monetary Fund (IMF) has decided—in the absence of a complete data set—not to declare/measure global recessions according to quarterly GDP data. The seasonally adjusted PPP‑weighted real GDP for the G20‑zone, however, is a good indicator for the world GDP, and it was measured to have suffered a direct quarter on quarter decline during the three quarters from Q3‑2008 until Q1‑2009, which more accurately mark when the recession took place at the global level.[18]
According to the U.S. National Bureau of Economic Research (the official arbiter of U.S. recessions) the recession began in December 2007 and ended in June 2009, and thus extended over 18 months.[5][19]
The years leading up to the crisis were characterized by an exorbitant rise in asset prices and associated boom in economic demand.[20] Further, the U.S. shadow banking system (i.e., non-depository financial institutions such as investment banks) had grown to rival the depository system yet was not subject to the same regulatory oversight, making it vulnerable to a bank run.[21]
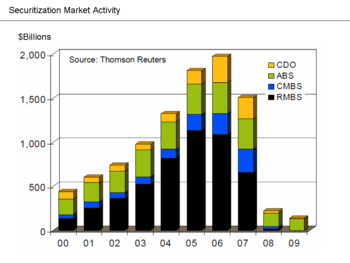
US mortgage-backed securities, which had risks that were hard to assess, were marketed around the world, as they offered higher yields than U.S. government bonds. Many of these securities were backed by subprime mortgages, which collapsed in value when the U.S. housing bubble burst during 2006 and homeowners began to default on their mortgage payments in large numbers starting in 2007.[22]
The emergence of sub-prime loan losses in 2007 began the crisis and exposed other risky loans and over-inflated asset prices. With loan losses mounting and the fall of Lehman Brothers on 15 September 2008, a major panic broke out on the inter-bank loan market. There was the equivalent of a bank run on the shadow banking system, resulting in many large and well established investment and commercial banks in the United States and Europe suffering huge losses and even facing bankruptcy, resulting in massive public financial assistance (government bailouts).[23]
The global recession that followed resulted in a sharp drop in international trade, rising unemployment and slumping commodity prices.[24] Several economists predicted that recovery might not appear until 2011 and that the recession would be the worst since the Great Depression of the 1930s.[25][26] Economist Paul Krugman once commented on this as seemingly the beginning of "a second Great Depression."[27]
Governments and central banks responded with fiscal and monetary policies to stimulate national economies and reduce financial system risks. The recession has renewed interest in Keynesian economic ideas on how to combat recessionary conditions. Economists advise that the stimulus should be withdrawn as soon as the economies recover enough to "chart a path to sustainable growth".[28][29][30]
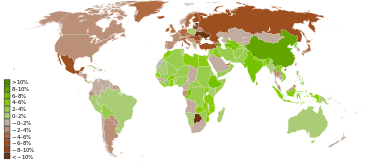
The distribution of household incomes in the United States has become more unequal during the post-2008 economic recovery, a first for the US but in line with the trend over the last ten economic recoveries since 1949.[31][32] Income inequality in the United States has grown from 2005 to 2012 in more than 2 out of 3 metropolitan areas.[33] Median household wealth fell 35% in the US, from $106,591 to $68,839 between 2005 and 2011.[34]
Causes

1. Central banks' gold reserves: $0.845 trillion.
2. M0 (paper money): $3.9 trillion.
3. Traditional (fractional reserve) banking assets: $39 trillion.
4. Shadow banking assets: $62 trillion.
5. Other assets: $290 trillion.
6. Bail-out money (early 2009): $1.9 trillion.
Panel reports
The majority report of the U.S. Financial Crisis Inquiry Commission, composed of six Democratic and four Republican appointees, reported its findings in January 2011. It concluded that "the crisis was avoidable and was caused by: Widespread failures in financial regulation, including the Federal Reserve’s failure to stem the tide of toxic mortgages; Dramatic breakdowns in corporate governance including too many financial firms acting recklessly and taking on too much risk; An explosive mix of excessive borrowing and risk by households and Wall Street that put the financial system on a collision course with crisis; Key policy makers ill prepared for the crisis, lacking a full understanding of the financial system they oversaw; and systemic breaches in accountability and ethics at all levels."[36]
There were two Republican dissenting FCIC reports. One of them, signed by three Republican appointees, concluded that there were multiple causes. In his separate dissent to the majority and minority opinions of the FCIC, Commissioner Peter J. Wallison of the American Enterprise Institute (AEI) primarily blamed U.S. housing policy, including the actions of Fannie & Freddie, for the crisis. He wrote: "When the bubble began to deflate in mid-2007, the low quality and high risk loans engendered by government policies failed in unprecedented numbers.[37]
In its "Declaration of the Summit on Financial Markets and the World Economy," dated 15 November 2008, leaders of the Group of 20 cited the following causes:
During a period of strong global growth, growing capital flows, and prolonged stability earlier this decade, market participants sought higher yields without an adequate appreciation of the risks and failed to exercise proper due diligence. At the same time, weak underwriting standards, unsound risk management practices, increasingly complex and opaque financial products, and consequent excessive leverage combined to create vulnerabilities in the system. Policy-makers, regulators and supervisors, in some advanced countries, did not adequately appreciate and address the risks building up in financial markets, keep pace with financial innovation, or take into account the systemic ramifications of domestic regulatory actions.[38]
Narratives
There are several "narratives" attempting to place the causes of the recession into context, with overlapping elements. Four such narratives include:
- There was the equivalent of a bank run on the shadow banking system, which includes investment banks and other non-depository financial entities. This system had grown to rival the depository system in scale yet was not subject to the same regulatory safeguards. Its failure disrupted the flow of credit to consumers and corporations.[23][39]
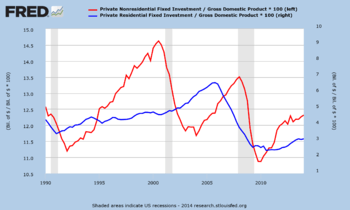
- The U.S. economy was being driven by a housing bubble. When it burst, private residential investment (i.e., housing construction) fell by nearly 4% GDP and consumption enabled by bubble-generated housing wealth also slowed. This created a gap in annual demand (GDP) of nearly $1 trillion. The U.S. government was unwilling to make up for this private sector shortfall.[40][41]
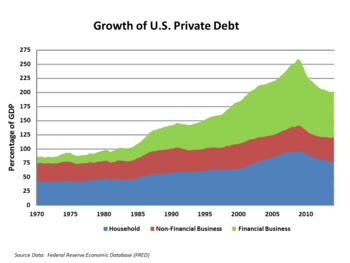
- Record levels of household debt accumulated in the decades preceding the crisis resulted in a balance sheet recession (similar to debt deflation) once housing prices began falling in 2006. Consumers began paying off debt, which reduces their consumption, slowing down the economy for an extended period while debt levels are reduced.[23][42]
- U.S. government policies encouraged home ownership even for those who could not afford it, contributing to lax lending standards, unsustainable housing price increases, and indebtedness.[43]
Underlying narratives #1-3 is a hypothesis that growing income inequality and wage stagnation encouraged families to increase their household debt to maintain their desired living standard, fueling the bubble. Further, this greater share of income flowing to the top increased the political power of business interests, who used that power to deregulate or limit regulation of the shadow banking system.[44][45][46]
Trade imbalances and debt bubbles
The Economist wrote in July 2012 that the inflow of investment dollars required to fund the U.S. trade deficit was a major cause of the housing bubble and financial crisis: "The trade deficit, less than 1% of GDP in the early 1990s, hit 6% in 2006. That deficit was financed by inflows of foreign savings, in particular from East Asia and the Middle East. Much of that money went into dodgy mortgages to buy overvalued houses, and the financial crisis was the result."[47]
In May 2008, NPR explained in their Peabody Award winning program "The Giant Pool of Money" that a vast inflow of savings from developing nations flowed into the mortgage market, driving the U.S. housing bubble. This pool of fixed income savings increased from around $35 trillion in 2000 to about $70 trillion by 2008. NPR explained this money came from various sources, "[b]ut the main headline is that all sorts of poor countries became kind of rich, making things like TVs and selling us oil. China, India, Abu Dhabi, Saudi Arabia made a lot of money and banked it."[48]
Describing the crisis in Europe, Paul Krugman wrote in February 2012 that: "What we’re basically looking at, then, is a balance of payments problem, in which capital flooded south after the creation of the euro, leading to overvaluation in southern Europe."[49]
Monetary policy
Another narrative about the origin has been focused on the respective parts played by the public monetary policy (in the US notably) and by the practices of private financial institutions. In the U.S., mortgage funding was unusually decentralised, opaque, and competitive, and it is believed that competition between lenders for revenue and market share contributed to declining underwriting standards and risky lending.[50]
While Alan Greenspan's role as Chairman of the Federal Reserve has been widely discussed (the main point of controversy remains the lowering of the Federal funds rate to 1% for more than a year, which, according to Austrian theorists, injected huge amounts of "easy" credit-based money into the financial system and created an unsustainable economic boom),[51] there is also the argument that Greenspan's actions in the years 2002–2004 were actually motivated by the need to take the U.S. economy out of the early 2000s recession caused by the bursting of the dot-com bubble—although by doing so he did not help avert the crisis, but only postpone it.[52][53]
High private debt levels
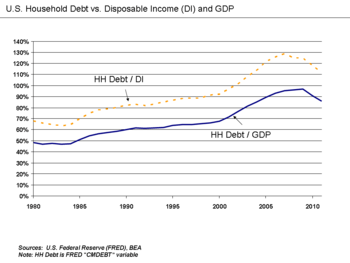
Another narrative focuses on high levels of private debt in the US economy. USA household debt as a percentage of annual disposable personal income was 127% at the end of 2007, versus 77% in 1990.[54][55] Faced with increasing mortgage payments as their adjustable rate mortgage payments increased, households began to default in record numbers, rendering mortgage-backed securities worthless. High private debt levels also impact growth by making recessions deeper and the following recovery weaker.[56][57] Robert Reich claims the amount of debt in the US economy can be traced to economic inequality, assuming that middle-class wages remained stagnant while wealth concentrated at the top, and households "pull equity from their homes and overload on debt to maintain living standards."[58]
The IMF reported in April 2012: "Household debt soared in the years leading up to the downturn. In advanced economies, during the five years preceding 2007, the ratio of household debt to income rose by an average of 39 percentage points, to 138 percent. In Denmark, Iceland, Ireland, the Netherlands, and Norway, debt peaked at more than 200 percent of household income. A surge in household debt to historic highs also occurred in emerging economies such as Estonia, Hungary, Latvia, and Lithuania. The concurrent boom in both house prices and the stock market meant that household debt relative to assets held broadly stable, which masked households’ growing exposure to a sharp fall in asset prices. When house prices declined, ushering in the global financial crisis, many households saw their wealth shrink relative to their debt, and, with less income and more unemployment, found it harder to meet mortgage payments. By the end of 2011, real house prices had fallen from their peak by about 41% in Ireland, 29% in Iceland, 23% in Spain and the United States, and 21% in Denmark. Household defaults, underwater mortgages (where the loan balance exceeds the house value), foreclosures, and fire sales are now endemic to a number of economies. Household deleveraging by paying off debts or defaulting on them has begun in some countries. It has been most pronounced in the United States, where about two-thirds of the debt reduction reflects defaults."[59][60]
Pre-recession economic imbalances
The onset of the economic crisis took most people by surprise. A 2009 paper identifies twelve economists and commentators who, between 2000 and 2006, predicted a recession based on the collapse of the then-booming housing market in the United States:[61] Dean Baker, Wynne Godley, Fred Harrison, Michael Hudson, Eric Janszen, Steve Keen, Jakob Brøchner Madsen, Jens Kjaer Sørensen, Kurt Richebächer, Nouriel Roubini, Peter Schiff, and Robert Shiller.[61]
Housing bubbles

By 2007, real estate bubbles were still under way in many parts of the world,[62] especially in the United States,[50] France, United Kingdom, Spain, The Netherlands, Australia, United Arab Emirates, New Zealand, Ireland, Poland,[63] South Africa, Israel, Greece, Bulgaria, Croatia,[64] Norway, Singapore, South Korea, Sweden, Finland, Argentina,[65] Baltic states, India, Romania, Ukraine, and China.[66] U.S. Federal Reserve Chairman Alan Greenspan said in mid-2005 that "at a minimum, there's a little 'froth' [in the U.S. housing market]...it's hard not to see that there are a lot of local bubbles".[67]
The Economist newspaper, writing at the same time, went further, saying "the worldwide rise in house prices is the biggest bubble in history".[68] Real estate bubbles are (by definition of the word "bubble") followed by a price decrease (also known as a housing price crash) that can result in many owners holding negative equity (a mortgage debt higher than the current value of the property).
Increases in uncertainty
Increases in uncertainty can depress investment, or consumption. The 2007–14 recession represents the most striking episode of heightened uncertainty since 1960.[69][70]
Ineffective or inappropriate regulation
Regulations encouraging lax lending standards
Several analysts, such as Peter Wallison and Edward Pinto of the American Enterprise Institute, have asserted that private lenders were encouraged to relax lending standards by government affordable housing policies.[71][72] They cite The Housing and Community Development Act of 1992, which initially required that 30 percent or more of Fannie’s and Freddie’s loan purchases be related to affordable housing. The legislation gave HUD the power to set future requirements, and eventually (under the Bush Administration) a 56 percent minimum was established.[73] To fulfil the requirements, Fannie Mae and Freddie Mac established programs to purchase $5 trillion in affordable housing loans,[74] and encouraged lenders to relax underwriting standards to produce those loans.[73]
These critics also cite, as inappropriate regulation, “The National Homeownership Strategy: Partners in the American Dream (“Strategy”), which was compiled in 1995 by Henry Cisneros, President Clinton’s HUD Secretary. In 2001, the independent research company, Graham Fisher & Company, stated: “While the underlying initiatives of the [Strategy] were broad in content, the main theme ... was the relaxation of credit standards.”[75]
The Community Reinvestment Act (CRA) is also identified as one of the causes of the recession, by some critics. They contend that lenders relaxed lending standards in an effort to meet CRA commitments, and they note that publicly announced CRA loan commitments were massive, totaling $4.5 trillion in the years between 1994 and 2007.[76]
However, the Financial Crisis Inquiry Commission (FCIC) concluded that Fannie & Freddie "were not a primary cause" of the crisis and that CRA was not a factor in the crisis.[36] Further, since housing bubbles appeared in multiple countries in Europe as well, the FCIC Republican minority dissenting report also concluded that U.S. housing policies were not a robust explanation for a wider global housing bubble.[36] The view that U.S. government housing policy was a primary cause of the crisis has been widely disputed,[77] with Paul Krugman referring to it as "imaginary history."[78]
Derivatives
Author Michael Lewis wrote that a type of derivative called a credit default swap (CDS) enabled speculators to stack bets on the same mortgage securities. This is analogous to allowing many persons to buy insurance on the same house. Speculators that bought CDS protection were betting that significant mortgage security defaults would occur, while the sellers (such as AIG) bet they would not. An unlimited amount could be wagered on the same housing-related securities, provided buyers and sellers of the CDS could be found.[79] When massive defaults occurred on underlying mortgage securities, companies like AIG that were selling CDS were unable to perform their side of the obligation and defaulted; U.S. taxpayers paid over $100 billion to global financial institutions to honor AIG obligations, generating considerable outrage.[80]
Derivatives such as CDS were unregulated or barely regulated. Several sources have noted the failure of the US government to supervise or even require transparency of the financial instruments known as derivatives.[81][82][83] A 2008 investigative article in the Washington Post found that leading government officials at the time (Federal Reserve Board Chairman Alan Greenspan, Treasury Secretary Robert Rubin, and SEC Chairman Arthur Levitt) vehemently opposed any regulation of derivatives. In 1998 Brooksley E. Born, head of the Commodity Futures Trading Commission, put forth a policy paper asking for feedback from regulators, lobbyists, legislators on the question of whether derivatives should be reported, sold through a central facility, or whether capital requirements should be required of their buyers. Greenspan, Rubin, and Levitt pressured her to withdraw the paper and Greenspan persuaded Congress to pass a resolution preventing CFTC from regulating derivatives for another six months — when Born's term of office would expire.[82] Ultimately, it was the collapse of a specific kind of derivative, the mortgage-backed security, that triggered the economic crisis of 2008.[83]
Shadow banking system
Paul Krugman wrote in 2009 that the run on the shadow banking system was the "core of what happened" to cause the crisis. "As the shadow banking system expanded to rival or even surpass conventional banking in importance, politicians and government officials should have realised that they were re-creating the kind of financial vulnerability that made the Great Depression possible – and they should have responded by extending regulations and the financial safety net to cover these new institutions. Influential figures should have proclaimed a simple rule: anything that does what a bank does, anything that has to be rescued in crises the way banks are, should be regulated like a bank." He referred to this lack of controls as "malign neglect."[84][85]
During 2008, three of the largest U.S. investment banks either went bankrupt (Lehman Brothers) or were sold at fire sale prices to other banks (Bear Stearns and Merrill Lynch). The investment banks were not subject to the more stringent regulations applied to depository banks. These failures exacerbated the instability in the global financial system. The remaining two investment banks, Morgan Stanley and Goldman Sachs, potentially facing failure, opted to become commercial banks, thereby subjecting themselves to more stringent regulation but receiving access to credit via the Federal Reserve.[86][87] Further, American International Group (AIG) had insured mortgage-backed and other securities but was not required to maintain sufficient reserves to pay its obligations when debtors defaulted on these securities. AIG was contractually required to post additional collateral with many creditors and counter-parties, touching off controversy when over $100 billion of U.S. taxpayer money was paid out to major global financial institutions on behalf of AIG. While this money was legally owed to the banks by AIG (under agreements made via credit default swaps purchased from AIG by the institutions), a number of Congressmen and media members expressed outrage that taxpayer money was used to bail out banks.[80]
Economist Gary Gorton wrote in May 2009: "Unlike the historical banking panics of the 19th and early 20th centuries, the current banking panic is a wholesale panic, not a retail panic. In the earlier episodes, depositors ran to their banks and demanded cash in exchange for their checking accounts. Unable to meet those demands, the banking system became insolvent. The current panic involved financial firms “running” on other financial firms by not renewing sale and repurchase agreements (repo) or increasing the repo margin (“haircut”), forcing massive deleveraging, and resulting in the banking system being insolvent."[88]
The Financial Crisis Inquiry Commission reported in January 2011: "In the early part of the 20th century, we erected a series of protections – the Federal Reserve as a lender of last resort, federal deposit insurance, ample regulations – to provide a bulwark against the panics that had regularly plagued America’s banking system in the 20th century. Yet, over the past 30-plus years, we permitted the growth of a shadow banking system – opaque and laden with short term debt – that rivaled the size of the traditional banking system. Key components of the market – for example, the multitrillion-dollar repo lending market, off-balance-sheet entities, and the use of over-the-counter derivatives – were hidden from view, without the protections we had constructed to prevent financial meltdowns. We had a 21st-century financial system with 19th-century safeguards."[36]
Systemic crisis
The financial crisis and the recession have been described as a symptom of another, deeper crisis by a number of economists. For example, Ravi Batra argues that growing inequality of financial capitalism produces speculative bubbles that burst and result in depression and major political changes.[89][90] Feminist economists Ailsa McKay and Margunn Bjørnholt argue that the financial crisis and the response to it revealed a crisis of ideas in mainstream economics and within the economics profession, and call for a reshaping of both the economy, economic theory and the economics profession. They argue that such a reshaping should include new advances within feminist economics and ecological economics that take as their starting point the socially responsible, sensible and accountable subject in creating an economy and economic theories that fully acknowledge care for each other as well as the planet.[91]
Effects
Effects on the United States


In the U.S., persistent high unemployment remained as of December 2012, along with low consumer confidence, the continuing decline in home values and increase in foreclosures and personal bankruptcies, an increasing federal debt, inflation, and rising petroleum and food prices. A 2011 poll found that more than half of all Americans thought that the U.S. was still in recession or even depression, although economic data showed a historically modest recovery.[92] This could have been because both private and public levels of debt were at historic highs in the U.S. and in many other countries.[93][94][95][96]
- Real gross domestic product (GDP) began contracting in the third quarter of 2008 and did not return to growth until Q1 2010.[97] CBO estimated in February 2013 that real U.S. GDP remained only a little over 4.5 percent above its previous peak, or about $850 billion. CBO projected that GDP would not return to its potential level until 2017.[98] In 2009 the U.S GDP was at $14.4 trillion. By the final quarter of 2014, the US GDP had grown by 18.6%, equal to $17.7 trillion. Canada, the United States' largest trading partner by then, had a GDP of $1.37 trillion in 2009, but by 2014 reached $2 trillion, growing by over 31%. Both countries now have the fastest growing economies within the G8 and G20, and both countries has increased daily trade with each other from $1.5 Billion in 2011, to $4 Billion in 2014, equating to over $1.3 trillion in annual trade.
- The unemployment rate rose from 5% in 2008 pre-crisis to 10% by late 2009, then steadily declined to 7.3% by March 2013.[99] The number of unemployed rose from approximately 7 million in 2008 pre-crisis to 15 million by 2009, then declined to 12 million by early 2013.[100]
- Residential private investment (mainly housing) fell from its 2006 pre-crisis peak of $800 billion, to $400 billion by mid-2009 and has remained depressed at that level. Non-residential investment (mainly business purchases of capital equipment) peaked at $1,700 billion in 2008 pre-crisis and fell to $1,300 billion in 2010, but by early 2013 had nearly recovered to this peak.[101]
- Housing prices fell approximately 30% on average from their mid-2006 peak to mid-2009 and remained at approximately that level as of March 2013.[102]
- Stock market prices, as measured by the S&P 500 index, fell 57% from their October 2007 peak of 1,565 to a trough of 676 in March 2009. Stock prices began a steady climb thereafter and returned to record levels by April 2013.[103]
- The net worth of U.S. households and non-profit organisations fell from a peak of approximately $67 trillion in 2007 to a trough of $52 trillion in 2009, a decline of $15 trillion or 22%. It began to recover thereafter and was $66 trillion by Q3 2012.[104]
- U.S. total national debt rose from 66% GDP in 2008 pre-crisis to over 103% by the end of 2012.[105]
- For the majority, income levels have dropped substantially with the median male worker making $32,137 in 2010, and an inflation-adjusted income of $32,844 in 1968.[106] The recession of 2007–2009 is considered to be the worst economic downturn since the Great Depression.[107] and the subsequent economic recovery one of the weakest. The weak economic performance since 2000 has seen the percentage of working age adults actually employed drop from 64% to 58% (a number last seen in 1984), with most of that drop occurring since 2007.[108]
- Approximately 5.4 million people have been added to federal disability rolls as discouraged workers give up looking for work and take advantage of the federal program.[109]
- The United States has seen an increasing concentration of wealth to the detriment of the middle class and the poor with the younger generations being especially affected. The middle class dropped from 61% of the population in 1971 to 51% in 2011 as the upper class increased its take of the national income from 29% in 1970 to 46% in 2010. The share for the middle class dropped to 45%, down from 62% while total income for the poor dropped to 9% from 10%. Since the number of poor increased during this period the smaller piece of the pie (down to 9% from 10%) is spread over a greater portion of the population.[110] The portion of national wealth owned by the middle class and poor has also dropped as their portion of the national income has dropped, making it more difficult to accumulate wealth. The younger generation, which would be just starting their wealth accumulation, has been the most hard hit. Those under 35 are 68% less wealthy than they were in 1984, while those over 55 are 10% wealthier.[111] Much of this concentration has happened since the start of the Great Recession. In 2009, the wealthiest 20% of households controlled 87.2% of all wealth, up from 85.0% in 2007. The top 1% controlled 35.6% of all wealth, up from 34.6% in 2007.[112] The share of the bottom 80% fell from 15% to 12.8%, dropping 15%.
- Inflation-adjusted median household income in the United States peaked in 1999 at $53,252 (at the peak of the Internet stock bubble), dropped to $51,174 in 2004, went up to 52,823 in 2007 (at the peak of the housing bubble), and has since trended downward to $49,445 in 2010. The last time median household income was at this level was in 1996 at $49,112, indicating that the recession of the early 2000s and the 2008–2012 global recession wiped out all middle class income gains for the last 15 years.[113] This income drop has caused a dramatic rise in people living under the poverty level and has hit suburbia particularly hard. Between 2000 and 2010, the number of suburban households below the poverty line increased by 53 percent, compared to a 23 percent increase in poor households in urban areas.[114]
A 2011 poll found that more than half of all Americans think the U.S. is still in recession or even depression, despite official data that shows a historically modest recovery.[115] In 2013 the Census Bureau defined poverty rate decreased to roughly 14.5% of the population.[116] As late as 2014, and early 2015, a majority of Americans still believed that the nation remained in a recession.[117]
Effects on Europe

The crisis in Europe generally progressed from banking system crises to sovereign debt crises, as many countries elected to bailout their banking systems using taxpayer money. Greece was different in that it faced large public debts rather than problems within its banking system. Several countries received bailout packages from the "troika" (European Commission, European Central Bank, International Monetary Fund), which also implemented a series of emergency measures.
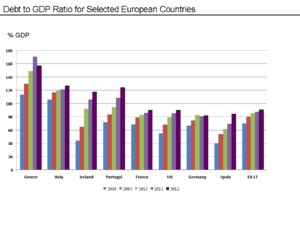
Many European countries embarked on austerity programs, reducing their budget deficits relative to GDP from 2010 to 2011. For example, according to the CIA World Factbook Greece improved its budget deficit from 10.4% GDP in 2010 to 9.6% in 2011. Iceland, Italy, Ireland, Portugal, France, and Spain also improved their budget deficits from 2010 to 2011 relative to GDP.[119][120]
However, with the exception of Germany, each of these countries had public-debt-to-GDP ratios that increased (i.e., worsened) from 2010 to 2011, as indicated in the chart at right. Greece's public-debt-to-GDP ratio increased from 143% in 2010 to 165% in 2011[119] to 185% in 2014. This indicates that despite improving budget deficits, GDP growth was not sufficient to support a decline (improvement) in the debt-to-GDP ratio for these countries during this period. Eurostat reported that the debt to GDP ratio for the 17 Euro area countries together was 70.1% in 2008, 79.9% in 2009, 85.3% in 2010, and 87.2% in 2011.[120][121]
According to the CIA World Factbook, from 2010 to 2011, the unemployment rates in Spain, Greece, Italy, Ireland, Portugal, and the UK increased. France had no significant changes, while in Germany and Iceland the unemployment rate declined.[119] Eurostat reported that Eurozone unemployment reached record levels in September 2012 at 11.6%, up from 10.3% the prior year. Unemployment varied significantly by country.[122]
Economist Martin Wolf analysed the relationship between cumulative GDP growth from 2008-2012 and total reduction in budget deficits due to austerity policies (see chart at right) in several European countries during April 2012. He concluded that: "In all, there is no evidence here that large fiscal contractions [budget deficit reductions] bring benefits to confidence and growth that offset the direct effects of the contractions. They bring exactly what one would expect: small contractions bring recessions and big contractions bring depressions." Changes in budget balances (deficits or surpluses) explained approximately 53% of the change in GDP, according to the equation derived from the IMF data used in his analysis.[118]
Economist Paul Krugman analysed the relationship between GDP and reduction in budget deficits for several European countries in April 2012 and concluded that austerity was slowing growth, similar to Martin Wolf. He also wrote: "... this also implies that 1 euro of austerity yields only about 0.4 euros of reduced deficit, even in the short run. No wonder, then, that the whole austerity enterprise is spiraling into disaster."[123]
Countries that avoided recession
Poland and Slovakia are the only two members of the European Union to have avoided a GDP recession during the years affected by the Great Recession. As of December 2009, the Polish economy had not entered recession nor even contracted, while its IMF 2010 GDP growth forecast of 1.9 percent was expected to be upgraded.[124][125][126] Analysts have identified several causes for the positive economic development in Poland: Extremely low levels of bank lending and a relatively very small mortgage market; the relatively recent dismantling of EU trade barriers and the resulting surge in demand for Polish goods since 2004; the receipt of direct EU funding since 2004; lack of over-dependence on a single export sector; a tradition of government fiscal responsibility; a relatively large internal market; the free-floating Polish zloty; low labour costs attracting continued foreign direct investment; economic difficulties at the start of the decade, which prompted austerity measures in advance of the world crisis.
While India, Uzbekistan, China, and Iran experienced slowing growth, they did not enter recessions.
South Korea narrowly avoided technical recession in the first quarter of 2009.[127] The International Energy Agency stated in mid September that South Korea could be the only large OECD country to avoid recession for the whole of 2009.[128] It was the only developed economy to expand in the first half of 2009.
Australia avoided a technical recession after experiencing only one quarter of negative growth in the fourth quarter of 2008, with GDP returning to positive in the first quarter of 2009.[129][130]
The financial crisis did not affect developing countries to a great extent. Experts see several reasons: Africa was not affected because it is not fully integrated in the world market. Latin America and Asia seemed better prepared, since they have experienced crises before. In Latin America, for example, banking laws and regulations are very stringent. Bruno Wenn of the German DEG suggests that Western countries could learn from these countries when it comes to regulations of financial markets.[131]
Timeline of effects
The table below displays all national recessions appearing in 2006-2013 (for the 71 countries with available data), according to the common recession definition, saying that a recession occurred whenever seasonally adjusted real GDP contracts quarter on quarter, through minimum two consecutive quarters. Only 11 out of the 71 listed countries with quarterly GDP data (Poland, Slovakia, Moldova, India, China, South Korea, Indonesia, Australia, Uruguay, Colombia and Bolivia) escaped a recession in this time period.
The few recessions appearing early in 2006-07 are commonly never associated to be part of the Great Recession, which is illustrated by the fact that only two countries (Iceland and Jamaica) were in recession in Q4-2007.
One year before the maximum, in Q1-2008, only six countries were in recession (Iceland, Sweden, Finland, Ireland, Portugal and New Zealand). The number of countries in recession was 25 in Q2‑2008, 39 in Q3‑2008 and 53 in Q4‑2008. At the steepest part of the Great Recession in Q1‑2009, a total of 59 out of 71 countries were simultaneously in recession. The number of countries in recession was 37 in Q2‑2009, 13 in Q3‑2009 and 11 in Q4‑2009. One year after the maximum, in Q1‑2010, only seven countries were in recession (Greece, Croatia, Romania, Iceland, Jamaica, Venezuela and Belize).
The recession data for the overall G20-zone (representing 85% of all GWP), depict that the Great Recession existed as a global recession throughout Q3‑2008 until Q1‑2009.
Subsequent follow-up recessions in 2010‑2013 were confined to Belize, El Salvador, Paraguay, Jamaica, Japan, Taiwan, New Zealand and 24 out of 50 European countries (including Greece). As of October 2014, only five out of the 71 countries with available quarterly data (Cyprus, Italy, Croatia, Belize and El Salvador), were still in ongoing recessions.[18][132] The many follow-up recessions hitting the European countries, are commonly referred to as being direct repercussions of the European sovereign‑debt crisis.
| Country[lower-alpha 1] | Recession period(s) during 2006‑2013[18][132] (measured by quarter-on-quarter changes of seasonally adjusted real GDP, as per the latest revised Q3-2013 data from 10 January 2014)[lower-alpha 2] |
|---|---|
| Albania | Q1-2007 until Q2-2007 (6 months)[133] Q3-2009 until Q4-2009 (6 months)[133] Q4-2011 until Q1-2012 (6 months)[133] |
| Argentina | Q4-2008 until Q2-2009 (9 months) |
| Australia | None |
| Austria | Q2-2008 until Q2-2009 (15 months) Q3-2011 until Q4-2011 (6 months) |
| Belgium | Q3-2008 until Q1-2009 (9 months) Q2-2012 until Q1-2013 (12 months) |
| Belize | Q1-2006 until Q2-2006 (6 months)[134] Q1-2007 until Q3-2007 (9 months)[134] Q4-2008 until Q1-2009 (6 months)[134] Q4-2009 until Q1-2010 (6 months)[134] Q1-2011 until Q2-2011 (6 months)[134] Q2-2013 until Ongoing (6 months)[134] |
| Bolivia | None[135][lower-alpha 3] Q2-2013 until Ongoing (6 months)[142][lower-alpha 4] |
| Estonia | Q3-2008 until Q3-2009 (15 months) Q1-2013 until Q2-2013 (6 months) |
| EU (28 member states) | Q2-2008 until Q2-2009 (15 months) Q4-2011 until Q2-2012 (9 months) Q4-2012 until Q1-2013 (6 months) |
| Eurozone (17 member states) | Q2-2008 until Q2-2009 (15 months) Q4-2011 until Q1-2013 (18 months) |
| Finland | Q1-2008 until Q2-2009 (18 months) Q2-2012 until Q1-2013 (12 months) |
| France | Q2-2008 until Q2-2009 (15 months) Q4-2012 until Q1-2013 (6 months) |
| G20 (43 member states, PPP-weighted GDP)[lower-alpha 5] | Q3-2008 until Q1-2009 (9 months) |
| Germany | Q2-2008 until Q1-2009 (12 months) |
| Greece | Q3-2008 until Q2-2014 (63 months) |
| Hong Kong | Q2-2008 until Q1-2009 (12 months)[144] |
| Hungary | Q1-2007 until Q2-2007 (6 months) Q2-2008 until Q3-2009 (18 months) Q2-2011 until Q3-2011 (6 months) Q1-2012 until Q4-2012 (12 months) |
| Iceland | Q4-2007 until Q2-2008 (9 months) Q4-2008 until Q1-2009 (6 months) Q3-2009 until Q2-2010 (12 months) |
| India | None |
| Indonesia | None |
| Ireland | Q2-2007 until Q3-2007 (6 months) Q1-2008 until Q4-2009 (24 months) |
| Israel | Q4-2008 until Q1-2009 (6 months) |
| Italy | Q2-2008 until Q2-2009 (15 months) Q3-2011 until Q3 2014 (27 months) |
| Jamaica | Q3-2007 until Q4-2007 (6 months)[145] Q3-2008 until Q1-2009 (9 months)[145] Q4-2009 until Q2-2010 (9 months)[145] Q4-2011 until Q1-2012 (6 months)[145] Q4-2012 until Q1-2013 (6 months)[145] |
| Japan | Q2-2008 until Q1-2009 (12 months) Q4-2010 until Q2-2011 (9 months) Q2-2012 until Q3-2012 (6 months) |
| Kazakhstan | Q3-2008 until Q1-2009 (9 months)[146][lower-alpha 6] |
- ↑ 105 out of the 206 sovereign countries in the World, did not publish any quarterly GDP data for the 2006‑2013 period. The following 21 countries were also excluded from the table, due to only publishing unadjusted quarterly real GDP figures with no seasonal adjustment: Armenia, Azerbaijan, Belarus, Brunei, Dominican Republic, Egypt, Georgia, Guatemala, Iran, Jordan, Macao, Montenegro, Morocco, Nicaragua, Nigeria, Palestine, Qatar, Rwanda, Sri Lanka, Trinidad and Tobago, Vietnam.
- 1 2 Only seasonally adjusted qoq-data can be used to accurately determine recession periods. When quarterly change is calculated by comparing quarters with the same quarter of last year, this results only in an aggregated -often delayed- indication, because of being a product of all quarterly changes taking place since the same quarter last year. Currently there is no seasonal adjusted qoq-data available for Greece and Macedonia, which is why the table display the recession intervals for these two countries only based upon the alternative indicative data format.
- ↑ Bolivia had as of January 2014 only published seasonally adjusted real GDP data until Q1-2010, with the statistics office still to publish data for 2010-13.[135]</ref>
w
lBrazil
offered higher yields than UQ4-2008 until Q1-2009 (6 months)
ol
pBulgaria
when the U.S. housing bubbleQ1-2009 until Q2-2009 (6 months)
mb
sCanada
n 2007.<ref>{{Cite news |urlQ4-2008 until Q2-2009 (9 months)
tl
=Chile
Breakdown Of The Recession IQ2-2008 until Q1-2009 (12 months)
e
rChina
[subprime lending|sub-prime None
]
sColombia
egan the crisis and exposed None[136][137]
|
bCosta Rica
s.com |date = 2014-07-10 |acQ2-2008 until Q1-2009 (12 months)[138]
wo
dCroatia
t since the [[Great DepressiQ3-2008 until Q2-2010 (24 months)
Q3-2011 until Q4-2012 (18 months)
Q2-2013 until Ongoing (6 months) 2 Cyprus <ref>{{Cite news |url = httpQ1-2009 until Q4-2009 (12 months)
Q3-2011 until Q4-2014 (42 months) as =Czech Republic ia |date = 2009-01-26 |publiQ4-2008 until Q2-2009 (9 months)
Q4-2011 until Q1-2013 (18 months) eg nDenmark cond Great Depression."<ref>Q3-2008 until Q2-2009 (12 months)
Q3-2011 until Q4-2011 (6 months)
Q4-2012 until Q1-2013 (6 months) }< rEcuador ents and central banks respoQ4-2006 until Q1-2007 (6 months)[139]
Q1-2009 until Q3-2009 (9 months)[140][141] b cEl Salvador during the post-2008 [[econQ3-2008 until Q2-2009 (12 months)[142][lower-alpha 4] - 1 2 According to the methodology note for the quarterly GDP of El Salvador, this data series include seasonally adjustments.<ref name='Methodology note for the quarterly GDP of El Salvador'>"Boletín Económico: Metodología Producto Interno Bruto Trimestral, Base 1990" (PDF) (in Spanish). Banco Central de Reserva de El Salvador. 27 October 2006.
- ↑ The G20-zone represents 85% of all GWP, and comprise 19 member states (incl. UK, France, Germany and Italy) along with the EU Commission as the 20th member, who represents the remaining 24 EU member states in the forum.[143]
- ↑ Kazakhstan had as of January 2014 only published seasonally adjusted real GDP data until Q4-2009, with the statistics office still to publish data for 2010-13.[146]</ref>
U
Latvia
being driven by a housing bQ2-2008 until Q3-2009 (18 months)
ea
Lithuania
sumption enabled by bubble-gQ3-2008 until Q2-2009 (12 months)
t
iLuxembourg
government was unwilling toQ2-2008 until Q1-2009 (12 months)
.p
/Macedonia
n-wants-people-to-be-unemploQ1-2009 until Q3-2009 (9 months)[147]
Q1-2012 until Q2-2012 (6 months)[147]
(not qoq-data, but quarters compared with same quarter of last year)[lower-alpha 2] eb ]Malaysia = University of Chicago |isbQ3-2008 until Q1-2009 (9 months)[148][149] no cMalta ad/2012-1.pdf Jon Wisman-WagQ4-2008 until Q1-2009 (6 months) tp /Mexico g/external/pubs/ft/wp/2010/wQ3-2008 until Q2-2009 (12 months) f> tMoldova i.umass.edu/fileadmin/pdf/woNone[150][lower-alpha 7] ue oVenezuela ). ===Increases in uncertaiQ1-2009 until Q1-2010 (15 months)<ref name='Venezuela s.a. real GDP 1998-2013'>"AGREGADOS_MACROECONÓMICOS: PIB Desestacionalizado. Base 1997 (Trimestral)" (XLS) (in Spanish). 9 December 2013. - ↑ Moldova had as of January 2014 only published seasonally adjusted real GDP data until Q4-2010, with the statistics office still to publish data for 2011-13.[150]</ref>
he
iNetherlands
as the result."<ref>{{cite nQ2-2008 until Q2-2009 (15 months)
Q2-2011 until Q1-2012 (12 months)
Q3-2012 until Q2-2013 (12 months) 8, PNew Zealand heir [[Peabody Award]] winniQ1-2008 until Q2-2009 (18 months)
Q3-2010 until Q4-2010 (6 months) .S hNorway le. This pool of fixed incomQ1-2009 until Q2-2009 (6 months)
Q2-2010 until Q3-2010 (6 months)
Q1-2011 until Q2-2011 (6 months) tr sOECD (34 member states, PPP-weighted GDP) money and banked it."<ref>{Q2-2008 until Q1-2009 (12 months) tl Paraguay erican Life-The Giant Pool oQ3-2008 until Q1-2009 (9 months)[151]
Q2-2011 until Q3-2011 (6 months)[151] K gPeru .nytimes.com |date = 2012-02Q4-2008 until Q2-2009 (9 months)[152] th [Philippines ate]] to 1% for more than a Q4-2008 until Q1-2009 (6 months)[153][154] t= rPoland =Stefan|date=2004-11-08|publNone =M ePortugal ccessdate=2009-01-04}}</ref>Q2-2007 until Q3-2007 (6 months)
Q1-2008 until Q1-2009 (15 months)
Q4-2010 until Q1-2013 (30 months) us Romania ls of private debt in the USQ4-2008 until Q2-2009 (9 months)
Q4-2009 until Q1-2010 (6 months)
Q4-2011 until Q1-2012 (6 months) tt /Russia ist.com/world/unitedstates/dQ3-2008 until Q2-2009 (12 months) at =Serbia |accessdate = 2009-02-27 }}Q2-2008 until Q2-2009 (15 months)[155]
Q2-2011 until Q1-2012 (12 months)[155]
Q3-2012 until Q4-2012 (6 months)[155] re -Singapore now-manageable/ |title = ChaQ2-2008 until Q1-2009 (12 months)[156][157][158][159][160] th rSlovakia t 41% in Ireland, 29% in IceNone 2 Slovenia the United States, and 21% iQ3-2008 until Q2-2009 (12 months)
Q3-2011 until Q4-2013 (24 months)[161][162] de South Africa s defaults."<ref name="imf.oQ4-2008 until Q2-2009 (9 months) po South Korea 3 – April 2012|date=|format=None cc sSpain 08-17}}</ref><ref>{{cite webQ2-2008 until Q4-2009 (21 months)
Q2-2011 until Q2-2013 (27 months) y- bSweden eraging: The global credit bQ1-2008 until Q1-2009 (15 months) 13 3Switzerland = 2013-08-17 }}</ref> ===PrQ4-2008 until Q2-2009 (9 months) ur rTaiwan paper identifies twelve ecoQ2-2008 until Q1-2009 (12 months)[163]
Q3-2011 until Q4-2011 (6 months)[163] ]] Thailand rensen, [[Kurt Richebächer]]Q4-2008 until Q1-2009 (6 months)[164] ub iTurkey errigenous: Recession beginsQ2-2008 until Q1-2009 (12 months) ss oUkraine ed recessions in 40 countrieQ2-2008 until Q1-2009 (12 months)[165]
Q3-2012 until Q4-2012 (6 months)[165][166][167] ot oUnited Kingdom ef>{{Cite news |url = http:/Q2-2008 until Q2-2009 (15 months)[168] rl wUnited States prices is the biggest bubbleQ3-2008 until Q2-2009 (12 months) ry dUruguay tle = The global housing booNone<ref name='Uruguay s.a. real GDP 2005-2013'>"Informe Trimestral de Cuentas Nacionales: Julio – Setiembre 2013" (PDF) (in Spanish). Banco Central del Uruguay. 13 December 2013.
Country specific details about recession timelines
Iceland fell into an economic depression in 2008 following the collapse of its banking system (see 2008–2011 Icelandic financial crisis). By mid-2012 Iceland is regarded as one of Europe's recovery success stories largely as a result of a currency devaluation that has effectively reduced wages by 50%--making exports more competitive.[169]
The following countries had a recession already starting in the first quarter of 2008: Latvia,[170] Ireland,[171] New Zealand,[172] and Sweden.[18]
The following countries/territories had a recession starting in the second quarter of 2008: Japan,[173] Hong Kong,[174] Singapore,[175] Italy,[176] Turkey,[18] Germany,[177] United Kingdom,[18] the Eurozone,[178] the European Union,[18] and OECD.[18]
The following countries/territories had a recession starting in the third quarter of 2008: United States,[18] Spain,[179] and Taiwan.[180]
The following countries/territories had a recession starting in the fourth quarter of 2008: Switzerland.[181]
South Korea "miraculously" avoided recession with GDP returning positive at a 0.1% expansion in the first quarter of 2009.[182]
Of the seven largest economies in the world by GDP, only China avoided a recession in 2008. In the year to the third quarter of 2008 China grew by 9%. Until recently Chinese officials considered 8% GDP growth to be required simply to create enough jobs for rural people moving to urban centres.[183] This figure may more accurately be considered to be 5–7% now that the main growth in working population is receding.
Ukraine went into technical depression in January 2009 with a nominal annualised GDP growth of −20%, when comparing on a monthly basis with the GDP level in January 2008.[184] Overall the Ukrainian real GDP fell 14.8% when comparing the entire part of 2009 with 2008.[185] When measured quarter-on-quarter by changes of seasonally adjusted real GDP, Ukraine was more precisely in recession/depression throughout the four quarters from Q2-2008 until Q1-2009 (with respective qoq-changes of: -0.1%, -0.5%, -9.3%, -10.3%), and the two quarters from Q3-2012 until Q4-2012 (with respective qoq-changes of: -1.5% and -0.8%).[186]
Japan was in recovery in the middle of the decade 2000s but slipped back into recession and deflation in 2008.[187] The recession in Japan intensified in the fourth quarter of 2008 with a nominal annualized GDP growth of −12.7% (being equal to the seasonally adjusted real GDP having a quarter-on-quarter change of -3.2%),[188] and deepened further in the first quarter of 2009 with a nominal annualised GDP growth of −15.2% (being equal to the seasonally adjusted real GDP having a quarter-on-quarter change of -4.0%).[189]
Political instability related to the economic crisis
On February 26, 2009, an Economic Intelligence Briefing was added to the daily intelligence briefings prepared for the President of the United States. This addition reflects the assessment of U.S. intelligence agencies that the global financial crisis presents a serious threat to international stability.[190]
Business Week stated in March 2009 that global political instability is rising fast because of the global financial crisis and is creating new challenges that need managing.[191] The Associated Press reported in March 2009 that: United States "Director of National Intelligence Dennis Blair has said the economic weakness could lead to political instability in many developing nations."[192] Even some developed countries are seeing political instability.[193] NPR reports that David Gordon, a former intelligence officer who now leads research at the Eurasia Group, said: "Many, if not most, of the big countries out there have room to accommodate economic downturns without having large-scale political instability if we're in a recession of normal length. If you're in a much longer-run downturn, then all bets are off."[194]
Political scientists have argued that the economic stasis triggered social churning that got expressed through protests on a variety of issues across the developing world. In Brazil, disaffected youth rallied against a minor bus-fare hike;[195] in Turkey, they agitated against the conversion of a park to a mall[196] and in Israel, they protested against high rents in Tel Aviv. In all these cases, the ostensible immediate cause of the protest was amplified by the underlying social suffering induced by the great recession.
In January 2009, the government leaders of Iceland were forced to call elections two years early after the people of Iceland staged mass protests and clashed with the police because of the government's handling of the economy.[193] Hundreds of thousands protested in France against President Sarkozy's economic policies.[197] Prompted by the financial crisis in Latvia, the opposition and trade unions there organised a rally against the cabinet of premier Ivars Godmanis. The rally gathered some 10–20 thousand people. In the evening the rally turned into a Riot. The crowd moved to the building of the parliament and attempted to force their way into it, but were repelled by the state's police. In late February many Greeks took part in a massive general strike because of the economic situation and they shut down schools, airports, and many other services in Greece.[198] Police and protesters clashed in Lithuania where people protesting the economic conditions were shot with rubber bullets.[199] Communists and others rallied in Moscow to protest the Russian government's economic plans.[200]
In addition to various levels of unrest in Europe, Asian countries have also seen various degrees of protest.[201] Protests have also occurred in China as demands from the west for exports have been dramatically reduced and unemployment has increased. Beyond these initial protests, the protest movement has grown and continued in 2011. In late 2011, the Occupy Wall Street protest took place in the United States, spawning several offshoots that came to be known as the Occupy movement.
In 2012 the economic difficulties in Spain increased support for secession movements. In Catalonia, support for the secession movement exceeded. On September 11, a pro-independence march drew a crowd that police estimated at 1.5 million.[202]
Policy responses
The financial phase of the crisis led to emergency interventions in many national financial systems. As the crisis developed into genuine recession in many major economies, economic stimulus meant to revive economic growth became the most common policy tool. After having implemented rescue plans for the banking system, major developed and emerging countries announced plans to relieve their economies. In particular, economic stimulus plans were announced in China, the United States, and the European Union.[203] In the final quarter of 2008, the financial crisis saw the G-20 group of major economies assume a new significance as a focus of economic and financial crisis management.
United States policy responses

The Federal Reserve, Treasury, and Securities and Exchange Commission took several steps on September 19 to intervene in the crisis. To stop the potential run on money market mutual funds, the Treasury also announced on September 19 a new $50 billion program to insure the investments, similar to the Federal Deposit Insurance Corporation (FDIC) program.[204][205] Part of the announcements included temporary exceptions to section 23A and 23B (Regulation W), allowing financial groups to more easily share funds within their group. The exceptions would expire on January 30, 2009, unless extended by the Federal Reserve Board.[206] The Securities and Exchange Commission announced termination of short-selling of 799 financial stocks, as well as action against naked short selling, as part of its reaction to the mortgage crisis.[207] In May 2013 as the stock market was hitting record highs and the housing and employment markets were improving slightly[208] the prospect of the Federal Reserve beginning to decrease its economic stimulus activities began to enter the projections of investment analysts and affected global markets.[209]
Asia-Pacific policy responses
On September 15, 2008, China cut its interest rate for the first time since 2002. Indonesia reduced its overnight repo rate, at which commercial banks can borrow overnight funds from the central bank, by two percentage points to 10.25 percent. The Reserve Bank of Australia injected nearly $1.5 billion into the banking system, nearly three times as much as the market's estimated requirement. The Reserve Bank of India added almost $1.32 billion, through a refinance operation, its biggest in at least a month.[210]
On November 9, 2008, the Chinese economic stimulus program is a RMB¥ 4 trillion ($586 billion) stimulus package announced by the central government of the People's Republic of China in its biggest move to stop the global financial crisis from hitting the world's second largest economy. A statement on the government's website said the State Council had approved a plan to invest 4 trillion yuan ($586 billion) in infrastructure and social welfare by the end of 2010. The stimulus package will be invested in key areas such as housing, rural infrastructure, transportation, health and education, environment, industry, disaster rebuilding, income-building, tax cuts, and finance.
China's export driven economy is starting to feel the impact of the economic slowdown in the United States and Europe, and the government has already cut key interest rates three times in less than two months in a bid to spur economic expansion. On November 28, 2008, the Ministry of Finance of the People's Republic of China and the State Administration of Taxation jointly announced a rise in export tax rebate rates on some labour-intensive goods. These additional tax rebates will take place on December 1, 2008.[211]
The stimulus package was welcomed by world leaders and analysts as larger than expected and a sign that by boosting its own economy, China is helping to stabilise the global economy. News of the announcement of the stimulus package sent markets up across the world. However, Marc Faber claimed that he thought China was still in recession on January 16.
In Taiwan, the central bank on September 16, 2008, said it would cut its required reserve ratios for the first time in eight years. The central bank added $3.59 billion into the foreign-currency interbank market the same day. Bank of Japan pumped $29.3 billion into the financial system on September 17, 2008, and the Reserve Bank of Australia added $3.45 billion the same day.[212]
In developing and emerging economies, responses to the global crisis mainly consisted in low-rates monetary policy (Asia and the Middle East mainly) coupled with the depreciation of the currency against the dollar. There were also stimulus plans in some Asian countries, in the Middle East and in Argentina. In Asia, plans generally amounted to 1 to 3% of GDP, with the notable exception of China, which announced a plan accounting for 16% of GDP (6% of GDP per year).
European policy responses
Until September 2008, European policy measures were limited to a small number of countries (Spain and Italy). In both countries, the measures were dedicated to households (tax rebates) reform of the taxation system to support specific sectors such as housing. The European Commission proposed a €200 billion stimulus plan to be implemented at the European level by the countries. At the beginning of 2009, the UK and Spain completed their initial plans, while Germany announced a new plan.
On September 29, 2008, the Belgian, Luxembourg and Dutch authorities partially nationalised Fortis. The German government bailed out Hypo Real Estate.
On 8 October 2008 the British Government announced a bank rescue package of around £500 billion[213] ($850 billion at the time). The plan comprises three parts. The first £200 billion would be made in regard to the banks in liquidity stack. The second part will consist of the state government increasing the capital market within the banks. Along with this, £50 billion will be made available if the banks needed it, finally the government will write away any eligible lending between the British banks with a limit to £250 billion.
In early December German Finance Minister Peer Steinbrück indicated a lack of belief in a "Great Rescue Plan" and reluctance to spend more money addressing the crisis.[214] In March 2009, The European Union Presidency confirmed that the EU was at the time strongly resisting the US pressure to increase European budget deficits.[215]
From 2010, the United Kingdom began a fiscal consolidation program to reduce debt and deficit levels while at the same time stimulating economic recovery.[216] Other European countries also began fiscal consolidation with similar aims.[217]
Global responses

Most political responses to the economic and financial crisis has been taken, as seen above, by individual nations. Some coordination took place at the European level, but the need to cooperate at the global level has led leaders to activate the G-20 major economies entity. A first summit dedicated to the crisis took place, at the Heads of state level in November 2008 (2008 G-20 Washington summit).
The G-20 countries met in a summit held on November 2008 in Washington to address the economic crisis. Apart from proposals on international financial regulation, they pledged to take measures to support their economy and to coordinate them, and refused any resort to protectionism.
Another G-20 summit was held in London on April 2009. Finance ministers and central banks leaders of the G-20 met in Horsham, England, on March to prepare the summit, and pledged to restore global growth as soon as possible. They decided to coordinate their actions and to stimulate demand and employment. They also pledged to fight against all forms of protectionism and to maintain trade and foreign investments. These actions will cost $1.1tn.[218]
They also committed to maintain the supply of credit by providing more liquidity and recapitalising the banking system, and to implement rapidly the stimulus plans. As for central bankers, they pledged to maintain low-rates policies as long as necessary. Finally, the leaders decided to help emerging and developing countries, through a strengthening of the IMF.
Policy recommendations
IMF recommendation
The IMF stated in September 2010 that the financial crisis would not end without a major decrease in unemployment as hundreds of millions of people were unemployed worldwide. The IMF urged governments to expand social safety nets and to generate job creation even as they are under pressure to cut spending. Governments should also invest in skills training for the unemployed and even governments of countries like Greece with major debt risk should first focus on long-term economic recovery by creating jobs.[219]
Raising interest rates
The Bank of Israel was the first to raise interest rates after the global recession began.[220] It increased rates in August 2009.[220]
On October 6, 2009, Australia became the first G20 country to raise its main interest rate, with the Reserve Bank of Australia moving rates up from 3.00% to 3.25%.[221]
The Norges Bank of Norway and the Reserve Bank of India raised interest rates in March 2010.[222]
Comparisons with the Great Depression
On April 17, 2009, the then head of the IMF Dominique Strauss-Kahn said that there was a chance that certain countries may not implement the proper policies to avoid feedback mechanisms that could eventually turn the recession into a depression. "The free-fall in the global economy may be starting to abate, with a recovery emerging in 2010, but this depends crucially on the right policies being adopted today." The IMF pointed out that unlike the Great Depression, this recession was synchronised by global integration of markets. Such synchronized recessions were explained to last longer than typical economic downturns and have slower recoveries.[223]
Olivier Blanchard, IMF Chief Economist, stated that the percentage of workers laid off for long stints has been rising with each downturn for decades but the figures have surged this time. "Long-term unemployment is alarmingly high: in the United States, half the unemployed have been out of work for over six months, something we have not seen since the Great Depression." The IMF also stated that a link between rising inequality within Western economies and deflating demand may exist. The last time that the wealth gap reached such skewed extremes was in 1928–1929.[224]
See also
- 2000s commodities boom
- Collateralized debt obligation
- Economic bubble
- Financial crisis of 2007–08
- Great Regression
- Savings and loan crisis
- Stock market crash
- Great Recession in the United States
References
- ↑ "World Economic Situation and Prospects 2013". Development Policy and Analysis Division of the UN secretariat. Retrieved December 19, 2012.
- ↑ United Nations (January 15, 2013). World Economic Situation and Prospects 2013 (trade paperback) (1st ed.). United Nations. p. 200. ISBN 978-9211091663.
The global economy continues to struggle with post-crisis adjustments
- 1 2 Davis, Bob (22 April 2009). "What's a Global Recession?". The Wall Street Journal. Retrieved 17 September 2013.
- 1 2 "World Economic Outlook - April 2009: Crisis and Recovery" (PDF). Box 1.1 (page 11-14). IMF. 24 April 2009. Retrieved 17 September 2013.
- 1 2 US Business Cycle Expansions and Contractions, NBER, accessed August 9, 2012.
- ↑ http://economics.mit.edu/files/1801
- ↑ http://slideplayer.com/slide/6075380/
- ↑ Merriam-Webster, "headword "recession"", Merriam-Webster Collegiate Dictionary online.
- ↑ Daniel Gross, The Recession Is... Over?, Newsweek, July 14, 2009.
- Mark Hulbert (July 15, 2010). "It's Dippy to Fret About a Double-Dip Recession".
- ↑ V.I. Keilis-Borok et al., Pattern of Macroeconomic Indicators Preceding the End of an American Economic Recession. Journal of Pattern Recognition Research, JPRR Vol.3 (1) 2008.
- ↑ "Consumer confidence falls to 7-month low | | The Bulletin". Bendbulletin.com. 2011-06-29. Retrieved 2013-08-17.
- ↑ Rutenberg, Jim; Thee-Brenan, Megan (2011-04-21). "Nation's Mood at Lowest Level in Two Years, Poll Shows". The New York Times.
- ↑ Zuckerman, Mortimer B. (2011-04-26). "The National Debt Crisis Is an Existential Threat". Usnews.com. Retrieved 2013-08-17.
- ↑ Yoshie Furuhashi (2011-04-26). "Dean Baker, "Further House Price Declines in the United States"". Mrzine.monthlyreview.org. Retrieved 2013-08-17.
- ↑ Wingfield, Brian (2010-09-20). "The End Of The Great Recession? Hardly". Forbes.
- ↑ Evans-Schaefer, Steve (2010-09-20). "Street Rallies Around Official Recession End". Forbes.
- ↑ "G20 Members". G20.org. Retrieved 15 January 2014.
- 1 2 3 4 5 6 7 8 9 "Quarterly National Accounts : Quarterly Growth Rates of real GDP, change over previous quarter". Stats.oecd.org. Retrieved 2013-08-17.
- ↑ "NBER Makes It Official: Recession Started in December 2007". The Wall Street Journal. 2008-12-01.
- ↑ Wearden, Graeme (2008-06-03). "Oil prices: George Soros warns that speculators could trigger stock market crash". London: The Guardian. Retrieved 2009-04-10.
- ↑ Andrews, Edmund L. (2008-10-24). "Greenspan Concedes Error on Regulation". New York Times. Retrieved 2009-04-18.
- ↑ Nouriel Roubini (January 15, 2009). "A Global Breakdown Of The Recession In 2009". Forbes.
- 1 2 3 "NYT-Paul Krugman-Geithner: Does He Pass The Test?". Nybooks.com. 2014-07-10. Retrieved 2014-08-23.
- ↑ Isidore, Chris (2008-12-01). "It's official: Recession since Dec '07". CNN Money. Retrieved 2009-04-10.
- ↑ Congressional Budget Office compares downturn to Great Depression. By David Lightman. McClatchy Washington Bureau. January 27, 2009.
- ↑ Finch, Julia (2009-01-26). "Twenty-five People at the Heart of the Meltdown". London: The Guardian. Retrieved 2009-04-10.
- ↑ Krugman, Paul (2009-01-04). "Fighting Off Depression". The New York Times.
- ↑ "IMF World Economic Outlook, April 2009: "Exit strategies will be needed to transition fiscal and monetary policies from extraordinary short-term support to sustainable medium-term frameworks." (p.38)" (PDF). Retrieved 2010-01-21.
- ↑ "Olivier Blanchard, the chief economist of the International Monetary Fund, "is advising officials around the world to keep economic stimulus programs in place no longer than necessary to chart a path to sustainable growth."". Bloomberg.com. 2005-05-30. Retrieved 2010-01-21.
- ↑ Cooke, Kristin (2009-08-21). "U.S deficit poses potential systemic risk: Taylor". Reuters.com. Retrieved 2010-01-21.
- ↑ Tcherneva, Pavlina R. (August 2014). "This Chart Shows Just How (Un)Equal Things Are During A 'Champion' Of The 99%'s Administration". Independent Journal Review. Retrieved 13 September 2014.
- ↑ Binyamin, Appelbaum (September 4, 2014). "Fed Says Growth Lifts the Affluent, Leaving Behind Everyone Else". New York Times. Retrieved 13 September 2014.
- ↑ Chokshi, Niraj (August 11, 2014). "Income inequality seems to be rising in more than 2 in 3 metro areas". Washington Post. Retrieved 13 September 2014.
- ↑ Kurtzleben, Danielle (August 23, 2014). "Middle class households' wealth fell 35 percent from 2005 to 2011". Vox.com. Retrieved 13 September 2014.
- ↑ Allen, Paddy (2009-01-29). "Global recession – where did all the money go?". London: The Guardian. Retrieved 2009-04-10.
- 1 2 3 4 "Financial Crisis Inquiry Report-Conclusions-January 2011". Fcic.law.stanford.edu. 2011-03-10. Retrieved 2013-04-22.
- ↑ "FCIC-Final Report Dissent of Wallison-January 2011" (PDF). Retrieved 2014-08-23.
- ↑ "Declaration of G20". Whitehouse.gov. Retrieved 2009-02-27.
- ↑ "Gary Gorton-NBER and Yale-Slapped in the Face by the Invisible Hand: Banking and the Panic of 2007-Updated May 2009" (PDF). Retrieved 2014-08-23.
- ↑ "CEPR-Dean Baker-The Economics of the Great Recession-June 29, 2014". Cepr.net. 2014-06-29. Retrieved 2014-08-23.
- ↑ Paul Krugman-Learned Economic Helplessness-July 1, 2014
- ↑ Mian, Atif and, Sufi, Amir (2014). House of Debt. University of Chicago. ISBN 978-0-226-08194-6.
- ↑ Sowell, Thomas (2009). The Housing Boom and Bust. Basic Books. pp. 57–58. ISBN 978-0-465-01880-2.
- ↑ Jon Wisman-Wage Stagnation, Rising Inequality and the Crisis of 2008-Retrieved June 2015
- ↑ IMF-Inequality, Leverage and Crises-Kumhoff and Ranciere-November 2010
- ↑ Stockhammer-Rising Inequality as a Cause of the Present Crisis-Amherst PERI-April 2012
- ↑ "The Economist-Points of Light-July 14, 2012". Economist.com. 2012-07-14. Retrieved 2013-04-22.
- ↑ "NPR-This American Life-The Giant Pool of Money-May 2008". Thisamericanlife.org. Retrieved 2013-04-22.
- ↑ "NYT-Paul Krugman-European Crisis Realities-February 2012". Krugman.blogs.nytimes.com. 2012-02-25. Retrieved 2013-04-22.
- 1 2 Michael Simkovic, Competition and Crisis in Mortgage Securitization
- ↑ Polleit, Thorsten (2007-12-13). "Manipulating the Interest Rate: a Recipe for Disaster". Mises Institute. Retrieved 2009-01-04.
- ↑ Pettifor, Ann (16 September 2008). "America's financial meltdown: lessons and prospects". openDemocracy. Retrieved 2009-01-04.
- ↑ Karlsson, Stefan (2004-11-08). "America's Unsustainable Boom". Mises Institute. Retrieved 2009-01-04.
- ↑ "The End of the Affair". Economist. 2008-10-30. Retrieved 2009-02-27.
- ↑ NYT-Krugman-Block those Economic Metaphors-December 2010
- ↑ Martti Randveer; Lenno Uusküla; Liina Kulu. "THE IMPACT OF PRIVATE DEBT ON ECONOMIC GROWTH". Eestipank.ee. Retrieved 2013-04-22.
Both theoretical and empirical evidence show that recessions are steeper in countries with high levels of private debt and/or credit booms." and "We find that a higher level of debt before a recession is correlated with smaller economic growth after the economic slowdown has finished.
- ↑ Bianco, James (2012-06-13). "Chart titled "Anyone See Deleveraging?"". Ritholtz.com. Retrieved 2014-08-23.
- ↑ McCarthy, Ryan (2010-10-22). "How American Income Inequality Hit Levels Not Seen Since The Depression". huffingtonpost.com. Retrieved 2010-10-24.
- ↑ "IMF-Report Extract Chapter 3 – April 2012" (PDF). Retrieved 2013-08-17.
- ↑ "McKinsey-Debt and deleveraging: The global credit bubble and its economic consequences-Updated-July 2011". Mckinsey.com. 2013-03-13. Retrieved 2013-08-17.
- 1 2 Dirk J Bezemer: "No One Saw This Coming" Understanding Financial Crisis Through Accounting Models, available via: MPRA, esp. p. 9 and appendix.
- ↑ "From the subprime to the terrigenous: Recession begins at home". Land Values Research Group. June 2, 2009. (A survey of recessions or expected recessions in 40 countries, 33 of which arguably had property bubbles.)
- ↑ "The end of Poland's house price boom". Global Property Guide. August 25, 2008.
- ↑ "Real estate prices in Adriatic Coast up, Zagreb down". Global Property Guide. August 19, 2008.
- ↑ "The good times are here again". Global Property Guide. February 28, 2008.
- ↑ "Looming housing slump in China". Global Property Guide. September 1, 2008.
- ↑ Monica Davey (December 25, 2005). "2005: In a Word". New York Times.
- ↑ "The global housing boom". The Economist. June 16, 2005.
- ↑ Jurado, Kyle; Ludvigson, Sydney C.; Ng, Serena (2015). "Measuring Uncertainty". American Economic Review. 105 (3): 1177–1216. doi:10.1257/aer.20131193.
- ↑ Nakamura, Emi; Sergeyev, Dmitriy; Steinsson, Jón (2015). "Growth-Rate and Uncertainty Shocks in Consumption: Cross-Country Evidence" (PDF). SSRN 2079921
 . Retrieved 2016-03-18.
 - ↑ Peter J. Wallison, "Cause and Effect: Government Policies and the Financial Crisis," (Washington, DC: American Enterprise Institute, November, 2008.
- ↑ Committee on Oversight and Government Reform, Statement of Edward Pinto, December 9, 2008, 4.
- 1 2 Peter J. Wallison (January 2011). "Dissent from the Majority Report of the Financial Crisis Inquiry Commission". American Enterprise Institute. Retrieved 2012-11-20.
- ↑ Joseph Fried, Who Really Drove the Economy Into the Ditch? (New York, NY: Algora Publishing, 2012), 121.
- ↑ Graham Fisher (June 29, 2001). "Housing in the New Millennium: A Home without Equity Is Just a Rental with Debt". Ssrn.com. Retrieved 2012-11-20.
- ↑ Joseph Fried, Who Really Drove the Economy Into the Ditch? (New York, NY: Algora Publishing, 2012), 148.
- ↑ Barry Ritholtz (November 26, 2011). "Examining the Big Lie". The Big Picture.
- ↑ Paul Krugman (November 6, 2014). "Triumph of the Wrong". The New York Times.
- ↑ Michael LewisPhotograph by Jonas Fredwall Karlsson. "Vanity Fair-Michael Lewis-Betting the Blind Side-April 2010". Vanityfair.com. Retrieved 2013-08-17.
- 1 2 Lanman, Scott (March 5, 2009). "Bloomberg – Senators Dodd & Shelby Demand Information". Bloomberg. Retrieved July 11, 2011.
- ↑ The Warning| Frontline
- 1 2 Bethany McLean and Joe Nocera, All the Devils Are Here: The Hidden History of the Financial Crisis Portfolio, Penguin, 2010, p.104-7
- 1 2 Anthony Faiola, Ellen Nakashima and Jill Drew (2008-10-15). "What Went Wrong". The Washington Post. Retrieved 2009-04-10.
- ↑ Krugman, Paul (2009). The Return of Depression Economics and the Crisis of 2008. W.W. Norton Company Limited. ISBN 978-0-393-07101-6.
- ↑ NYT-Paul Krugman-Financial Reform 101 – April 2010
- ↑ Labaton, Stephen (2008-10-03). "Agency's '04 Rule Let Banks Pile Up New Debt, and Risk". The New York Times. Retrieved 2010-05-24.
- ↑ Reported and Narrated by Stephen Labaton Produced by Amy O'Leary (2008-09-28). "The Day the S.E.C. Changed the Game - The New York Times". Nytimes.com. Retrieved 2012-11-20.
- ↑ "Gary Gorton-NBER and Yale-Slapped in the Face by the Invisible Hand: Banking and the Panic of 2007-Updated May 2009" (PDF). Retrieved 2013-04-22.
- ↑ Batra, Ravi (May 8, 2011). "Weapons of Mass Exploitation?". Truthout.org. Retrieved June 4, 2011.
- ↑ Batra, Ravi (April 29, 2011). "Ravi Batra interview". Thom Hartman's radio show (at 1:15). Retrieved June 4, 2011.
- ↑ Bjørnholt, Margunn; McKay, Ailsa (2014). "Advances in Feminist Economics in Times of Economic Crisis". In Bjørnholt, Margunn; McKay, Ailsa. Counting on Marilyn Waring: New Advances in Feminist Economics (PDF). Demeter Press. pp. 7–20. ISBN 9781927335277.
- ↑ "Most Americans say U.S. in recession despite data: poll". Reuters. 2011-04-28.
- ↑ Robert Wright (2012-12-05). "What If the Fiscal Cliff Is the Wrong Cliff?". The Atlantic. Retrieved 2013-04-22.
- ↑ "From Financial Crash to Debt Crisis". Nber.org. Retrieved 2013-04-22.
- ↑ "Internal Debt Crises and Sovereign Defaults". Nber.org. Retrieved 2013-04-22.
- ↑ Anonymous. "Debt-Reset Is Inevitable". Libertyloveandjusticeforall.com. Retrieved 2013-04-22.
- ↑ "Fred Database-Real GDP". Research.stlouisfed.org. Retrieved 2013-08-17.
- ↑ "CBO-Budget and Economic Outlook for 2013-2023". Cbo.gov. Retrieved 2013-08-17.
- ↑ "Fred Database-Unemployment Rate". Research.stlouisfed.org. Retrieved 2013-08-17.
- ↑ "Fred Database-Unemployed". Research.stlouisfed.org. Retrieved 2013-08-17.
- ↑ "BEA-Gross Domestic Product Table 1.1.5-Interactive Data". Bea.gov. 2010-12-23. Retrieved 2013-08-17.
- ↑ "Fred Database-S&P Case Shiller 20-City Home Price Index". Research.stlouisfed.org. 2013-07-30. Retrieved 2013-08-17.
- ↑ "Fred Database-S&P 500 Index". Research.stlouisfed.org. Retrieved 2013-08-17.
- ↑ "Fred Database-U.S. Net Worth of Households and Non-Profit Organizations". Research.stlouisfed.org. Retrieved 2013-08-17.
- ↑ "Graph: Federal Debt: Total Public Debt as Percent of Gross Domestic Product (GFDEGDQ188S) - FRED - St. Louis Fed". Research.stlouisfed.org. Retrieved 2013-08-17.
- ↑ Linkins, Jason (2011-09-13). "according to Table P-5 of the Census report of (Lack of) Income, the median male is now worse on a gross, inflation adjusted basis, than he was in... 1968! While back then, the median income of male workers was $32,844, it has since declined to $32,137 as of 2010.". Huffingtonpost.com. Retrieved 2013-04-22.
- ↑ "The United States went through its longest, and by most measures worst economic recession since the Great Depression between December 2007 and June 2009.". Cbpp.org. 2013-04-09. Retrieved 2013-04-22.
- ↑ "Chart: U.S. Employment to Population ratio". Rwer.wordpress.com. Retrieved 2013-04-22.
- ↑ Merline, John (2012-04-20). "A record 5.4 million workers and their dependents have signed up to collect federal disability checks since President Obama took office, according to the latest official government data, as discouraged workers increasingly give up looking for jobs and take advantage of the federal program.". News.investors.com. Retrieved 2013-04-22.
- ↑ "The Lost Decade of the Middle Class | Pew Social & Demographic Trends". Pewresearch.org. 2012-08-22. Retrieved 2013-08-17.
- ↑ Contributors (2012-10-07). "Another Pew report shows that those ages 55 to 64 are 10 percent wealthier today, even after the Great Recession, than Americans of that age bracket were in 1984. Those younger than 35 are 68 percent less wealthy than the same bracket was in 1984". Businessinsider.com. Retrieved 2013-04-22.
- ↑ "In 2009, the wealthiest 20% of households controlled 87.2% of all wealth, up from 85.0% in 2007. The top 1% controlled 35.6% of all wealth, up from 34.6% in 2007". Epi.org. 2011-03-29. Retrieved 2013-04-22.
- ↑ "Median Household Income History in the United States". Davemanuel.com. Retrieved 2012-05-15.
- ↑ Your Money Contributors (2011-12-27). "Between 2000 and 2010, the number of suburban households below the poverty line increased by 53 percent, compared to a 23 percent increase in poor households in urban areas, according to a Brookings Institution analysis of census data.". Businessinsider.com. Retrieved 2012-05-15.
- ↑ "Most Americans say U.S. in recession despite data: poll". Reuters. April 28, 2011.
- ↑ "Income, Poverty and Health Insurance Coverage in the United States: 2013". U.S. Census Bureau.
- ↑ Kohut, Andrew (17 March 2014). "Resurgent public optimism on the economy? Don't hold your breath". Fact Tank. Pew Research Center. Retrieved 15 April 2015.
Blake, Aaron (25 September 2014). "Americans think we're in a recession. They're wrong. But still…". Washington Post. Retrieved 15 April 2015.
Blanton, Dana (15 January 2015). "Fox News Poll: 64 percent say U.S. still in recession, yet 58 percent optimistic about economy". Fox News. Retrieved 15 April 2015. - 1 2 Wolf, Martin (2012-04-27). "The Impact of Fiscal Austerity in the Eurozone". Blogs.ft.com. Retrieved 2013-08-17.
- 1 2 3 "CIA World Factbook-Greece Example". Cia.gov. Retrieved 2013-08-17.
- 1 2 Eurostat-Selected Principal European Economic Indicators
- ↑ "Eurostat News Release-Euro indicators-23 April 2012" (PDF). Retrieved 2013-08-17.
- ↑ Smith, Aaron (2012-10-31). "Eurozone unemployment hits record high". Money.cnn.com. Retrieved 2013-08-17.
- ↑ NYT-Paul Krugman-Austerity and Growth (Again)-April 2012
- ↑ "Central Europe Risks Downgrades on Worsening Finances (Update1)". Bloomberg.com. 2009-09-21. Retrieved 2010-01-21.
- ↑ "Zloty to Gain, Says LBBW, Most Accurate Forecaster (Update1)". Bloomberg.com. 2009-10-09. Retrieved 2010-01-21.
- ↑ "Poland's Economic Outlook May Be Raised by IMF, PAP Reports". Bloomberg.com. 2009-12-15. Retrieved 2010-01-21.
- ↑ "S Korea avoids entering recession". BBC. 2009-04-24. Retrieved 2010-01-21.
- ↑
- ↑ Zappone, Chris (2009-06-03). "Australia dodges recession". The Sydney Morning Herald.
- ↑ "Australia's economy shrank in last quarter of 2008". Wotnews. March 2009. Archived from the original on 6 October 2011.
- ↑ Bruno Wenn (January 2013). "Exceedingly high interest rates". dandc.eu.
- 1 2 "GDP and main components - volumes: Percentage change on previous quarter (seasonally adjusted, and adjusted by working days)". Eurostat. 10 January 2014. Retrieved 10 January 2014.
- 1 2 3 "Albanian Real growth rate from one quarter to the previous quarter, seasonally adjusted (Qt,i/Qt,i-1), (2005=100)" (XLS). INSTAT. 8 January 2014.
- 1 2 3 4 5 6 "Third Quarter GDP Times Series 2013: Gross Domestic Product by Activity, Constant 2000 prices – BZ$ million" (XLS). Statistical Institute of Belize. 18 December 2013.
- 1 2 "PRODUCTO INTERNO BRUTO TRIMESTRAL 2010 Primer Trimestre (each chapter is packed into an overall rar file)" (RAR+PDF). PIBtrimestral1r20104.pdf: Capítulo IV (Ajuste Estacional y Extracción de Señales Por Actividad Económica) - Cuadro N° 04.01.02, BOLIVIA: VARIACIÓN CON RELACIÓN AL PERIODO ANTERIOR DE LA DESESTACIONALIZACIÓN DEL PRODUCTO INTERNO BRUTO POR ACTIVIDAD ECONÓMICA SEGÚN, TRIMESTRE, 1991 - 2010 (En porcentaje) (in Spanish). Instituto Nacional de Estadística de Bolivia. 30 July 2010.
- ↑ "Gross Domestic Product (GDP) at 2005 Constant Prices by Area of Economic Activity - Seasonally Adjusted. Quarterly Since 2000: Quarterly Percentage Change" (XLS). Banco de la República, Colombia. 19 September 2013.
- ↑ "GDP by branch of activity: By branches of economic activity at constant prices for 2005 deseasonalized series / 2000-I a 2013-III" (XLS). Departamento Administrativo Nacional de Estadística (DANE). 19 December 2013.
- ↑ "Gross Domestic Product (1991-2013, at 1991 constant prices): Original Series, Trend Cycle and Seasonally Adjusted Series". Banco Central de Costa Rica. 7 January 2014.
- ↑ "Cuentas Nacionales Trimestrales del Ecuador No.65 (Enero 2009)" (PDF). Cuadro No 1: Oferta - Utilizacion de bienes y servicios, variacion trimestral, tasas de t/t-1, dolares constantes de 2000, P.I.B. (in Spanish). Banco Central del Ecuador. 27 January 2009.
- ↑ "Estadisticas Macroecomicas - Presentacion Coyuntural (Diciembre 2012)" (PDF). PRODUCTO INTERNO BRUTO, PIB, (Precios constantes de 2007, datos desestacionalizados, Tasas de variación, Variación t/t-1) (in Spanish). Banco Central del Ecuador. 1 February 2013.
- ↑ "Estadisticas Macroecomicas - Presentacion Coyuntural (Diciembre 2013)" (PDF). PRODUCTO INTERNO BRUTO - PIB, Precios constantes de 2007, Tasas de variación, Variación t/t-1 (in Spanish). Banco Central del Ecuador. 13 December 2013.
- 1 2 "1- Base de Datos Económica-Financiera > IV.7 Producto Interno Bruto Trimestral (PIBt)" (in Spanish). Banco Central de Reserva de El Salvador. 30 December 2013.
- ↑ "G20 Members". G20.org. Retrieved 15 January 2014.
- ↑ "Statistical Table Customization: Seasonally adjusted GDP and selected expenditure components - percentage changes in real terms over the preceding quarter". Census and Statistics Department (Hong Kong). 15 November 2013.
- 1 2 3 4 5 "Jamaican Economic Statistics: National Accounts: Quarterly Rate of Growth of Value Added GDP by Industry at Constant 2007 Prices (Seasonally Adjusted)". Statistical Institute of Jamaica. 31 December 2013.
- 1 2 "GDP by the production method: Basic indexes - GDP allowing for seasonal fluctuations" (DOC). The Agency of Statistics of the Republic of Kazakhstan. 2012.
- 1 2 "Table: Gross Domestic Product by production approach, by NKD Rev.1, by quarters (volume indices, compared to the corresponding period of the previous year, %)". MAK Stat Database. State Statistical Office of the Republic of Macedonia. 13 December 2013.
- ↑ "Gross Domestic Product 2013 second quarter, seasonal adjustment" (PDF). Table 1B: Seasonally Adjusted GDP at constant 2005 prices - Percentage Change from Preceding Quarter. Department of Statistics, Malaysia. 22 August 2013.
- ↑ "Quarterly Gross Domestic Product 2013 third quarter" (PDF). Chart 3 and Table 6B: Seasonally Adjusted GDP at constant 2005 prices - Percentage Change from Preceding Quarter. Department of Statistics, Malaysia. 15 November 2013.
- 1 2 "Databank table: Seasonally adjustments of Gross Domestic Product and of main elements of use, average prices of 2000, 1995-2010". National Bureau Of Statistics of the Rublic Of Moldova. 31 May 2011.
- 1 2 "CUENTAS NACIONALES DE PARAGUAY - TERCER TRIMESTRE 2013" (PDF). Anexo: Tasas de variacion - PIB desestacionalizado (t/t-1) (in Spanish). Banco Central del Paraguay. 20 December 2013.
- ↑ "Informe Técnico - PBI Trimestral Nº 04 Noviembre 2013: Comportamiento de la Economía Peruana en el Tercer Trimestre de 2013" (PDF). Anexo Nº 4: SERIE DESESTACIONALIZADA POR TIPO DE GASTO, 2002_I - 2013_III (Variación porcentual trimestral del Índice de Volumen Físico respecto al trimestre anterior, Valores a precios constantes de 1994) (in Spanish). Instituto Nacional de Estadística e Informática (INEI). 22 November 2013.
- ↑ "3rd Quarter 2013 National Accounts of the Philippines (multiple files packed as a rar file)" (RAR). 3Q2013_SANA_PUB.XLS (page 3): Summary Table 1 - SEASONALLY ADJUSTED NATIONAL ACCOUNTS SERIES at Constant 2000 Prices: Quarter to quarter in million Pesos (First Quarter 1998 to Third Quarter 2013). National Statistical Coordination Board. 28 November 2013.
- ↑ "The seasonally adjusted national accounts of the Philippines (Third Quarter 2013): SEASONALLY ADJUSTED NATIONAL ACCOUNTS SERIES at Constant 2000 Prices: Quarter to quarter growth rates (First Quarter 1998 to Third Quarter 2013)". National Statistical Coordination Board. 28 November 2013.
- 1 2 3 "Quarterly gross domestic product by production approach, at constant prices, seasonally adjusted data, of the Republic of Serbia". Statistical Office of the Republic of Serbia. 31 December 2013.
- ↑ SingStat Time Series (access to database require payment subscription)
- ↑ "Statistical Tables from Economic Survey of Singapore (Fourth Quarter 2008): GDP by Industry at 2000 prices, Seasonally Adjusted" (PDF). Statistics Singapore. 26 February 2009.
- ↑ "Statistical Tables from Economic Survey of Singapore (Fourth Quarter 2010): GDP by Industry at 2005 prices, Seasonally Adjusted" (PDF). Statistics Singapore. 17 February 2011.
- ↑ "Statistical Tables from Economic Survey of Singapore (Third Quarter 2013): GDP by Industry at 2005 prices, Seasonally Adjusted" (PDF). Statistics Singapore. 21 November 2013.
- ↑ "SingStat Table Builder: National Accounts: M013362 - Gross Domestic Product At 2005 Market Prices, By Industry, Quarterly, (SA) (Period on Period)". Statistics Singapore. 21 November 2013.
- ↑ http://www.24ur.com/novice/gospodarstvo/recesije-je-konec-bruselj-nam-napoveduje-rast.html
- ↑ http://www.sloveniatimes.com/light-at-the-end-of-the-tunnel-slovenia-technically-out-of-recession
- 1 2 "Macro database: GDP by Expenditures - Seasonally Adjusted (Quarterly, at 2006 prices, 1981-2013)". National Statistics - Republic of China (Taiwan). 29 November 2013.
- ↑ "Gross Domestic Product 1993 until Q3/2013: Table 6.1 - Gross National Product and GDP at 1988 Prices (Seasonally Adjusted) q-o-q Growth Rate" (XLS). Office of the National Economic and Social Development Board (Thailand). 18 November 2013.
- 1 2 "Quarterly gross domestic product estimates of Ukraine for 2001 – 2012" (PDF). Seasonally Adjustment of gross domestic product at constant prices of 2007 (Table 5.1 - Gross Domestic Product, page 99). State Statistics Service Of Ukraine. 30 August 2013.
- ↑ "ЕКСПРЕС-ВИПУСК: ВАЛОВИЙ ВНУТРІШНІЙ ПРОДУКТ УКРАЇНИ ЗА 1 КВАРТАЛ - 4 КВАРТАЛ 2012 РОКУ - ВАЛОВИЙ ВНУТРІШНІЙ ПРОДУКТ ВИРОБНИЧИМ МЕТОДОМ (RAPID RELEASE: GROSS DOMESTIC PRODUCT OF UKRAINE Q1-Q4 2012 - Gross domestic product production methods)" (Zip PDF) (in Ukrainian). State Statistics Service Of Ukraine. 17 March 2014.
- ↑ "ЕКСПРЕС-ВИПУСК: ВАЛОВИЙ ВНУТРІШНІЙ ПРОДУКТ УКРАЇНИ ЗА 1 КВАРТАЛ - 4 КВАРТАЛ 2013 РОКУ - ВАЛОВИЙ ВНУТРІШНІЙ ПРОДУКТ ВИРОБНИЧИМ МЕТОДОМ (RAPID RELEASE: GROSS DOMESTIC PRODUCT OF UKRAINE Q1-Q4 2013 - Gross domestic product production methods)" (Zip PDF) (in Ukrainian). State Statistics Service Of Ukraine. 11 March 2014.
- ↑ "Gross Domestic Product Quarter on Quarter growth". Office for National Statistics. 1 July 2016.
- ↑ Charles Forelle (May 19, 2012). "In European Crisis, Iceland Emerges as an Island of Recovery". Wall Street Journal.
- ↑ "Latvia". Oxford Economic Country Briefings. Findarticles.com. September 26, 2008. Retrieved 2009-01-04.
- ↑ Evans-Pritchard, Ambrose (2008-09-25). "Ireland leads eurozone into recession". London: Telegraph. Retrieved 2009-01-04.
- ↑ "New Zealand falls into recession". BBC News. 2008-09-26. Retrieved 2009-01-04.
- ↑ "HIGHLIGHTS: Crisis sends Japan into first recession in 7 years". TOKYO: Reuters. 2008-11-17. Retrieved 2009-01-04.
- ↑ "HK shares may fall; exporters may drop". HONG KONG: Reuters. 2008-11-16. Retrieved 2009-01-04.
- ↑ Dunkley, Jamie (10 October 2008). "Singapore slides into recession". London: Telegraph. Retrieved 2009-01-04.
- ↑ "OECD area GDP down 0.1% in the third quarter of 2008" (PDF). OECD. 2008-11-20. Archived from the original (PDF) on March 26, 2009. Retrieved 2009-04-10.
- ↑ Fitzgibbons, Patrick (2008-11-14). "TOPWRAP 10-Germany, China, US feel pain of global downturn". NEW YORK: Reuters. Retrieved 2009-01-04.
- ↑ Strupczewski, Jan (2008-11-14). "Euro zone in recession, December rate cut expected". BRUSSELS: Reuters.com. Retrieved 2009-01-04.
- ↑ "Spain's economy enters recession". BBC News. 2009-01-28. Retrieved 2009-04-10.
- ↑ "Taiwan in recession as economy contracts record 8.36 pct". TAIPEI (AFP). 18 February 2009. Archived from the original on January 30, 2014. Retrieved 10 April 2009.
- ↑ "SECO – Gross Domestic Product in Q2 2009". Seco.admin.ch. 2009-11-25. Retrieved 2010-01-21.
- ↑ In-Soo Nam (2009-04-24). "South Korea Economy Avoids Recession, Grows 0.1% - WSJ.com". Online.wsj.com. Retrieved 2010-01-21.
- ↑ "Reflating the dragon". Beijing: The Economist. November 13, 2008. Retrieved 2009-01-04.
- ↑ "National Bank estimate: Ukraine GDP down 20 percent in January". Kyiv Post. 2009-02-17. Retrieved 2009-04-10.
- ↑ "Ukraine | Global Finance Magazine". Gfmag.com. Retrieved 2014-08-23.
- ↑ "Ukrainian recession data""Quarterly gross domestic product estimates of Ukraine for 2001 – 2012" (PDF). Seasonal Adjustment of gross domestic product at constant prices of 2007 (Table 5.1 - Gross Domestic Product, page 99). State Statistics Service Of Ukraine. 30 August 2013.
- ↑ http://irps.ucsd.edu/assets/001/500904.pdf
- ↑ Alford, Peter (2009-02-16). "Japan headed for longest, deepest post-war recession". The Australian. Retrieved 2009-04-10.
- ↑ "Japanese GDP falls at biggest rate since 1955 - World business- msnbc.com". MSNBC. 2009-05-19. Retrieved 2010-01-21.
- ↑ "CIA Adds Economy To Threat Updates White House Given First Daily Briefing" article by Joby Warrick, Washington Post Staff Writer, Thursday, February 26, 2009
- ↑ Jack Ewing (March 10, 2009). "Economic Woes Raising Global Political Risk". Business Week.
- ↑ "Experts: Financial crisis threatens US security". Politico. Associated Press. 11 March 2009.
- 1 2 "Europe | Iceland protest ends in clashes". BBC News. 2008-11-23. Retrieved 2012-05-15.
- ↑ NPR article "Economic Crisis Poses Threat To Global Stability" by Tom Gjelten
- ↑ Romero, Simon. "Bus-fare protests hit Brazil's two biggest cities", The New York Times, June 2013.
- ↑ Letsch, Constanze. "Turkey protests spread after violence in Istanbul over park demolition", The Guardian, May 2013.
- ↑ Dobbs, David. "The New York Times – Breaking News, World News & Multimedia". International Herald Tribune. Archived from the original on February 28, 2009. Retrieved 2013-04-22.
- ↑ Maltezou, Renee (2009-02-25). "Greeks shut airports, services to protest economy". Reuters. Retrieved 2012-05-15.
- ↑ Megan K. Stack (2009-01-17). "Protests spread in Europe amid economic crisis". Los Angeles Times. Retrieved 2012-05-15.
- ↑ Dobbs, David. "The New York Times – Breaking News, World News & Multimedia". International Herald Tribune. Archived from the original on February 4, 2009. Retrieved 2013-04-22.
- ↑ Ian Traynor, Europe editor (2009-01-31). "Governments across Europe tremble as effects of global recession prompt angry people to take to the streets". The Guardian. London. Retrieved 2012-05-15.
- ↑ Abend, Lisa (11 September 2012). "Barcelona Warns Madrid: Pay Up, or Catalonia Leaves Spain". TIME. "A pro-independence march pulled in a crowd estimated by city police at 1.5 million.". Retrieved 16 September 2012.
- ↑ "EU Proposes €200 Billion Stimulus Plan". Businessweek. 2008-11-26. Retrieved 2010-01-21.
- ↑ Gullapalli, Diya and Anand, Shefali. "Bailout of Money Funds Seems to Stanch Outflow", The Wall Street Journal, September 20, 2008.
- ↑ Bull, Alister. "Fed says to make loans to aid money market funds", Reuters, September 19, 2008.
- ↑ (Press Release) FRB: Board Approves Two Interim Final Rules, Federal Reserve Bank, September 19, 2008.
- ↑ Boak, Joshua (Chicago Tribune). "SEC temporarily suspends short selling", San Jose Mercury News, September 19, 2008.
- ↑ "Housing and Jobs Data Suggest Steady Growth". The New York Times. Associated Press. May 23, 2013. Retrieved May 24, 2013.
- ↑ Nathaniel Popper (May 23, 2013). "Fed Fears Shake Global Markets but Fade on Wall St.". The New York Times. Retrieved May 24, 2013.
- ↑ "Asian central banks spend billions to prevent crash". International Herald Tribune. 2008-09-16. Archived from the original on September 19, 2008. Retrieved 2008-09-21.
- ↑ "Chinese pharmaceutical exporters to benefit from latest tax rebates increases". Asia Manufacturing Pharma. 2008-12-01. Retrieved 2008-12-01.
- ↑ "Germany Rescues Hypo Real Estate". Deutsche Welle. 2008-10-06.
- ↑ "Gordon Brown should say 'sorry'". London: Telegraph.co.uk. 2009-03-09. Retrieved 2009-03-09.
- ↑ "It Doesn't Exist!". Newsweek.com. 2008-12-06. Retrieved 2008-12-15.
- ↑ Waterfield, Bruno (2009-03-25). "EU resists deficits". London: Telegraph.co.uk. Retrieved 2010-01-21.
- ↑ "Cutting the deficit: three years down, five to go?". The Institute for Fiscal Studies. 8 May 2013. Retrieved 2 February 2016.
- ↑ "EU fiscal consolidation after the financial crisis: Lessons from past experiences". VOX CEPR's Policy Portal. 2 October 2010. Retrieved 2 February 2016.
- ↑ "G20 leaders seal tn global deal". BBC News. 2009-04-02.
- ↑ Alderman, Liz (2010-09-13). "I.M.F. Calls for Countries to Focus on Jobs". The New York Times.
- 1 2 "Israel rate cut suggests more emerging market cuts – Emerging Markets Report". MarketWatch. Retrieved 2012-05-15.
- ↑ "Australia raises interest rates". BBC News. 2009-10-06. Retrieved 2010-01-21.
- ↑ "India's Central Bank Raises Interest Rates". The New York Times. 2010-03-19.
- ↑ Evans, Ambrose (2009-04-16). "IMF warns over parallels to Great Depression". London: Telegraph.co.uk. Retrieved 2010-01-21.
- ↑ Financial Crisis (2010-09-13). "IMF fears 'social explosion' from world jobs crisis". London: Telegraph. Retrieved 2013-08-17.
Further reading
- Coffee, John C. (2009). "What Went Wrong? An Initial Inquiry Into the Causes of the 2008 Financial Crisis". Journal of Corporate Law Studies. 9 (1): 1–22. doi:10.1080/14735970.2009.11421533.
- Duménil, Gérard; Lévy, Dominique (2013). The Crisis of Neoliberalism (Reprint ed.). Harvard University Press. ISBN 978-0-674-07224-4.
- Fried, Joseph (2012). Who Really Drove the Economy into the Ditch?. New York: Algora Publishing. ISBN 978-0-87586-942-1.
- Lo, Andrew W. (2012). "Reading About the Financial Crisis: A Twenty-One-Book Review". Journal of Economic Literature. 50 (1): 151–178. JSTOR 23269975.
- Paulson, Hank (2010). On the Brink: Inside the Race to Stop the Collapse of the Global Financial System. London: Headline. ISBN 978-0-7553-6054-3.
- Read, Colin (2009). Global Financial Meltdown: How We Can Avoid the Next Economic Crisis. New York: Palgrave Macmillan. ISBN 978-0-230-22218-2.
- Rosenberg, Jerry M. (2012). The Concise Encyclopedia of The Great Recession 2007–2012 (2nd ed.). Scarecrow Press.
- Woods, Thomas E. (2009). Meltdown: A Free-Market Look at Why the Stock Market Collapsed, the Economy Tanked, and Government Bailouts Will Make Things Worse. Washington, DC: Regnery Publishing. ISBN 978-1-59698-587-2.
External links
| Wikimedia Commons has media related to Economic crisis from 2007. |
| Wikinews has related news: |
| Wikiversity has learning materials about Great Recession at |
| Wikiquote has quotations related to: Great Recession |
- Assessing the Costs and Consequences of the 2007–09 Financial Crisis and Its Aftermath, September, 2013, Federal Reserve Bank of Dallas
- Tracking the Global Recession accurate and useful information from the Federal Reserve Bank of St. Louis
- Federal Reserve Bank of St. Louis, "What Caused the Crisis", collection of papers
- Global Outlook, Uri Dadush, "International Economics Bulletin", June 2009.
- Global Recession ongoing coverage from BBC News
- Global Recession ongoing coverage from The Guardian
- ILO Job Crisis Observatory
- Financial Transmission of the Crisis: What’s the Lesson? Shimelse Ali, Uri Dadush, Lauren Falcao, "International Economics Bulletin, June 2009.
- A Spectral Analysis of World GDP Dynamics: Kondratieff Waves, Kuznets Swings, Juglar and Kitchin Cycles in Global Economic Development, and the 2008–2009 Economic Crisis.
- The Second Wave of the Global Crisis? On mathematical analyses of some dynamic series
- Recession 'link' with over 10,000 suicides in the West. University of Oxford, June 2014.