Demographics of the Republic of Ireland
| Demographics of Ireland | |
|---|---|
|
Population of the Republic of Ireland from 1841 | |
| Population | 4,757,976 (2016 census) |
| Density | 68 per km2 |
| Growth rate | 1.77% |
| Birth rate | 16.1 births/1,000 population |
| Death rate | 6.34 deaths/1,000 population |
| Life expectancy | 80.19 years |
| • male | 78 years |
| • female | 82.6 years |
| Fertility rate | 2.02 children born/woman |
| Infant mortality rate | 3.85 deaths/1,000 live births |
| Net migration rate | 0.86 migrant(s)/1,000 population |
| Age structure | |
| 0–14 years | 21.3% |
| 15–64 years | 67.0% |
| 65 and over | 11.7% |
| Sex ratio | |
| Total | 0.99 male/female |
| At birth | 1.057 male/female |
| Under 15 | 1.07 male/female |
| 15–64 years | 1.00 male/female |
| 65 and over | 0.81 male/female |
| Nationality | |
| Nationality | Irish |
| Major ethnic | Irish 87.4% |
| Minor ethnic | Other white 7.5%, Asian 1.3%, black 1.1%, mixed 1.1%, unspecified 1.6% (2006) |
| Language | |
| Official | English, Irish |
| Spoken | Irish Sign Language, Shelta, Ulster Scots |

The Republic of Ireland had a population of 4,757,976 at the 2016 census.[1]
Demographic history
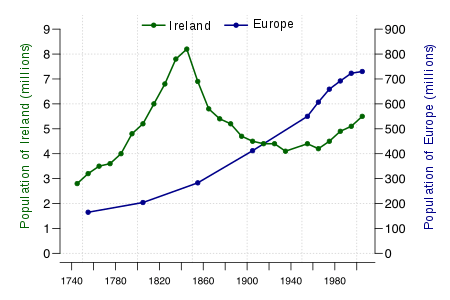
The island of Ireland, throughout most of its history, had a small population, comparable to that of other regions of similar area in Europe. In the 18th and early 19th centuries, Ireland experienced a major population boom as a result of the Agricultural and Industrial Revolutions. In the 50-year period 1790-1840, the population of the island doubled from 4 million to 8 million. At its peak, Ireland's population density was similar to that of England and continental Europe.
This changed dramatically with the Great Famine of the mid-19th century, which led to mass starvation and consequent mass emigration. In the area covering the present day Republic of Ireland, the population reached about 6.5 million in the mid 1840s. Ten years later it was down to 5 million. The population continued a slow decline well into the 20th century, with the Republic recording a low of 2.8 million in the 1961 census.[2]
During the 1960s, the population started to grow once more, although slowly as emigration was still common. In the 1990s the country entered a period of rapid growth as a result of the Celtic Tiger Irish economic boom. Immigration began to far outweigh emigration. Many former Irish emigrants returned home, and Ireland became an attractive destination for immigrants, mainly from Central Europe, but also from Africa, Asia and elsewhere. However, with the 2008 onset of the Irish economic and banking crisis, the country's economy suffered, and since then Ireland has once again been experiencing net emigration.
In November 2013 Eurostat reported that the Republic had the largest net emigration rate of any European Union country at 7.6 people emigrating per 1,000 population. However, it has the youngest population of any country in the European Union and its population size is predicted to grow for many decades into the future, bucking the trend of declining population predicted for most European countries. A report published in 2008 predicted that the population would reach 6.7 million by 2060.[3] The country has also has been experiencing a baby boom, with increasing birth rates and overall fertility rates.[4] Despite this the total fertility rate is still below replacement.[5] This increase is primarily fueled by non-Irish immigration - in 2009, a quarter of all children born in the state were born to mothers who had immigrated from other countries.[6]
Ethnic groups and immigration
Gaelic culture and language forms an important part of the Irish national identity.
The Irish Travellers are an indigenous minority ethnic group. Traveller representative organisations are currently seeking official recognition of Traveller ethnicity by the Irish State.
In 2008, Ireland had the highest birth rate (18.1 per 1,000), lowest death rate (6.1 per 1,000) and highest net-migration rate (14.1 per 1,000) in the entire European Union – and the largest population growth rate (4.4%) in the 27-member bloc as a result.[7]
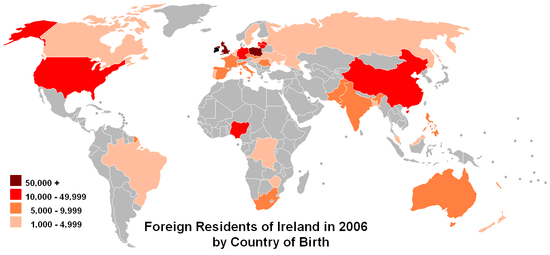
Ireland is home to people from all over the globe, especially in Dublin. The most common foreign nationalities include Polish, British, Lithuanian, Latvian and Nigerian.
Traditionally Ireland has been a land of mass emigration and it has had to adapt to mass immigration. Some illegal immigrants are reported to use sham marriages as method to gain legal status.[8][9][10] The Irish government has sought to work with UK government to stem the flow of illegal immigrants.[11][12][13]
Vital statistics of Ireland[14]
|
Life in Ireland |
|---|
|
Culture
Economy
General
Society
Politics
Policies
|
| Population on April 1 (x 1000) | Live births | Deaths | Natural change | Crude birth rate (per 1000) | Crude death rate (per 1000) | Natural change (per 1000) | Total fertility rate | |
|---|---|---|---|---|---|---|---|---|
| 1923 | 3 014 | 62 417 | 42 217 | 19 473 | 20.5 | 14.0 | 6.5 | |
| 1924 | 3 005 | 63 402 | 45 180 | 18 222 | 21.1 | 15.0 | 6.1 | |
| 1925 | 2 985 | 62 069 | 43 650 | 18 419 | 20.8 | 14.6 | 6.2 | |
| 1926 | 2 971 | 61 176 | 41 740 | 19 436 | 20.6 | 14.0 | 6.5 | |
| 1927 | 2 957 | 60 054 | 43 677 | 16 377 | 20.3 | 14.8 | 5.5 | |
| 1928 | 2 944 | 59 176 | 41 792 | 17 384 | 20.1 | 14.2 | 5.9 | |
| 1929 | 2 937 | 58 280 | 42 991 | 15 289 | 19.8 | 14.6 | 5.2 | |
| 1930 | 2 927 | 58 353 | 41 702 | 16 651 | 19.9 | 14.2 | 5.7 | 2.54 |
| 1931 | 2 933 | 57 086 | 42 947 | 14 139 | 19.5 | 14.6 | 4.8 | 2.49 |
| 1932 | 2 949 | 56 240 | 42 984 | 13 256 | 19.1 | 14.6 | 4.5 | 2.43 |
| 1933 | 2 962 | 57 364 | 40 539 | 16 825 | 19.4 | 13.7 | 5.7 | 2.47 |
| 1934 | 2 971 | 57 897 | 39 083 | 18 814 | 19.5 | 13.2 | 6.3 | 2.49 |
| 1935 | 2 971 | 58 266 | 41 543 | 16 723 | 19.6 | 14.0 | 5.6 | 2.50 |
| 1936 | 2 967 | 58 115 | 42 586 | 15 529 | 19.6 | 14.4 | 5.2 | 2.50 |
| 1937 | 2 948 | 56 488 | 45 086 | 11 402 | 19.2 | 15.3 | 3.9 | 2.45 |
| 1938 | 2 937 | 56 925 | 40 041 | 16 884 | 19.4 | 13.6 | 5.7 | 2.47 |
| 1939 | 2 934 | 56 070 | 41 717 | 14 353 | 19.1 | 14.2 | 4.9 | 2.43 |
| 1940 | 2 958 | 56 594 | 41 885 | 14 709 | 19.1 | 14.2 | 5.0 | 2.43 |
| 1941 | 2 993 | 56 780 | 43 797 | 12 983 | 19.0 | 14.6 | 4.3 | 2.42 |
| 1942 | 2 963 | 66 117 | 41 640 | 24 477 | 22.3 | 14.1 | 8.3 | 2.85 |
| 1943 | 2 946 | 64 375 | 43 494 | 20 881 | 21.9 | 14.8 | 7.1 | 2.80 |
| 1944 | 2 944 | 65 425 | 45 128 | 20 297 | 22.2 | 15.3 | 6.9 | 2.84 |
| 1945 | 2 952 | 66 861 | 42 762 | 24 099 | 22.6 | 14.5 | 8.2 | 2.90 |
| 1946 | 2 957 | 67 922 | 41 457 | 26 465 | 23.0 | 14.0 | 8.9 | 2.94 |
| 1947 | 2 974 | 68 978 | 44 061 | 24 917 | 23.2 | 14.8 | 8.4 | 2.98 |
| 1948 | 2 985 | 65 930 | 36 357 | 29 573 | 22.1 | 12.2 | 9.9 | 2.80 |
| 1949 | 2 981 | 64 153 | 38 062 | 26 091 | 21.5 | 12.8 | 8.8 | 2.75 |
| 1950 | 2 969 | 63 565 | 37 741 | 25 824 | 21.4 | 12.7 | 8.7 | 2.74 |
| 1951 | 2 961 | 62 878 | 42 382 | 20 496 | 21.2 | 14.3 | 6.9 | 2.69 |
| 1952 | 2 953 | 64 631 | 35 105 | 29 526 | 21.9 | 11.9 | 10.0 | 2.97 |
| 1953 | 2 949 | 62 558 | 34 591 | 27 967 | 21.2 | 11.7 | 9.5 | 2.95 |
| 1954 | 2 941 | 62 534 | 35 535 | 26 999 | 21.3 | 12.1 | 9.2 | 3.18 |
| 1955 | 2 921 | 61 622 | 36 761 | 24 861 | 21.1 | 12.6 | 8.5 | 3.28 |
| 1956 | 2 898 | 60 740 | 33 910 | 26 830 | 21.0 | 11.7 | 9.3 | 3.41 |
| 1957 | 2 885 | 61 242 | 34 311 | 26 931 | 21.2 | 11.9 | 9.3 | 3.52 |
| 1958 | 2 853 | 59 510 | 34 248 | 25 262 | 20.9 | 12.0 | 8.9 | 3.43 |
| 1959 | 2 846 | 60 188 | 34 243 | 25 945 | 21.1 | 12.0 | 9.1 | 3.63 |
| 1960 | 2 832 | 60 735 | 32 660 | 28 075 | 21.4 | 11.5 | 9.9 | 3.78 |
| 1961 | 2 818 | 59 825 | 34 763 | 25 062 | 21.2 | 12.3 | 8.9 | 3.78 |
| 1962 | 2 830 | 61 782 | 33 838 | 27 944 | 21.8 | 12.0 | 9.9 | 3.92 |
| 1963 | 2 850 | 63 246 | 33 795 | 29 451 | 22.2 | 11.9 | 10.3 | 4.01 |
| 1964 | 2 864 | 64 072 | 32 630 | 31 442 | 22.4 | 11.4 | 11.0 | 4.07 |
| 1965 | 2 876 | 63 525 | 33 022 | 30 503 | 22.1 | 11.5 | 10.6 | 4.04 |
| 1966 | 2 884 | 62 215 | 35 113 | 27 102 | 21.6 | 12.2 | 9.4 | 3.95 |
| 1967 | 2 900 | 61 307 | 31 400 | 29 907 | 21.1 | 10.8 | 10.3 | 3.84 |
| 1968 | 2 913 | 61 004 | 33 157 | 27 847 | 20.9 | 11.4 | 9.6 | 3.77 |
| 1969 | 2 926 | 62 912 | 33 734 | 29 178 | 21.5 | 11.5 | 10.0 | 3.83 |
| 1970 | 2 950 | 64 382 | 33 686 | 30 696 | 21.8 | 11.4 | 10.4 | 3.85 |
| 1971 | 2 978 | 67 551 | 31 890 | 35 661 | 22.7 | 10.7 | 12.0 | 3.97 |
| 1972 | 3 024 | 68 527 | 34 381 | 34 146 | 22.7 | 11.4 | 11.3 | 3.93 |
| 1973 | 3 073 | 68 713 | 34 192 | 34 521 | 22.4 | 11.1 | 11.2 | 3.78 |
| 1974 | 3 124 | 68 907 | 34 921 | 33 986 | 22.1 | 11.2 | 10.9 | 3.64 |
| 1975 | 3 177 | 67 178 | 33 173 | 34 005 | 21.1 | 10.4 | 10.7 | 3.43 |
| 1976 | 3 228 | 67 718 | 34 043 | 33 675 | 21.0 | 10.5 | 10.4 | 3.35 |
| 1977 | 3 272 | 68 892 | 33 632 | 35 260 | 21.1 | 10.3 | 10.8 | 3.31 |
| 1978 | 3 314 | 70 299 | 33 794 | 36 505 | 21.2 | 10.2 | 11.0 | 3.27 |
| 1979 | 3 368 | 72 539 | 33 771 | 38 768 | 21.5 | 10.0 | 11.5 | 3.26 |
| 1980 | 3 401 | 74 064 | 33 472 | 40 592 | 21.8 | 9.8 | 11.9 | 3.25 |
| 1981 | 3 443 | 72 158 | 32 929 | 39 229 | 21.0 | 9.6 | 11.4 | 3.10 |
| 1982 | 3 480 | 70 843 | 32 457 | 38 386 | 20.4 | 9.3 | 11.0 | 2.98 |
| 1983 | 3 504 | 67 117 | 32 076 | 35 041 | 19.2 | 9.2 | 10.0 | 2.76 |
| 1984 | 3 529 | 64 062 | 32 154 | 31 908 | 18.2 | 9.1 | 9.0 | 2.57 |
| 1985 | 3 540 | 62 388 | 33 213 | 29 175 | 17.6 | 9.4 | 8.2 | 2.48 |
| 1986 | 3 541 | 61 620 | 33 630 | 27 990 | 17.4 | 9.5 | 7.9 | 2.44 |
| 1987 | 3 547 | 58 433 | 31 413 | 27 020 | 16.5 | 8.9 | 7.6 | 2.31 |
| 1988 | 3 531 | 54 600 | 31 580 | 23 020 | 15.5 | 8.9 | 6.5 | 2.17 |
| 1989 | 3 510 | 52 018 | 32 111 | 19 907 | 14.8 | 9.1 | 5.7 | 2.08 |
| 1990 | 3 506 | 52 954 | 31 370 | 21 584 | 15.1 | 8.9 | 6.2 | 2.12 |
| 1991 | 3 526 | 52 718 | 31 305 | 21 413 | 15.0 | 8.9 | 6.1 | 2.09 |
| 1992 | 3 555 | 51 089 | 30 931 | 20 158 | 14.4 | 8.7 | 5.7 | 1.99 |
| 1993 | 3 574 | 49 304 | 32 148 | 17 156 | 13.8 | 9.0 | 4.8 | 1.91 |
| 1994 | 3 586 | 48 255 | 30 948 | 17 307 | 13.5 | 8.6 | 4.8 | 1.85 |
| 1995 | 3 601 | 48 530 | 31 494 | 17 036 | 13.5 | 8.7 | 4.7 | 1.86 |
| 1996 | 3 626 | 50 390 | 31 514 | 18 876 | 13.9 | 8.7 | 5.2 | 1.89 |
| 1997 | 3 664 | 52 311 | 31 605 | 20 706 | 14.3 | 8.6 | 5.7 | 1.93 |
| 1998 | 3 703 | 53 551 | 31 352 | 22 199 | 14.5 | 8.5 | 6.0 | 1.95 |
| 1999 | 3 742 | 53 354 | 31 683 | 21 671 | 14.3 | 8.5 | 5.8 | 1.90 |
| 2000 | 3 790 | 54 239 | 31 115 | 23 124 | 14.3 | 8.2 | 6.1 | 1.89 |
| 2001 | 3 847 | 57 854 | 30 212 | 27 642 | 15.0 | 7.9 | 7.2 | 1.96 |
| 2002 | 3 917 | 60 521 | 29 348 | 31 173 | 15.5 | 7.5 | 8.0 | 1.97 |
| 2003 | 3 980 | 61 529 | 29 074 | 32 455 | 15.5 | 7.3 | 8.2 | 1.99 |
| 2004 | 4 045 | 61 972 | 28 665 | 33 307 | 15.3 | 7.1 | 8.2 | 1.96 |
| 2005 | 4 134 | 61 372 | 28 260 | 33 112 | 14.8 | 6.8 | 8.0 | 1.88 |
| 2006 | 4 233 | 64 237 | 27 479 | 36 758 | 15.2 | 6.7 | 8.5 | 1.93 |
| 2007 | 4 339 | 71 389 | 28 050 | 42 570 | 16.4 | 6.4 | 10.0 | 2.04 |
| 2008 | 4 422 | 75 173 | 28 192 | 46 873 | 17.0 | 6.3 | 10.7 | 2.14 |
| 2009 | 4 459 | 75 554 | 28 898 | 45 380 | 16.9 | 6.3 | 10.6 | 2.10 |
| 2010 | 4 470 | 73 724 | 27 122 | 46 602 | 16.5 | 6.1 | 10.4 | 2.07 |
| 2011 | 4 588 | 74 650 | 28 995 | 45 655 | 16.2 | 6.2 | 10.0 | 2.04 |
| 2012 | 4 585 | 72 225 | 28 848 | 43 377 | 15.6 | 6.4 | 9.2 | 2.01 |
| 2013 | 4 593 | 68 930 | 30 018 | 38 912 | 15.0 | 6.5 | 8.5 | 1.96 |
| 2014 | 4 615 | 67 462 | 29 095 | 38 367 | 14.6 | 6.3 | 8.3 | 1.95 |
| 2015 | 4 635 | 65 909 | 29 952 | 35 957 | 14.2 | 6.4 | 7.8 | 1.91 |
Current natural growth[15]
- Births from January-June 2015 =
 33,247
 - Births from January-June 2016 = 32,699
- Deaths from January-June 2015 =
 16,169
 - Deaths from January-June 2016 = 16,306
- Natural growth from January-June 2015 = 17,078
- Natural growth from January-June 2016 = 16,393
Demographic statistics
The following demographic statistics are from Ireland's Central Statistics Office (CSO), Eurostat and the CIA World Factbook.
Population

Figures from the CSO.[16]
- 4,581,269 (2011)
- 4,585,400 (2012 preliminary estimate)
- 4,757,976 (2016 census)
Age structure
- 0–14 years: 21.3% (male: 501,189; female: 478,401) (2011)
- 15–64 years: 67.0% (male: 1,558,196; female: 1,545,073) (2011)
- 65 years and over: 11.7% (male: 243,314; female: 292,079) (2011)

Sex ratio
- at birth: 1.07 male(s)/female
- under 15 years: 1.07 male(s)/female
- 15–64 years: 1 male(s)/female
- 65 years and over: 0.8 male(s)/female
- total population: 0.99 male(s)/female (2008)
Infant mortality rate
- total:
3.78 deaths/1,000 live births (2013)
Life expectancy at birth
- total population: 80.19 years (2011)
- male: 77.96 years (2011)
- female: 82.55 years (2011)
Total fertility rate
2.1 children born/woman (2009)[17]
HIV/AIDS
– adult prevalence rate: 0.1% (2001 est.) - people living with HIV/AIDS: 6,900 (2008 est.)
Nationality
- noun: Irishman (men), Irishwoman (women), Irish (collective plural)
- adjective: Irish
Nationalities in Ireland
Irish (including dual-Irish/other): 86.9%, UK: 2.5%, Other EU 27: 6.1%, Other Europe: 0.7%, Asia: 1.5%, Africa: 0.9%, USA: 0.2%, Other countries: 0.5%, Multiple nationality: 0.1%, Not stated: 1.2% (2011)
Below are the 20 largest immigrant groups in Ireland according to the 2011 census.
| Country of Birth | Immigrants in Ireland (2011 Census) |
|---|---|
| 122,585 | |
| 112,259 | |
| 36,683 | |
| 20,593 | |
| 17,642 | |
| 17,304 | |
| 16,986 | |
| 12,791 | |
| 11,305 | |
| 11,015 | |
| 10,896 | |
| 10,801 | |
| 9,749 | |
| 8,704 | |
| 8,034 | |
| 7,656 | |
| 6,847 | |
| 6,794 | |
| 5,451 | |
| 4,872 | |
Ethnic groups
Irish, with Norse (Scandinavian), Norman, English, French, Scottish, and Welsh, Ulster-Scots and various immigrant populations – the largest immigrant groups, with over 10,000 people, are the British, Poles, Americans, Lithuanians, Latvians, Germans, Nigerians, Indians, Pakistanis and Chinese.[18]
Ethnic (or cultural) backgrounds: White Irish: 84.5%, White Irish Travellers (awaiting official recognition of minority ethnic group status by the Irish State): 0.7%, Other White: 9.1% (total White: 94.3%), Asian: 1.9%, Black: 1.4%, Other: 0.9%, Not Stated: 1.6% (2011)[19]
Religions
Roman Catholic 84.16%, No Religion 7.63%, Church of Ireland 2.81%, Islam 1.07%, Orthodox 0.99%, Presbyterian 0.54%, Methodist 0.15% (2011). In an Irish Times Behaviour Attitudes social poll published on 15 September 2010, 32% of those surveyed said they went to a religious service more than once a week.
Geographic Population Distribution
- Urban population (areas with >1,500 people): 62.0% (2011)
- Rural population: 38.0% (2011)
Languages
English is the most commonly used language, with 94%[20] of the population calling it their mother tongue. Irish is the first official language of the state, with 11%[20] calling it their mother tongue. Irish is the main language of the Gaeltacht regions, where 96,628 people live. Shelta and Ulster Scots are also spoken by small communities. The main sign language used is Irish Sign Language.
Literacy
- definition: age 15 and over who can read and write
- total population: 99%
- male: 99%
- female: 99% (2003 est.)
See also
- Republic of Ireland Census 2011
- Republic of Ireland
- Irish diaspora
- Irish population analysis
- Ireland
- Stamp 4
Groups:
- Black people in Ireland
- Lithuanians in Ireland
- Turks in Ireland
- Polish minority in Ireland
- Roma in Ireland
References
- ↑ Census 2016 Preliminary Report
- ↑ Census.ie - Population of Ireland 1841 - 2006
- ↑ RTÉ News - Irish population to hit 6.7m by 2060
- ↑ Irish Examiner - Baby boom as Irish births reach highest level since 1982
- ↑
- ↑ IrishJournal.ie
- ↑ Irish Independent - Baby boom puts us on top of birth rate league
- ↑ Cusack, Jim (11 May 2008). "€10,000 bogus marriage offer for Latvian girls". Independent. Retrieved 15 April 2012.
- ↑ "Wanted: EU bride for marriage of convenience". Independent. 31 January 2010. Retrieved 20 April 2012.
- ↑ "Ireland/Latvia: The Golden Immigration Card". Deutsche Welle. Retrieved 20 April 2012.
- ↑ "UK-Ireland borders deal to target illegal immigrants". BBC. 20 December 2011. Retrieved 15 April 2012.
- ↑ "Visa plan targets illegal immigrants". Irish Times. Retrieved 15 April 2012.
- ↑ "Latvia calls on Ireland to tackle sham marriages". BBC. 21 November 2010. Retrieved 15 April 2012.
- ↑ http://www.cso.ie/en/statistics/birthsdeathsandmarriages/numberofbirthsdeathsandmarriages/
- ↑ "Births, Deaths and Marriages". Central Statistics Office. Central Statistics Office of the Republic of Ireland. Retrieved 1 December 2016.
- ↑ "Population and Migration Estimates" (PDF). Dublin: Central Statistics Office. 27 September 2012. p. 7. ISSN 1393-5593. Retrieved 30 October 2012.
- ↑ Central Statistics Office Ireland - Report on Vital Statistics 2009
- ↑ CSO Ireland - Persons usually resident and present in the State on Census Night (2006), classified by place of birth and age group.
- ↑ CSO Ireland This is Ireland - Highlights from the 2011 census, Part 1
- 1 2 Eurobarometer - Europeans and their languages