Demographics of Portugal
| Historical population | ||
|---|---|---|
| Year | Pop. | ±% |
| 1422 | 1,043,274 | — |
| 1527 | 1,262,376 | +21.0% |
| 1636 | 1,100,000 | −12.9% |
| 1736 | 2,143,368 | +94.9% |
| 1770 | 2,850,444 | +33.0% |
| 1776 | 3,352,310 | +17.6% |
| 1801 | 2,931,930 | −12.5% |
| 1811 | 2,876,602 | −1.9% |
| 1838 | 3,200,000 | +11.2% |
| 1849 | 3,411,454 | +6.6% |
| 1864 | 4,188,419 | +22.8% |
| 1878 | 4,550,699 | +8.6% |
| 1890 | 5,049,729 | +11.0% |
| 1900 | 5,423,132 | +7.4% |
| 1911 | 5,969,056 | +10.1% |
| 1920 | 6,032,991 | +1.1% |
| 1930 | 6,825,883 | +13.1% |
| 1940 | 7,722,152 | +13.1% |
| 1950 | 8,510,240 | +10.2% |
| 1960 | 8,851,240 | +4.0% |
| 1970 | 8,648,369 | −2.3% |
| 1981 | 9,833,041 | +13.7% |
| 1991 | 9,862,540 | +0.3% |
| 2001 | 10,356,117 | +5.0% |
| 2011 | 10,562,178 | +2.0% |
| Source: INE 2011[1][2][3] | ||
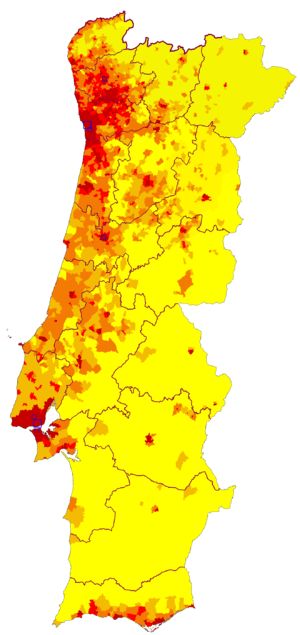
This article is about the demographic features of the population of Portugal, including population density, ethnicity, education level, health of the populace, economic status, religious affiliations and other aspects of the population.
In 2010 Portugal had 10,572,721 inhabitants.
Portugal is a fairly linguistically and religiously homogeneous country. Ethnically, the Portuguese people are mainly a combination of the proto-Celtic, Celtic and Iberian tribes, para-Celtic Lusitanians and others, with a minor amount of Roman, Germanic (Visigoths, Suevi, Vandals and Buri).
Today, many Ukrainians, Moldovans, Romanians and Bulgarians, as well as Brazilians and Venezuelans, are making Portugal their home. Portuguese is spoken throughout the country, with only the villages of Miranda do Douro's Mirandese language recognised as a locally co-official language.
Vital statistics since 1900

| [4][5][6] | Average population | Live births | Deaths | Natural change | Crude birth rate (per 1000) | Crude death rate (per 1000) | Natural change (per 1000) | Fertility rates |
|---|---|---|---|---|---|---|---|---|
| 1900 | 5 410 000 | 165 245 | 110 330 | 54 915 | 30.5 | 20.3 | 10.2 | |
| 1901 | 5 460 000 | 170 773 | 114 130 | 56 643 | 31.3 | 20.9 | 10.4 | |
| 1902 | 5 490 000 | 176 029 | 108 378 | 67 651 | 32.0 | 19.7 | 12.4 | |
| 1903 | 5 560 000 | 183 138 | 111 685 | 71 453 | 33.0 | 20.1 | 12.8 | |
| 1904 | 5 600 000 | 176 726 | 105 572 | 71 154 | 31.6 | 18.9 | 12.7 | |
| 1905 | 5 660 000 | 179 746 | 112 756 | 66 990 | 31.8 | 20.0 | 11.8 | |
| 1906 | 5 690 000 | 182 920 | 125 243 | 57 677 | 32.1 | 22.0 | 10.2 | |
| 1907 | 5 730 000 | 176 417 | 113 254 | 63 163 | 30.7 | 19.7 | 11.0 | |
| 1908 | 5 790 000 | 175 268 | 115 876 | 59 392 | 30.3 | 20.0 | 10.2 | |
| 1909 | 5 850 000 | 174 753 | 112 421 | 62 332 | 29.9 | 19.2 | 10.8 | |
| 1910 | 5 890 000 | 186 953 | 113 161 | 73 792 | 31.7 | 19.2 | 12.6 | |
| 1911 | 5 960 000 | 230 033 | 130 900 | 99 133 | 38.6 | 22.0 | 16.6 | |
| 1912 | 5 960 000 | 207 870 | 119 578 | 88 292 | 34.9 | 20.1 | 14.8 | |
| 1913 | 5 970 000 | 193 906 | 123 054 | 70 852 | 32.5 | 20.6 | 11.9 | |
| 1914 | 5 980 000 | 188 479 | 115 526 | 72 953 | 31.5 | 19.3 | 12.0 | |
| 1915 | 5 990 000 | 195 225 | 122 513 | 72 712 | 32.6 | 20.5 | 12.0 | |
| 1916 | 6 000 000 | 192 780 | 129 389 | 63 391 | 32.1 | 21.6 | 10.7 | |
| 1917 | 6 000 000 | 188 391 | 134 082 | 54 309 | 31.4 | 22.3 | 9.0 | |
| 1918 | 6 020 000 | 178 687 | 248 978 | -70 291 | 29.7 | 41.4 | -11.6 | |
| 1919 | 6 020 000 | 166 162 | 152 856 | 13 306 | 27.6 | 25.4 | 2.2 | |
| 1920 | 6 040 000 | 202 908 | 142 862 | 60 046 | 33.6 | 23.7 | 9.9 | |
| 1921 | 6 070 000 | 197 022 | 126 316 | 70 706 | 32.4 | 20.8 | 11.7 | |
| 1922 | 6 170 000 | 203 727 | 125 747 | 77 980 | 33.1 | 20.4 | 12.6 | |
| 1923 | 6 240 000 | 207 172 | 141 775 | 65 397 | 33.2 | 22.7 | 10.4 | |
| 1924 | 6 310 000 | 207 440 | 126 052 | 81 388 | 32.8 | 20.0 | 12.8 | |
| 1925 | 6 370 000 | 208 434 | 117 413 | 91 021 | 32.6 | 18.4 | 14.3 | |
| 1926 | 6 470 000 | 214 633 | 127 959 | 86 674 | 33.5 | 19.8 | 13.8 | |
| 1927 | 6 550 000 | 199 399 | 123 382 | 76 017 | 31.0 | 18.8 | 12.2 | |
| 1928 | 6 620 000 | 211 314 | 124 088 | 87 226 | 31.9 | 18.7 | 13.1 | |
| 1929 | 6 720 000 | 200 874 | 118 824 | 82 050 | 29.9 | 17.7 | 12.2 | |
| 1930 | 6 804 000 | 202 529 | 116 352 | 86 177 | 29.7 | 17.1 | 12.8 | |
| 1931 | 6 860 000 | 204 120 | 115 225 | 88 895 | 29.7 | 16.8 | 13.0 | |
| 1932 | 6 968 000 | 208 062 | 118 895 | 89 167 | 29.9 | 17.1 | 12.8 | |
| 1933 | 7 057 000 | 204 315 | 120 996 | 83 319 | 28.9 | 17.2 | 11.8 | |
| 1934 | 7 147 000 | 203 158 | 118 539 | 84 619 | 28.4 | 16.6 | 11.8 | |
| 1935 | 7 237 000 | 203 943 | 123 051 | 80 892 | 28.2 | 17.0 | 11.2 | |
| 1936 | 7 326 000 | 205 615 | 119 003 | 86 612 | 28.1 | 16.2 | 11.8 | |
| 1937 | 7 416 000 | 198 217 | 117 291 | 80 926 | 26.7 | 15.8 | 10.9 | |
| 1938 | 7 506 000 | 199 467 | 115 331 | 84 136 | 26.6 | 15.4 | 11.2 | |
| 1939 | 7 595 000 | 198 888 | 116 075 | 82 813 | 26.2 | 15.3 | 10.9 | |
| 1940 | 7 696 000 | 187 892 | 120 486 | 67 406 | 24.4 | 15.7 | 8.8 | |
| 1941 | 7 750 000 | 184 336 | 134 937 | 49 399 | 23.8 | 17.4 | 6.4 | |
| 1942 | 7 810 000 | 187 503 | 126 531 | 60 972 | 24.0 | 16.1 | 7.8 | |
| 1943 | 7 890 000 | 198 101 | 121 887 | 76 214 | 25.1 | 15.3 | 9.7 | |
| 1944 | 7 960 000 | 201 373 | 119 275 | 82 098 | 25.3 | 14.8 | 10.3 | |
| 1945 | 8 040 000 | 209 131 | 115 596 | 93 535 | 26.0 | 14.2 | 11.6 | |
| 1946 | 8 100 000 | 205 825 | 120 800 | 85 025 | 25.4 | 14.9 | 10.5 | |
| 1947 | 8 180 000 | 200 488 | 110 437 | 90 051 | 24.5 | 13.5 | 11.0 | |
| 1948 | 8 262 000 | 220 981 | 107 576 | 113 405 | 26.7 | 13.0 | 13.7 | |
| 1949 | 8 333 000 | 212 260 | 117 499 | 94 761 | 25.5 | 14.1 | 11.4 | |
| 1950 | 8 405 000 | 205 163 | 102 798 | 102 365 | 24.4 | 12.2 | 12.2 | |
| 1951 | 8 459 000 | 207 870 | 105 473 | 102 397 | 24.6 | 12.5 | 12.1 | |
| 1952 | 8 496 000 | 211 213 | 100 486 | 110 727 | 24.9 | 11.8 | 13.0 | |
| 1953 | 8 534 000 | 202 135 | 97 460 | 104 675 | 23.7 | 11.4 | 12.3 | |
| 1954 | 8 570 000 | 197 536 | 95 088 | 102 448 | 23.0 | 11.1 | 12.0 | |
| 1955 | 8 610 000 | 209 790 | 99 472 | 110 318 | 24.4 | 11.6 | 12.8 | |
| 1956 | 8 647 000 | 202 667 | 106 919 | 95 748 | 23.4 | 12.4 | 11.1 | |
| 1957 | 8 680 000 | 211 494 | 101 784 | 109 710 | 24.4 | 11.7 | 12.6 | |
| 1958 | 8 725 000 | 212 467 | 91 891 | 120 576 | 24.4 | 10.5 | 13.8 | |
| 1959 | 8 826 000 | 213 062 | 97 754 | 115 308 | 24.3 | 11.1 | 13.1 | |
| 1960 | 8 865 000 | 213 895 | 95 007 | 118 888 | 23.9 | 10.6 | 13.3 | 3,01 |
| 1961 | 8 929 000 | 217 516 | 99 590 | 117 926 | 24.3 | 11.1 | 13.2 | 3,18 |
| 1962 | 8 994 000 | 220 200 | 96 864 | 123 336 | 24.4 | 10.7 | 13.7 | 3,21 |
| 1963 | 9 031 000 | 212 152 | 98 011 | 114 141 | 23.4 | 10.8 | 12.6 | 3,08 |
| 1964 | 9 034 000 | 217 136 | 96 878 | 120 258 | 23.8 | 10.6 | 13.2 | 3,15 |
| 1965 | 8 999 000 | 210 299 | 95 187 | 115 112 | 23.0 | 10.4 | 12.6 | 3,08 |
| 1966 | 8 931 000 | 206 940 | 100 088 | 106 852 | 22.7 | 11.0 | 11.7 | 3,05 |
| 1967 | 8 875 000 | 202 061 | 95 816 | 106 245 | 22.2 | 10.5 | 11.7 | 3,00 |
| 1968 | 8 837 000 | 194 962 | 94 661 | 100 301 | 21.4 | 10.4 | 11.0 | 2,90 |
| 1969 | 8 758 000 | 189 739 | 101 088 | 88 651 | 20.9 | 11.1 | 9.7 | 2,85 |
| 1970 | 8 681 000 | 180 690 | 93 093 | 87 597 | 20.4 | 10.5 | 9.9 | 2,76 |
| 1971 | 8 644 000 | 181 243 | 98 688 | 82 555 | 21.0 | 11.4 | 9.6 | 2,80 |
| 1972 | 8 630 000 | 174 685 | 90 315 | 84 370 | 20.2 | 10.5 | 9.8 | 2,70 |
| 1973 | 8 633 000 | 172 324 | 95 435 | 76 889 | 20.0 | 11.1 | 8.9 | 2,66 |
| 1974 | 8 754 000 | 171 979 | 96 928 | 75 051 | 19.6 | 11.1 | 8.6 | 2,60 |
| 1975 | 9 094 000 | 179 648 | 97 936 | 81 712 | 19.8 | 10.8 | 9.0 | 2,52 |
| 1976 | 9 356 000 | 186 712 | 102 027 | 84 685 | 20.0 | 10.9 | 9.1 | 2,57 |
| 1977 | 9 456 000 | 181 064 | 96 111 | 84 953 | 19.2 | 10.2 | 9.0 | 2,46 |
| 1978 | 9 558 000 | 167 467 | 96 194 | 71 273 | 17.5 | 10.1 | 7.5 | 2,23 |
| 1979 | 9 661 000 | 160 311 | 92 732 | 67 579 | 16.6 | 9.6 | 7.0 | 2,11 |
| 1980 | 9 766 000 | 158 352 | 94 971 | 63 381 | 16.2 | 9.7 | 6.5 | 2,19 |
| 1981 | 9 851 000 | 152 102 | 95 892 | 56 210 | 15.4 | 9.7 | 5.7 | 2,14 |
| 1982 | 9 912 000 | 151 029 | 92 551 | 58 478 | 15.3 | 9.4 | 5.9 | 2,20 |
| 1983 | 9 958 000 | 144 327 | 96 367 | 47 960 | 14.6 | 9.7 | 4.9 | 1,97 |
| 1984 | 9 996 000 | 142 805 | 97 227 | 45 578 | 14.4 | 9.8 | 4.6 | 1,94 |
| 1985 | 10 024 000 | 130 492 | 97 339 | 33 153 | 13.2 | 9.8 | 3.3 | 1,80 |
| 1986 | 10 033 000 | 126 748 | 95 828 | 30 920 | 12.7 | 9.6 | 3.1 | 1,66 |
| 1987 | 10 030 000 | 123 218 | 95 423 | 27 795 | 12.3 | 9.5 | 2.8 | 1,61 |
| 1988 | 10 020 000 | 122 121 | 98 236 | 23 885 | 12.3 | 9.9 | 2.4 | 1,60 |
| 1989 | 10 005 000 | 118 560 | 96 220 | 22 340 | 11.9 | 9.7 | 2.2 | 1,53 |
| 1990 | 9 983 000 | 116 383 | 103 115 | 13 268 | 11.8 | 10.4 | 1.3 | 1,51 |
| 1991 | 9 960 000 | 116 415 | 104 361 | 12 054 | 11.7 | 10.5 | 1.2 | 1,43 |
| 1992 | 9 953 000 | 115 018 | 101 161 | 13 857 | 11.5 | 10.2 | 1.4 | 1,49 |
| 1993 | 9 965 000 | 114 030 | 106 384 | 7 646 | 11.4 | 10.7 | 0.8 | 1,54 |
| 1994 | 9 992 000 | 109 287 | 99 621 | 9 666 | 10.9 | 10.0 | 1.0 | 1,42 |
| 1995 | 10 026 000 | 107 184 | 103 939 | 3 245 | 10.7 | 10.4 | 0.3 | 1,37 |
| 1996 | 10 064 000 | 110 363 | 107 259 | 3 104 | 11.0 | 10.7 | 0.3 | 1,45 |
| 1997 | 10 109 000 | 113 047 | 105 157 | 7 890 | 11.2 | 10.4 | 0.8 | 1,48 |
| 1998 | 10 160 000 | 113 510 | 106 574 | 6 936 | 11.2 | 10.5 | 0.7 | 1,48 |
| 1999 | 10 218 000 | 116 038 | 108 268 | 7 770 | 11.4 | 10.7 | 0.8 | 1,49 |
| 2000 | 10 290 000 | 120 071 | 105 813 | 14 258 | 11.8 | 10.4 | 1.4 | 1,57 |
| 2001 | 10 363 000 | 112 825 | 105 582 | 7 243 | 11.0 | 10.3 | 0.7 | 1,45 |
| 2002 | 10 420 000 | 114 456 | 106 690 | 7 766 | 11.0 | 10.3 | 0.7 | 1,47 |
| 2003 | 10 459 000 | 112 589 | 109 148 | 3 441 | 10.8 | 10.5 | 0.3 | 1,44 |
| 2004 | 10 484 000 | 109 356 | 102 371 | 6 985 | 10.4 | 9.7 | 0.7 | 1,40 |
| 2005 | 10 503 000 | 109 457 | 107 839 | 1 618 | 10.4 | 10.2 | 0.2 | 1,40 |
| 2006 | 10 522 000 | 105 514 | 102 362 | 3 152 | 10.0 | 9.7 | 0.3 | 1,36 |
| 2007 | 10 543 000 | 102 567 | 103 888 | -1 321 | 9.7 | 9.8 | -0.1 | 1,33 |
| 2008 | 10 558 000 | 104 594 | 104 280 | 314 | 9.8 | 9.8 | 0.0 | 1,37 |
| 2009 | 10 568 000 | 99 491 | 104 434 | -4 943 | 9.4 | 9.8 | -0.4 | 1,32 |
| 2010 | 10 573 000 | 101 381 | 105 954 | -4 573 | 9.5 | 10.0 | -0.5 | 1,37 |
| 2011 | 10 558 000 | 97 000 | 102 500 | -5 500 | 9.2 | 9.7 | -0.5 | 1,30[7] |
| 2012 | 10 515 000 | 90 026 | 107 598 | -17 572 | 8.5 | 10.2 | -1.7 | 1,28[8] |
| 2013 | 10 457 000 | 82 787 | 106 543 | -23 756 | 7.9 | 10.2 | -2.3 | 1,21 |
| 2014 | 10 401 000 | 82 367 | 104 790 | -22 423 | 7.9 | 10.1 | -2.2 | 1,23 |
| 2015 * | 10 341 330 | 85 500 | 108 511 | -23 011 | 8.2 | 10.5 | -2.3 | 1,30 |
| 2016JA | 56 963 | 73 437 | -16 474 |
- JA = 1.1.2016 - 31.8.2016
Natural increase current[9]
- Number of births from January–August 2015 =
 55,595
 - Number of births from January–August 2016 = 57,038
- Number of deaths from January–August 2015 =
 75,149
 - Number of deaths from January–August 2016 =
 73,594
- Natural growth from January–August 2015 =
 -19,554
 - Natural growth from January–August 2016 = -16,556
Urban organization
Metropolitan areas
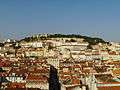
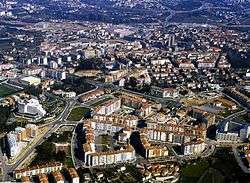
At the 2001 census, Portugal had two significant agglomerations: Lisbon Metropolitan Region 2.82 million inhabitants and Porto Metropolitan Agglomeration with 1.68 million people.[10] These broader agglomerations are distinct from the political metropolitan areas of Lisbon and Porto - Grande Área Metropolitana de Lisboa and Grande Área Metropolitana do Porto. Together they hold 43% of the total population.
| Image | City | Metropolitan area | Subregion | Core municipality |
|---|---|---|---|---|
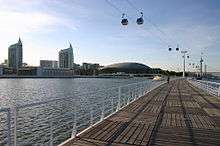 |
Lisbon | 2,815,851 million[10] | 2,042,326 | 545,245 |
 |
Porto | 1,758,531 million[10] | 1,401,805 | 237,559 |
Largest urban areas
When considering the number of inhabitants in consistent single urban areas, de facto cities in mainland Portugal, per the new with increased density of human-created structures, and excluding suburban and rural areas, Portugal has two cities with about one million inhabitants each (Lisbon and Porto), ten others with more than 50,000 inhabitants and 14 cities with populations between 20,000 and 40,000 inhabitants.[10]
- Ten largest urban areas
-
1.Lisbon and surroundings
>1 million inh.
Greater Lisbon
Lisbon Metropolitan Region -

2.Porto and surroundings
<1 million inh.
Greater Porto
Northern Urban-Metro. Region -

3.Braga
>100,000 inh. -

4.Coimbra
100,000 inh. -

5.Funchal
100,000 inh. -

6.Setúbal
100,000 inh.
Greater Lisbon
Lisbon Metropolitan Region -

7.Póvoa de Varzim-Vila
< 100,000 inh.
Greater Porto
Northern Urban-Metro. Region -

8.Aveiro
< 100,000 inh. -

9.Guimarães
< 100,000 inh.Northern Urban-Metro. Region -
10.Viseu
< 100,000 inh.
Note: the following table does not include cities in the Portuguese islands of Madeira and Azores in mid-Atlantic. Ocean.
| City | Metropolitan Area | Agglomeration |
|---|---|---|
| Cities with about 50,000 inh. (2001 Census) | ||
| Leiria | ||
| Amora | Lisbon Metropolitan Region | |
| Portimão | ||
| Faro | ||
| Évora | ||
| Cities with about 40,000 inh. (2001 Census) | ||
| Viana do Castelo | ||
| Covilhã | ||
| Castelo Branco | ||
| Santarém | Lisbon Metropolitan Region | |
| Alverca do Ribatejo | Lisbon Metropolitan Region | |
| Vila Nova de Famalicão | Northern Littoral Urban-Metropolitan Region | |
| Figueira da Foz | ||
| Guarda | ||
| Caldas da Rainha | Lisbon Metropolitan Region | |
| Olhão | ||
| Santo Tirso | Greater Porto | Northern Littoral Urban-Metropolitan Region |
| Vila Real | ||
| Póvoa de Santa Iria | Greater Lisbon | Lisbon Metropolitan Region |
Largest cities
Portugal has 151 localities with city status (cidade). Every city is included into a municipality (município). This is a list of population by city, which means that it refers to the number of inhabitants in the city proper, excluding inhabitants from the same municipality but living outside the urban area of the city in other civil parishes (freguesias) of the municipality. In some cases, the entire municipality and the city proper cover the same territory.[11]
Largest municipalities by population

Denotes the number of inhabitants in the municipality area; area is in km2; only for populations of over 100,000 inhabitants.
People
Nationality
- noun: Portuguese (singular and plural)
- adjective: Portuguese
Languages
The main language is Portuguese. Mirandês (the Mirandese language), is also recognised, and has special protection in the area of Miranda do Douro.
Immigration

In 1992, 1.3% of the population was foreign, by 2007 the number had grown to 4.1% or 435,736 people[12] this number excludes an unknown number of illegal immigrants.
Since the independence of the former African colonies, Portugal saw a steady immigration from Africa, most notably Cape Verde, Angola and Guinea-Bissau, but also São Tomé and Príncipe, Mozambique and former Portuguese India in Asia.
Portugal saw migration waves due to labor shortages since 1999, first from Eastern Europe (1999–2002), in two distinctive groups, a Slav (Ukraine, Russia and Bulgaria) and an East Latin (Romania and Moldavia), that stopped and started declining as the labour market became saturated.
Since 2003, most of the immigrants came from Brazil, China and the Indian subcontinent. Family reunification was seen as important for a successful integration in the country, thus the government eased it, and in 2006, more than 6 in 10 new immigrants were family members of legal foreign residents in the country.[13]
Other immigrant nationalities in Portugal such as Croatians, Hungarians, Nigerians, Serbians and Venezuelans are on the rise.
There is also a significant number of Western European residents in search of quality of life, namely British, German, French, and Dutch.
| The 20 largest legal immigrant communities in 2007 compared with their numbers in 1999 * : European Union citizenship | ||||
| Country of origin | Number in 1999 | Number in 2007 | Growth in percentage | |
|---|---|---|---|---|
| 20,851 | 66,354 | + 218% | ||
| 43,951 | 63,925 | + 45% | ||
| 123 | 39,480 | + 31998% | ||
| 17,721 | 32,728 | + 85% | ||
| 14,217 | 23,733 | + 67% | ||
| 13,335 | 23,608 | + 77% | ||
| 224 | 19,155 | + 8451% | ||
| 11,122 | 18,030 | + 62% | ||
| 9,605 | 15,498 | + 61% | ||
| 3 | 14,053 | + 468333% | ||
| 4,809 | 10,627 | + 121% | ||
| 6,499 | 10,556 | + 62% | ||
| 2,762 | 10,448 | + 278% | ||
| 7,975 | 8,264 | + 4% | ||
| 3,675 | 6,589 | + 79% | ||
| 2,700 | 5,985 | + 122% | ||
| 4,502 | 5,681 | + 26% | ||
| 448 | 5,114 | + 1042% | ||
| 347 | 5,028 | + 1349% | ||
| 1,211 | 4,104 | + 239% | ||
In 2008, SEF, the foreigners and borders bureau, started using a new integrated information system, incompatible with previous statistics. The foreign population grew 1% from 435,736 in 2007 to 440,277. One in four immigrants is Brazilian.[14]
| Immigrants | |
| Country of origin | Number in 2008 |
|---|---|
| 106,294 | |
| 100,000 | |
| 53,494 | |
| 51,353 | |
| 27,769 | |
| 27,619 | |
| 24,391 | |
| 14,053 | |
| Nationality appliance | |
| Previous nationality | Number in 2008 |
|---|---|
| 9,926 | |
| 8,391 | |
| 4,589 | |
| 4,463 | |
| 4,449 | |
Ethnic minorities and persons with disabilities
Anti-racism laws prohibit and penalize racial discrimination in housing, business, and health services. In 2007 approximately 332,137 legal immigrants live in the country, representing approximately 5% of the population. The country also has a resident Romani (Gypsy) population of approximately 40,000 people.
Discrimination against persons with disabilities in employment, education, access to health care, or the provision of other state services is illegal. The law mandates access to public buildings and to newly built private buildings for such persons.
Religion
The great majority of the Portuguese population belongs to the Roman Catholic Church. Religious observance remains somewhat strong in northern areas, with the population of Lisbon and southern areas generally less devout. Religious minorities include a little over 300,000 Protestants and Mormons. There are also about 50,000 Muslims and 10,000 Hindus. Most of them came from Goa, a former Portuguese colony on the west coast of India (Some Muslims also came from former Portuguese African colonies with important Muslim minorities: Guinea-Bissau, Mozambique, and São Tomé and Príncipe). There are also about 1,000 Jews. Portugal is also home to less than 10,000 Buddhists, mostly Chinese from Macau and a few Indians from Goa.
Literacy
- definition: age 15 and over can read and write
- total population: 97.0%
- male: 98.0%
- female: 96.0% (2011 est.)
Genetics
Portuguese people tend to cluster with other western european peoples, especially spaniards, north italians, french, british, among others.
Y-Dna (male lineages)
A large majority of the male lineages (85%) could be classified as belonging to three basic haplogroups, R1b, J, and E1b1b. While R1b, accounting for more than half of the lineages, is a characteristic marker of many different West European populations, haplogroups J and E1b1b and its subclades consist of lineages that are typical of the circum-Mediterranean region. Haplogroup I is also found but with a lower frequency than R1b. The typical Berber haplogroup E1b1b1b (M81) has little relevance, it is only found at a frequency of 5–6%.
| Region[16] | N | E* (M96) | E1b1a (M2) | E1b1b (M35)* | E1b1b1a (M78) | E1b1b1b (M81) | E1b1b1c (M34) | F | G (M201) | I (M170) | J1 (M167) | J2 (M172) | T (M70) | L (M61) | R1a (M173) | R1b (M269) |
| North, Center, South | 657 | 0.5 | 0.2 | 0.9 | 4.1 | 5.6 | 1.2 | 0.2 | 5.5 | 7.6 | 3.4 | 7 | 1.6 | 0.3 | 2 | 59.9 |
mtDna (female lineages)
The most frequent mtDNA haplogroup in Portugal is H, followed by U, T, and pre-V/V clades. Two haplogroups, H and U5 alone account for almost half of the individuals. About 9% of the lineages found in Portugal belong to African lineages L and U6.
| Region[17] | N | H* | H5 | HV0 | HVa | R0a | J | T1 | T2 | U1 | U2e | U3 | U4 | U5a | U5b | U7 | U8 | U* | K | N1 | N2 | X | M | U6 | L | Other |
| North | 188 | 40.4 | 2.7 | 6.9 | 0.0 | 0.0 | 4.8 | 6.4 | 7.4 | 0.0 | 0.5 | 2.1 | 2.1 | 2.7 | 3.7 | 0.0 | 0.0 | 2.7 | 3.7 | 3.2 | 3.2 | 0.0 | 0.0 | 4.3 | 3.2 | 0.0 |
| Center | 203 | 46.8 | 2.5 | 3.0 | 0.0 | 1.0 | 6.4 | 2.0 | 7.4 | 0.0 | 2.0 | 0.5 | 2.0 | 2.5 | 1.5 | 0.0 | 0.5 | 0.5 | 8.4 | 0.5 | 1.0 | 1.5 | 0.5 | 2.5 | 6.4 | 1.0 |
| South | 203 | 44.3 | 1.0 | 3.9 | 0.0 | 1.0 | 7.9 | 2.0 | 5.9 | 0.0 | 0.5 | 1.5 | 2.0 | 2.5 | 2.5 | 0.5 | 0.0 | 0.5 | 5.9 | 1.0 | 1.5 | 3.0 | 1.0 | 0.5 | 10.8 | 0.5 |
| Total | 594 | 43.9 | 2.0 | 4.5 | 0.0 | 0.7 | 6.4 | 3.4 | 6.9 | 0.0 | 1.0 | 1.3 | 2.0 | 2.5 | 2.5 | 0.2 | 0.2 | 1.2 | 6.1 | 1.5 | 1.9 | 1.5 | 0.5 | 2.4 | 6.9 | 0.5 |
CIA World Factbook demographic statistics
The following demographic statistics are from the CIA World Factbook, unless otherwise indicated.
Age structure
- 0-14 years: 16.1% (male 906,062/female 831,992)
- 15-64 years: 65.7% (male 3,548,140/female 3,538,562)
- 65 years and over: 18.1% (male 800,339/female 1,156,361) (2012 est.)
Sex ratio
- at birth: 1.07 male(s)/female
- under 15 years: 1.09 male(s)/female
- 15-64 years: 1 male(s)/female
- 65 years and over: 0.69 male(s)/female
- total population: 0.95 male(s)/female (2011 est.)
Infant mortality rate
| Year | Deaths/1,000 live births |
| 2000 | 5.5 |
| 2001 | 5.0 |
| 2002 | 5.0 |
| 2003 | 4.1 |
| 2004 | 3.8 |
| 2005 | 3.5 |
| 2006 | 3.3 |
| 2007 | 3.4 |
| 2008 | 3.3 |
| 2009 | 3.6 |
| 2010 | 2.5 |
| 2011 | |
| 2012 | 4.6 |
Life expectancy at birth
- total population: 78.7 years
- male: 75.45 years
- female: 82.16 years (2012 est.)
See also
References
- ↑ Nuno Valério (coord.), Estatísticas Históricas Portuguesas, Vol. I, pp. 33, 37 e 51. INE, 2001. (PDF: 4,18 MB)
- ↑ INE, CENSOS 2001 Resultados Definitivos, Informação à Comunicação Social, 21 October 2002.
- ↑ INE, Estimativas de População Residente, Portugal, NUTS II, NUTS III e Municípios - 2006, Informação à Comunicação Social, 03/08/2007.
- ↑ B.R. Mitchell. European historical statistics, 1750-1975.
- ↑ http://unstats.un.org/unsd/demographic/products/dyb/dybsets/1948%20DYB.pdf United nations. Demographic Yearbook 1948
- ↑ Statistics Portugal
- ↑ PRB 2011 World Population Data Sheet
- ↑ http://portuguese-american-journal.com/2012-birth-rate-negative-decreases-further-portugal/
- ↑ "Monthly Statistical Bulletin, July 2016". Instituto Nacional de Estatística. Statistics Portugal. Retrieved 24 November 2016.
- 1 2 3 4 Fernando Nunes da Silva (2005), Alta Velocidade em Portugal, Desenvolvimento Regional, CENSUR, IST
- ↑ UMA POPULAÇÃO QUE SE URBANIZA, Uma avaliação recente - Cidades, 2004 Nuno Pires Soares, Instituto Geográfico Português (Geographic Institute of Portugal)
- ↑ População Estrangeira em Território Nacional (pdf) (in Portuguese), SEF, 2008, retrieved 12 September 2008
- ↑ Imigração: Novos imigrantes legais em Portugal aumentaram 50% em 2006 - OCDE - RTP.pt
- ↑ Um em cada quatro imigrantes é de nacionalidade brasileira - Diário de Notícias
- ↑ "Census - Final results : Portugal - 2011". Statistics Portugal. 20 November 2012. Retrieved 2012-11-21.
- ↑ Beleza et al. (2006), Micro-Phylogeographic and Demographic History of Portuguese Male Lineages, Annals of Human Genetics 70: 181–194, doi:10.1111/j.1469-1809.2005.00221.x
- ↑ Achilli A, Olivieri A, Pala M, Metspalu E, Fornarino S, et al. Mitochondrial DNA variation of modern Tuscans supports the Near Eastern origin of Etruscans. Am J Hum Genet. 2007;80:759–768.