Caneggio
| Caneggio | ||
|---|---|---|
| Former municipality of Switzerland | ||
| ||
 Caneggio | ||
|
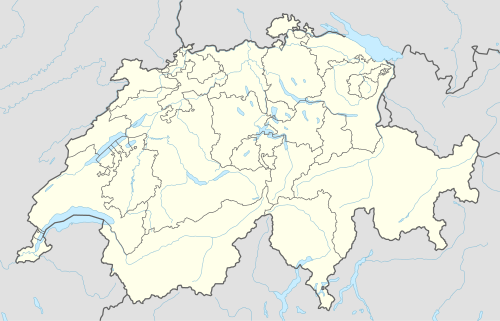
Location of Caneggio  | ||
| Coordinates: 45°52′N 9°02′E / 45.867°N 9.033°ECoordinates: 45°52′N 9°02′E / 45.867°N 9.033°E | ||
| Country | Switzerland | |
| Canton | Ticino | |
| District | Mendrisio | |
| Government | ||
| • Mayor | Giovanni Ceracchini | |
| Area | ||
| • Total | 3.53 km2 (1.36 sq mi) | |
| Elevation | 555 m (1,821 ft) | |
| Population | ||
| • Total | 337 | |
| • Density | 95/km2 (250/sq mi) | |
| Postal code | 6837 | |
| SFOS number | 5246 | |
| Surrounded by | Bruzella, Cabbio, Castel San Pietro, Cernobbio (IT-CO), Moltrasio (IT-CO), Morbio Superiore | |
| Website |
SFSO statistics | |

Caneggio is a former municipality in the district of Mendrisio in the canton of Ticino in Switzerland. On 25 October 2009 the municipalities of Bruzella, Cabbio, Caneggio, Morbio Superiore, Muggio, Sagno and Breggia merged into the municipality of Breggia[1]
History
Caneggio is first mentioned in 1209 as Canegio. In 1335 it was mentioned as Canezio.[2]
Roman era graves were discovered in Campora.[2]
The village was part of the parish of Bruzella. They separated in 1649 and Caneggio, probably in the same century, joined the parish of Balerna. The church of S. Maria Assunta is first mentioned in 1566. In 1715, it was rebuilt and renovated in 1971–75.[2]
The village had limited farming land, so the local economy was based on alpine pastures and forestry. Due to the limited land, many residents of the village emigrated to other countries. With the rise of the services sector in the second half of the 20th Century the population stabilized. The residents are now mostly commuters.[2]
Geography
Caneggio has an area, as of 1997, of 3.53 square kilometers (1.36 sq mi). Of this area, 0.26 km2 (0.10 sq mi) or 7.4% is used for agricultural purposes, while 3.46 km2 (1.34 sq mi) or 98.0% is forested. Of the rest of the land, 0.2 km2 (0.077 sq mi) or 5.7% is settled (buildings or roads), 0.04 km2 (9.9 acres) or 1.1% is either rivers or lakes.
Of the built up area, housing and buildings made up 3.1% and transportation infrastructure made up 2.5%. Out of the forested land, 95.5% of the total land area is heavily forested and 2.5% is covered with orchards or small clusters of trees. Of the agricultural land, 4.2% is used for growing crops and 3.1% is used for alpine pastures. All the water in the municipality is flowing water.[3]
The village is located in the Mendrisio district, on the left side of the Valle di Muggio. Until 2004 it included the settlement of Campora on the other side of the valley, but it is now part of Castel San Pietro.
Coat of arms
The blazon of the municipal coat of arms is Azure a brach's head couped argent.[4]
Demographics
Caneggio has a population (As of December 2004) of 337.[5]
Of the Swiss national languages (as of 2000), 18 speak German, 4 people speak French, 317 people speak Italian. The remainder (4 people) speak another language.[6]
In 2008 there were 3 live births to Swiss citizens. Ignoring immigration and emigration, the population of Swiss citizens increased by 3 while the foreign population remained the same. There was 1 non-Swiss woman who immigrated from another country to Switzerland. The total Swiss population change in 2008 (from all sources, including moves across municipal borders) was an increase of 11 and the non-Swiss population change was a decrease of 3 people. This represents a population growth rate of 2.5%.[7]
In 2000 there were 131 single-family homes (or 84.0% of the total) out of a total of 156 inhabited buildings. There were 23 multi-family buildings (14.7%), along with 1 multi-purpose buildings that were mostly used for housing (0.6%) and 1 other use buildings (commercial or industrial) that also had some housing (0.6%). Of the single-family homes 5 were built before 1919, while 6 were built between 1990 and 2000. The greatest number of single-family homes (69) were built between 1919 and 1945.[8]
In 2000 there were 190 apartments in the village. The most common apartment size was 4 rooms of which there were 60. There were 7 single room apartments and 62 apartments with five or more rooms. Of these apartments, a total of 147 apartments (77.4% of the total) were permanently occupied, while 39 apartments (20.5%) were seasonally occupied and 4 apartments (2.1%) were empty.[8]
The historical population is given in the following chart:[2][9]

Politics
In the 2007 federal election the most popular party was the CVP which received 31.33% of the vote. The next three most popular parties were the FDP (30.86%), the SP (18.26%) and the Green Party (11.4%). In the federal election, a total of 141 votes were cast, and the voter turnout was 55.7%.[10]
In the 2007 Gran Consiglio election, there were a total of 261 registered voters in Caneggio, of which 188 or 72.0% voted. The most popular party was the PLRT which received 54 or 28.7% of the vote. The next three most popular parties were; the PPD+GenGiova (with 51 or 27.1%), the SSI (with 29 or 15.4%) and the PS (with 28 or 14.9%).[11]
In the 2007 Consiglio di Stato election, 1 blank ballot was cast, leaving 187 valid ballots in the election. The most popular party was the PLRT which received 55 or 29.4% of the vote. The next three most popular parties were; the PPD (with 47 or 25.1%), the PS (with 34 or 18.2%) and the SSI (with 26 or 13.9%).[11]
Economy
There were 142 residents of the village who were employed in some capacity, of which females made up 37.3% of the workforce. In 2008's statistics the total number of full-time equivalent jobs was 33. The number of jobs in the primary sector was 3, all of which were in agriculture. The number of jobs in the secondary sector was 18, of which all were in construction. The number of jobs in the tertiary sector was 12. In the tertiary sector; 4 or 33.3% were in the sale or repair of motor vehicles, 1 or 8.3% were in the movement and storage of goods, 3 or 25.0% were in a hotel or restaurant, 2 or 16.7% were in education.[12]
In 2000, there were 16 workers who commuted into the village and 119 workers who commuted away. The village is a net exporter of workers, with about 7.4 workers leaving the village for every one entering. About 25.0% of the workforce coming into Caneggio are coming from outside Switzerland.[13]
Religion
From the 2000 census, 300 or 87.5% were Roman Catholic, while 18 or 5.2% belonged to the Swiss Reformed Church. There are 24 individuals (or about 7.00% of the population) who belong to another church (not listed on the census), and 1 individuals (or about 0.29% of the population) did not answer the question.[6]
Education
As of 2000, there were 43 students from Caneggio who attended schools outside the village.[13]
References
- ↑ Amtliches Gemeindeverzeichnis der Schweiz, Mutationsmeldungen 2009 / Répertoire officiel des communes de Suisse, Mutations 2009 / Elenco ufficiale dei Comuni della Svizzera, Mutazione 2009 (PDF) (Report). Federal Statistical Office. 2009. 2772. Archived from the original (PDF) on 18 November 2010. Retrieved 6 March 2010.
- 1 2 3 4 5 Caneggio in German, French and Italian in the online Historical Dictionary of Switzerland.
- ↑ Altitudine, superficie, secondo il genere di utilizzazione, rilevazione 1992/1997, e densità della popolazione, nel 2000 (Italian). Retrieved 25 October 2010
- ↑ Flags of the World.com. Retrieved 31-January-2011
- ↑ Bundesamt fur Statistik (Federal Department of Statistics) (2008). "Bilanz der ständigen Wohnbevölkerung (Total) nach Bezirken und Gemeinden". Retrieved 5 November 2008.
- 1 2 Popolazione residente, secondo la lingua principale e la religione, nel 2000 Archived 7 July 2011 at the Wayback Machine. (Italian). Retrieved 23 November 2010
- ↑ Swiss Federal Statistical Office – Superweb database – Gemeinde Statistics 1981–2008 Archived 28 June 2010 at the Wayback Machine. (German). Retrieved 19 June 2010
- 1 2 Federal Statistical Office STAT-TAB – Datenwürfel für Thema 09.2 – Gebäude und Wohnungen Archived 21 January 2015 at the Wayback Machine. (German). Retrieved 28 January 2011
- ↑ Swiss Federal Statistical Office STAT-TAB Bevölkerungsentwicklung nach Region, 1850–2000 Archived 30 September 2014 at the Wayback Machine. (German). Retrieved 29 January 2011
- ↑ Swiss Federal Statistical Office, Nationalratswahlen 2007: Stärke der Parteien und Wahlbeteiligung, nach Gemeinden/Bezirk/Canton Archived 14 May 2015 at the Wayback Machine. (German). Retrieved 28 May 2010
- 1 2 Elezioni cantonali: Gran Consiglio, Consiglio di Stato Archived 7 July 2011 at the Wayback Machine. (Italian). Retrieved 23 November 2010
- ↑ Swiss Federal Statistical Office STAT-TAB Betriebszählung: Arbeitsstätten nach Gemeinde und NOGA 2008 (Abschnitte), Sektoren 1–3 Archived 25 December 2014 at the Wayback Machine. (German). Retrieved 28 January 2011
- 1 2 Swiss Federal Statistical Office – Statweb (German). Retrieved 24 June 2010