British general election, 1796
| | |||||||||||||||||||||||||||||||||||
| |||||||||||||||||||||||||||||||||||
| |||||||||||||||||||||||||||||||||||
| |||||||||||||||||||||||||||||||||||

The British general election, 1796, returned members to serve in the 18th and last House of Commons of the Parliament of Great Britain to be summoned before the formation of the United Kingdom of Great Britain and Ireland on 1 January 1801. The members in office in Great Britain at the end of 1800 continued to serve in the first Parliament of the United Kingdom 1801–1802.
Political situation
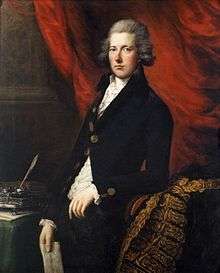
Great Britain had been at war with France since 1792. The Prime Minister since 1783, William Pitt the Younger, led a broad wartime coalition of Whig and Tory politicians.
The principal opposition to Pitt was a relatively weak faction of Whigs, led by Charles James Fox. For four years after 1797 opposition attendance at Westminster was sporadic as Fox pursued a strategy of secession from Parliament. Only a small group, led by George Tierney, had attended frequently to oppose the ministers. As Foord observes "only once did the minority reach seventy-five, and it was often less than ten".
Dates of Election
The period between the first and last returns was 25 May–29 June 1796.
Summary of the Constituencies
Key to categories in the following tables: BC - Borough/Burgh constituencies, CC - County constituencies, UC - University constituencies, Total C - Total constituencies, BMP - Borough/Burgh Members of Parliament, CMP - County Members of Parliament, UMP - University Members of Parliament.
Monmouthshire (One County constituency with two members and one single member Borough constituency) is included in Wales in these tables. Sources for this period may include the county in England.
Table 1: Constituencies and Members, by type and country
| Country | BC | CC | UC | Total C | BMP | CMP | UMP | Total Members |
|---|---|---|---|---|---|---|---|---|
| England | 202 | 39 | 2 | 243 | 404 | 78 | 4 | 486 |
| Wales | 13 | 13 | 0 | 26 | 13 | 14 | 0 | 27 |
| Scotland | 15 | 30 | 0 | 45 | 15 | 30 | 0 | 45 |
| Total | 230 | 82 | 2 | 314 | 432 | 122 | 4 | 558 |
Table 2: Number of seats per constituency, by type and country
| Country | BC×1 | BC×2 | BC×4 | CC×1 | CC×2 | UC×2 | Total C |
|---|---|---|---|---|---|---|---|
| England | 4 | 196 | 2 | 0 | 39 | 2 | 243 |
| Wales | 13 | 0 | 0 | 12 | 1 | 0 | 26 |
| Scotland | 15 | 0 | 0 | 30 | 0 | 0 | 45 |
| Total | 32 | 196 | 2 | 42 | 40 | 2 | 314 |
Sources:
(Dates of Elections) Footnote to Table 5.02 British Electoral Facts 1832-1999, compiled and edited by Colin Rallings and Michael Thrasher (Ashgate Publishing Ltd 2000).
(Types of constituencies - British Historical Facts 1760-1830, by Chris Cook and John Stevenson (The Macmillan Press 1980).
See also
References
- His Majesty's Opposition 1714-1830, by Archibald S. Foord (Oxford University Press 1964)
- British Electoral Facts 1832-1999, compiled and edited by Colin Rallings and Michael Thrasher (Ashgate Publishing Ltd 2000). (For dates of elections before 1832, see the footnote to Table 5.02).
| General elections | |
|---|---|
| |