West Rutland, Vermont
| West Rutland, Vermont | |
|---|---|
| Town | |
|
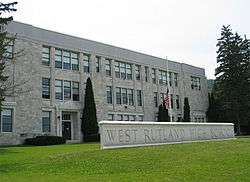
High school in West Rutland | |
 West Rutland, Vermont | |
| Coordinates: 43°35′53″N 73°3′3″W / 43.59806°N 73.05083°WCoordinates: 43°35′53″N 73°3′3″W / 43.59806°N 73.05083°W | |
| Country | United States |
| State | Vermont |
| County | Rutland |
| NECTA | Rutland |
| Chartered | 1886 |
| Area | |
| • Total | 18.0 sq mi (46.6 km2) |
| • Land | 18.0 sq mi (46.6 km2) |
| • Water | 0.0 sq mi (0.0 km2) |
| Elevation | 489 ft (149 m) |
| Population (2010) | |
| • Total | 2,326 |
| • Density | 130/sq mi (50/km2) |
| Time zone | Eastern (EST) (UTC-5) |
| • Summer (DST) | EDT (UTC-4) |
| ZIP code | 05777 |
| Area code(s) | 802 |
| FIPS code | 50-82300[1] |
| GNIS feature ID | 1462256[2] |
West Rutland is a town in Rutland County, Vermont, United States. The population was 2,326 at the 2010 census.[3] The town center, located in the south central portion of the town and where about 87% of the population resides, is defined by the U.S. Census Bureau as a census-designated place (CDP). The town is part of the Rutland micropolitan NECTA.
Local culture
West Rutland has many small businesses, many of which are found on Marble Street, the town's main street. Other businesses include Boardman Hill Farm and the Carving Studio & Sculpture Center.
The town has a small K-12 public school, West Rutland School, which students of all ages attend.
History
The town of Rutland was originally granted in 1761 as one of the New Hampshire Grants and named after Rutland, Massachusetts, the home of the first grantee, John Murrey. It was one of the most successful of those grants because of excellent farmland and gentle topography.
In 1863, there was rioting in West Rutland after the state instituted a draft.[4]
During a strike in 1868, owners evicted Irish-Catholic workers from company-owned homes, then imported dozens of French-Canadian Catholic "strikebreakers" to replace them.[5]
In the early 19th century, small high-quality marble deposits were discovered in Rutland, and in the 1830s a large deposit of nearly solid marble of high quality was found in what is now West Rutland. By the 1840s small firms had begun operations, but marble quarries only became profitable when the railroad arrived in 1851. At the same time, the famous quarries of Carrara in Tuscany, Italy, became largely unworkable because of their extreme depth, and Rutland quickly became one of the leading producers of marble in the world.

This fueled enough growth and investment that in 1886 the marble companies saw to it that when the present Rutland City was incorporated, most of the remainder of the village was split off as West Rutland and Proctor. Although the closing of the marble quarries in the area in the 1980s and 1990s cost the town many jobs, West Rutland has attracted artists and families looking for a semi-rural lifestyle. Because it is a very rural town, much of its economy is dependent on the city of Rutland.
Town center
The boundaries of the town center as defined by the U.S. Census Bureau are as follows: U.S. Route 4 and some power lines on the west; Dewey Avenue on the southwest; Ira town line on the south; the Clarendon River on the southeast; the Rutland town line on the east; the Proctor town line on the northeast and more power lines on the north and northwest. The area of the CDP is 3.7 square miles (9.6 km2), roughly 21% of the total area of the town.
Demographics
| Historical population | |||
|---|---|---|---|
| Census | Pop. | %± | |
| 1880 | 2,379 | — | |
| 1890 | 3,680 | 54.7% | |
| 1900 | 2,914 | −20.8% | |
| 1910 | 3,427 | 17.6% | |
| 1920 | 3,391 | −1.1% | |
| 1930 | 3,421 | 0.9% | |
| 1940 | 2,922 | −14.6% | |
| 1950 | 2,487 | −14.9% | |
| 1960 | 2,302 | −7.4% | |
| 1970 | 2,381 | 3.4% | |
| 1980 | 2,351 | −1.3% | |
| 1990 | 2,448 | 4.1% | |
| 2000 | 2,535 | 3.6% | |
| 2010 | 2,326 | −8.2% | |
| Est. 2014 | 2,246 | [6] | −3.4% |
| U.S. Decennial Census[7] | |||
As of the census of 2010, there were 2,326 people, 1,691 households, and 1166 families residing in the town. The population density was 72.0 people per square mile (54.7/km2). There were 1,079 housing units at an average density of 60.38/sq mi (23.31/km2). The racial makeup of the town was 96.9%% White, 0.5% African American, 0.4% Native American, 1.7% Asian, 0.04% are Pacific Islander, 0.04% from other races, and 0.8% from two or more races. 0.7% of the population were Hispanic or Latino of any race.
There were 1,021 households out of which 30.1% had children under the age of 18 living with them, 52.8% were married couples living together, 10.1% had a female householder with no husband present, and 32.8% were non-families. 25.9% of all households were made up of individuals and 12.7% had someone living alone who was 65 years of age or older. The average household size was 2.48 and the average family size was 3.00.
In the town the population was spread out with 23.8% under the age of 18, 6.6% from 18 to 24, 29.8% from 25 to 44, 24.7% from 45 to 64, and 15.1% who were 65 years of age or older. The median age was 39.0 years. For every 100 females there were 96.1 males. For every 100 females age 18 and over, there were 95.0 males.
The median income for a household in the town was $67,389, and the median income for a family was $71,955. Males had a median income of $30,962 versus $21,935 for females. The per capita income for the town was $17,325. 14.7% of the population and 11.2% of families were below the poverty line. Out of the total people living in poverty, 60.8% are under the age of 18 and 9.2% are 65 or older.
There were 913 households out of which 29.7% had children under the age of 18 living with them, 51.2% were married couples living together, 10.4% had a female householder with no husband present, and 34.2% were non-families. 27.2% of all households were made up of individuals and 13.3% had someone living alone who was 65 years of age or older. The average household size was 2.48 and the average family size was 3.03.
In the CDP the population was spread out with 24.0% under the age of 18, 7.1% from 18 to 24, 29.7% from 25 to 44, 24.6% from 45 to 64, and 14.6% who were 65 years of age or older. The median age was 39 years. For every 100 females there were 97.0 males. For every 100 females age 18 and over, there were 95.1 males.
The median income for a household in the CDP was $37,204, and the median income for a family was $41,795. Males had a median income of $30,861 versus $21,936 for females. The per capita income for the CDP was $17,144. About 6.7% of families and 11.1% of the population were below the poverty line, including 16.3% of those under age 18 and 7.3% of those age 65 or over.
Geography
West Rutland is located at 43°36′38″N 72°58′23″W / 43.61056°N 72.97306°W, at an elevation of 648 feet (198 m), all land.[8] According to the United States Census Bureau, the town has a total area of 17.87 square miles (46.3 km2). Drained by the Clarendon River, West Rutland lies between the Taconic Range and the Green Mountains.
The town is crossed by U.S. Route 4, Vermont Route 3, and Vermont Route 4A.
Climate
The Köppen Climate Classification subtype for this climate is "Dfb" (Warm Summer Continental Climate).[9] climate is "Cfb" (Marine West Coast Climate/Oceanic climate).
| Climate data for West Rutland, Vermont | |||||||||||||
|---|---|---|---|---|---|---|---|---|---|---|---|---|---|
| Month | Jan | Feb | Mar | Apr | May | Jun | Jul | Aug | Sep | Oct | Nov | Dec | Year |
| Average high °C (°F) | 30 (−1) |
33 (1) |
42 (6) |
56 (13) |
68 (20) |
77 (25) |
81 (27) |
79 (26) |
71 (22) |
60 (16) |
47 (8) |
34 (1) |
56.5 (13.7) |
| Average low °C (°F) | 11 (−12) |
12 (−11) |
22 (−6) |
33 (1) |
44 (7) |
53 (12) |
58 (14) |
56 (13) |
48 (9) |
38 (3) |
29 (−2) |
17 (−8) |
35.1 (1.7) |
| Average precipitation mm (inches) | 2.4 (61) |
2.0 (51) |
2.5 (64) |
2.8 (71) |
3.5 (89) |
3.8 (97) |
4.2 (107) |
3.8 (97) |
3.7 (94) |
3.2 (81) |
3.1 (79) |
2.5 (64) |
37.5 (953) |
| Average precipitation days | 12 | 10 | 11 | 11 | 13 | 12 | 11 | 11 | 10 | 11 | 12 | 12 | 136 |
| Source: Weatherbase [10] | |||||||||||||
Notable people
- Peter J. Hincks, Vermont State Treasurer
- Harvey H. Johnson, US congressman
- James Patrick Leamy, judge
- George E. Royce, marble company executive and state Senator
- Aldace F. Walker, member of Interstate Commerce Commission and railway president
Sites of interest
- Carving Studio & Sculpture Center
- Marble Valley Players -- West Rutland Town Hall Theater
- West Rutland Marsh
- West Rutland School
References
- ↑ "American FactFinder". United States Census Bureau. Retrieved 2008-01-31.
- ↑ "US Board on Geographic Names". United States Geological Survey. 2007-10-25. Retrieved 2008-01-31.
- ↑ "Profile of General Population and Housing Characteristics: 2010 Demographic Profile Data (DP-1): West Rutland town, Vermont". U.S. Census Bureau, American Factfinder. Retrieved November 15, 2011.
- ↑
- ↑ ""Rerum Novarum" and the Catholic Church in Vermont". Vermont Catholic. 1 (12): 21. June 2010.
- ↑ "Annual Estimates of the Resident Population for Incorporated Places: April 1, 2010 to July 1, 2014". Retrieved June 4, 2015.
- ↑ "U.S. Decennial Census". United States Census Bureau. Retrieved May 16, 2015.
- ↑ "US Gazetteer files: 2010, 2000, and 1990". United States Census Bureau. 2011-02-12. Retrieved 2011-04-23.
- ↑ Climate Summary for closest city on record
- ↑ "Weatherbase.com". Weatherbase. 2013. Retrieved on July 2, 2013.
External links
- Town of West Rutland official website
- History of Rutland
- Rutland Herald story on the closing of the quarries in 1993
Municipalities and communities of Rutland County, Vermont, United States | ||
|---|---|---|
| City | 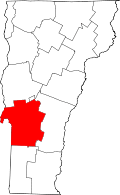 | |
| Towns | ||
| Village | ||
| CDPs | ||
| Other communities | ||