Water supply and sanitation in India
| India: Water and Sanitation | ||
|---|---|---|
 | ||
| Data | ||
| Access to improved source of water (Urban/Rural/Total) | 96%/89%/92% (2011)[1] | |
| Access to improved sanitation (Urban/Rural/Total) | 60%/24%/35% (2011) | |
| Average urban water use (liter/capita/day) | 126 (2006)[2] | |
| Average urban water and sewer bill for 20m3 | US$2 (2007)[3] | |
| Share of household metering | 55% in urban areas (1999)[4] | |
| Share of collected wastewater treated | 27% (2003)[5] | |
| Annual investment in water supply and sanitation | US$5 / capita[6] | |
| Institutions | ||
| Decentralization to municipalities | Partial | |
| National water and sanitation company | No | |
| Water and sanitation regulator | No | |
| Responsibility for policy setting | State Governments; Ministry of Housing and Urban Poverty Alleviation, Ministry of Urban Development and Ministry of Drinking Water and Sanitation at the Federal Level | |
| Sector law | No | |
| Number of urban service providers | 3,255 (1991) | |
| Number of rural service providers | about 100,000 | |

Drinking water supply and sanitation in India continue to be inadequate, despite longstanding efforts by the various levels of government and communities at improving coverage. The level of investment in water and sanitation, albeit low by international standards, has increased in size during the 2000s. Access has also increased significantly. For example, in 1980 rural sanitation coverage was estimated at 1% and reached 21% in 2008.[7][8] Also, the share of Indians with access to improved sources of water has increased significantly from 72% in 1990 to 88% in 2008.[7] At the same time, local government institutions in charge of operating and maintaining the infrastructure are seen as weak and lack the financial resources to carry out their functions. In addition, only two Indian cities have continuous water supply and according to an estimate from 2008 about 69% of Indians still lack access to improved sanitation facilities.[9]A study by WaterAid estimated as many as 157 million Indian or 41 percent of Indians living in urban areas, live without adequate sanitation. India comes top for having the greatest number of urbanites living without sanitation. India tops urban sanitation crisis, has the largest amount of urban dwellers without sanitation and the most open defecators over 41 million people.[10][11]
A number of innovative approaches to improve water supply and sanitation have been tested in India, in particular in the early 2000s. These include demand-driven approaches in rural water supply since 1999, community-led total sanitation, a public-private partnerships to improve the continuity of urban water supply in Karnataka, and the use of microcredits for water supply and sanitation in order to improve access to water and sanitation.
Access
| Urban | Rural | Total | |
|---|---|---|---|
| Improved water source | 96% | 84% | 88% |
| Improved sanitation | 54% | 21% | 31% |
In 2008, 88% of the population in India had access to an improved water source, but only 31% had access to improved sanitation. In rural areas, where 72% of India’s population lives, the respective shares are 84% for water and only 21% for sanitation. In urban areas, 96% had access to an improved water source and 54% to improved sanitation. Access has improved substantially since 1990 when it was estimated to stand at 72% for water and 18% for sanitation.[7]
In 2010, the UN estimated based on Indian statistics that 626 million people practice open defecation.[12] In June 2012 Minister of Rural Development Jairam Ramesh stated India is the world's largest "open air toilet". He also remarked that Pakistan, Bangladesh and Afghanistan have better sanitation records.[13]
According to Indian norms, access to improved water supply exists if at least 40 liters/capita/day of safe drinking water are provided within a distance of 1.6 km or 100 meter of elevation difference, to be relaxed as per field conditions. There should be at least one pump per 250 persons.
In urban areas, those that do not receive water from the piped network often have to purhchase expensive water of dubious quality from private water vendors. For example, in Delhi water trucks get water from illegal wells on the banks of the Yamuna River for 0.75 rupees per gallon (about USD 2.70/m3).[14]
Service quality
Water supply continuity

Challenges. As of 2010, only two cities in India — Trivandrum and Kota — get continuous water supply.[15] In 2005 none of the 35 Indian cities with a population of more than one million distributed water for more than a few hours per day, despite generally sufficient infrastructure. Owing to inadequate pressure people struggle to collect water even when it is available. According to the World Bank, none have performance indicators that compare with average international standards.[16] A 2007 study by the Asian Development Bank showed that in 20 cities the average duration of supply was only 4.3 hours per day. None of the 20 cities had continuous supply. The longest duration of supply was 12 hours per day in Chandigarh, and the lowest was 0.3 hours per day in Rajkot.[3] According to the results of a Service Level Benchmarking (SLB) Program carried out by the Ministry of Urban Development (MoUD) in 2006 in 28 cities, the average duration of supply was 3.3 hours per day, with a range from one hour every three days to 18 hours per day.[2] In Delhi residents receive water only a few hours per day because of inadequate management of the distribution system. This results in contaminated water and forces households to complement a deficient public water service at prohibitive 'coping' costs; the poor suffer most from this situation. For example, according to a 1996 survey households in Delhi spent an average of ₹2,182 (US$32.40) per year in time and money to cope with poor service levels.[17] This is more than two times as much as the 2001 water bill of about US$18 per year of a Delhi household that uses 20 cubic meters per month.
Achievements. Jamshedpur, a city in Jharkhand with 573,000 inhabitants, provided 25% of its residents with continuous water supply in 2009.[18] Navi Mumbai, a planned city with more than 1m inhabitants, has achieved continuous supply for about half its population as of January 2009.[19] Badlapur, another city in the Mumbai Conurbation with a population of 140,000, has achieved continuous supply in 3 out of 10 operating zones, covering 30% of its population.[20] Trivandrum, the capital of Kerala state with a population of 1,645,000 in 2011, is the largest Indian city that enjoys continuous water supply.[21]
Sanitation
Most Indians depend on on-site sanitation facilities which means mainly pit latrines in rural areas. In rural areas, the government has been promoting community-led sanitation approaches such as the Total Sanitation Campaign, with some success. In urban areas, a good practice example is the Slum Sanitation Program in Mumbai that has provided access to sanitation for a quarter million slum dwellers.[22][23] Sewerage, where available, is often in a bad state. In Delhi the sewerage network has lacked maintenance over the years and overflow of raw sewage in open drains is common, due to blockage, settlements and inadequate pumping capacities.[24] The capacity of the 17 existing wastewater treatment plants in Delhi is adequate to cater a daily production of waste water of less than 50% of the drinking water produced.[16] Of the 2.5 billion people in the world that defecate openly, some 665 million live in India, making it the country with the highest number of people who defecate in the open.[25] This has serious public health implications.
A specific Indian problem is also the (officially prohibited) "manual scavenging" which is connected to the officially banned caste system, and relates to unsafe and undignified emptying of toilets and pits, as well as handling of raw, untreated human excreta.
Environment
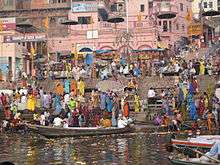
As of 2003, it was estimated that only 27% of India's wastewater was being treated, with the remainder flowing into rivers, canals, groundwater or the sea.,[5][26] For example, the sacred Ganges river is infested with diseases and in some places "the Ganges becomes black and septic. Corpses, of semi-cremated adults or enshrouded babies, drift slowly by.".[24] NewsWeek describes Delhi's sacred Yamuna River as "a putrid ribbon of black sludge" where the concentration of fecal bacteria is 10,000 times the recommended safe maximum despite a 15-year program to address the problem.[27] Cholera epidemics are not unknown.[27]
Health impact
The lack of adequate sanitation and safe water has significant negative health impacts including diarrhoea, referred to by travellers as the "Delhi Belly",[28] and experienced by about 10 million visitors annually.[29] While most visitors to India recover quickly and otherwise receive proper care. The dismal working conditions of sewer workers are another concern. A survey of the working conditions of sewage workers in Delhi showed that most of them suffer from chronic diseases, respiratory problems, skin disorders, allergies, headaches and eye infections.[30]
Water supply and water resources
Depleting ground water table and deteriorating ground water quality are threatening the sustainability of both urban and rural water supply in many parts of India. The supply of cities that depend on surface water is threatened by pollution, increasing water scarcity and conflicts among users. For example, Bangalore depends to a large extent on water pumped since 1974 from the Kaveri river, whose waters are disputed between the states of Karnataka and Tamil Nadu. As in other Indian cities, the response to water scarcity is to transfer more water over large distances at high costs. In the case of Bangalore, the ₹33.84 billion (US$502.9 million) Kaveri Stage IV project, Phase II, includes the supply of 500,000 cubic meter of water per day over a distance of 100 km, thus increasing the city's supply by two-thirds.[31][32]
In some coastal areas seawater desalination is becoming an important source of drinking water supply. For example, the Chennai Metropolitan Water Supply and Sewerage Board has put into service a first large seawater desalination plant with a capacity of 100,000 m3 per day at Minjur in 2010. A contract for a second plant with the same capacity at Nemmeli was awarded in the same year.[33]
Responsibility for water supply and sanitation
Water supply and sanitation is a State responsibility under the Indian Constitution. States may give the responsibility to the Panchayati Raj Institutions (PRI) in rural areas or municipalities in urban areas, called Urban Local Bodies (ULB). At present, states generally plan, design and execute water supply schemes (and often operate them) through their State Departments (of Public Health Engineering or Rural Development Engineering) or State Water Boards.
Highly centralised decision-making and approvals at the state level, which are characteristic of the Indian civil service, affect the management of water supply and sanitation services. For example, according to the World Bank in the state of Punjab the process of approving designs is centralised with even minor technical approvals reaching the office of chief engineers. A majority of decisions are made in a very centralised manner at the headquarters.[34] In 1993 the Indian constitution and relevant state legislations were amended in order to decentralise certain responsibilities, including water supply and sanitation, to municipalities. Since the assignment of responsibilities to municipalities is a state responsibility, different states have followed different approaches. According to a Planning Commission report of 2003 there is a trend to decentralise capital investment to engineering departments at the district level and operation and maintenance to district and gram panchayat levels.[35]
Policy and regulation
The responsibility for water supply and sanitation at the central and state level is shared by various Ministries. At the central level three Ministries have responsibilities in the sector: The Ministry of Drinking Water and Sanitation (until 2011 the Department of Drinking Water Supply in the Ministry of Rural Development) is responsible for rural water supply and sanitation; the Ministry of Housing and Urban Poverty Alleviation and the Ministry of Urban Development share the responsibility for urban water supply and sanitation. Except for the National Capital Territory of Delhi and other Union Territories, the central Ministries only have an advisory capacity and a limited role in funding. Sector policy thus is a prerogative of state governments.
National Urban Sanitation Policy. In November 2008 the government of India launched a national urban sanitation policy with the goal of creating what it calls "totally sanitized cities" that are open-defecation free, safely collect and treat all their wastewater, eliminate manual scavenging and collect and dispose solid waste safely. As of 2010, 12 states were in the process of elaborating or had completed state sanitation strategies on the basis of the policy. 120 cities are in the process of preparing city sanitation plans. Furthermore, 436 cities rated themselves in terms of their achievements and processes concerning sanitation in an effort supported by the Ministry of Urban Development with the assistance of several donors. About 40% of the cities were in the "red category" (in need of immediate remedial action), more than 50% were in the "black category" (needing considerable improvement) and only a handful of cities were in the "blue category" (recovering). Not a single city was included in the "green category" (healthy and clean city). The rating serves as a baseline to measure improvements in the future and to prioritize actions. The government intends to award a prize called Nirmal Shahar Puraskar to the best sanitation performers.[36]
Service provision
Urban areas. Institutional arrangements for water supply and sanitation in Indian cities vary greatly. Typically, a state-level agency is in charge of planning and investment, while the local government (Urban Local Bodies) is in charge of operation and maintenance.[4] Some of the largest cities have created municipal water and sanitation utilities that are legally and financially separated from the local government. However, these utilities remain weak in terms of financial capacity. In spite of decentralisation, ULBs remain dependent on capital subsidies from state governments. Tariffs are also set by state governments, which often even subsidise operating costs.[37] Furthermore, when no separate utility exists, there is no separation of accounts for different activities within a municipality. Some states and cities have non-typical institutional arrangements. For example, in Rajasthan the sector is more centralised and the state government is also in charge of operation and maintenance, while in Mumbai the sector is more decentralised and local government is also in charge of planning and investment.[4] In 2012 the Delhi Jal Board contracted out operations and management in three zones of the city to private companies under performance-based contracts to reduce non-revenue water. The Vasant Vihar-Mehrauli zone is operated by SMPL Infrastructure of India, Malviya Nagar by Suez Environnement and the Nangloi zone by Veolia Environnement.[38]
Private sector participation. The private sector plays a limited, albeit recently increasing role in operating and maintaining urban water systems on behalf of ULBs. For example, the Jamshedpur Utilities & Services Company (Jusco), a subsidiary of Tata Steel, has a lease contract for Jamshedpur (Jharkhand), a management contract in Haldia (West Bengal), another contract in Mysore (Karnataka) and since 2007 a contract for the reduction of non-revenue water in parts of Bhopal (Madhya Pradhesh).[39] The French water company Veolia won a management contract in three cities in Karnataka in 2005.[40][41] In 2002 a consortium including Thames Water won a pilot contract covering 40,000 households to reduce non-revenue water in parts of Bangalore, funded by the Japan Bank for International Cooperation. The contract was scaled up in 2004.[42] The Cypriot company Hydro-Comp, with two Indian companies, won a 10-year concession contract for the city of Latur City (Maharashtra) in 2007 and an operator-consultant contract in Madurai (Tamil Nadu).[43] Furthermore, the private Indian infrastructure development company SPML is engaged in build-operate-transfer (BOT) projects, such as a bulk water supply project for Bhiwandi (Maharashtra).[44]
Rural areas. There are about a 100,000 rural water supply systems in India. At least in some states, responsibility for service provision is in the process of being partially transferred from State Water Boards and district governments to Panchayati Raj Institutions (PRI) at the block or village level (there were about 604 districts and 256,000 villages in India in 2002, according to Subdivisions of India. Blocks are an intermediate level between districts and villages). Where this transfer has been initiated, it seems to be more advanced for single-village water schemes than for more complex multi-village water schemes. Despite their professed role Panchayati Raj Institutions, play only a limited role in provision of rural water supply and sanitation as of 2006. There has been limited success in implementing decentralisation, partly due to low priority by some state governments.[34] Rural sanitation is typically provided by households themselves in the form of latrines.
Innovative approaches
A number of innovative approaches to improve water supply and sanitation have been tested in India, in particular in the early 2000s. These include community-led total sanitation, demand-driven approaches in rural water supply, a public-private partnerships to improve the continuity of urban water supply in Karnataka, and the use of microcredits in water supply and sanitation to women in order to improve access to water.
Total Sanitation Campaign
In 1999 a demand-driven and people-centered sanitation program was initiated under the name Total Sanitation Campaign (TSC) which has some similarities with Community-led total sanitation (CLTS), but is not the same. It evolved from the limited achievements of the first structured programme for rural sanitation in India, the Central Rural Sanitation Programme, which had minimal community participation. The main goal of Total Sanitation Campaign is to eradicate the practice of open defecation by 2017. Community-led total sanitation is not focused on building infrastructure, but on preventing open defecation through self-awareness and shame. In Maharashtra where the program started more than 2000 Gram Panchayats have achieved "open defecation free" status. Villages that achieve this status receive monetary rewards and high publicity under a program called Nirmal Gram Puraskar.[45][46][47]
A new sanitation campaign was launched as Swachh Bharat Abhiyan (Clean India Mission) in October 2014.
As On 18th November 2016, Total Sanitation Coverage throught India has risen to 56.98% up from 42.02% On October 2nd, 2014, the day Swachh Bharat Abhiyan was launched.[48]
Demand-driven approaches in rural water supply
Most rural water supply schemes in India use a centralised, supply-driven approach, i.e. a government institution designs a project and has it built with little community consultation and no capacity building for the community, often requiring no water fees to be paid for its subsequent operation. Since 2002 the Government of India has rolled out at the national level a program to change the way in which water and sanitation services are supported in rural areas. The program, called Swajaldhara, decentralises service delivery responsibility to rural local governments and user groups. Under the new approach communities are being consulted and trained, and users agree up-front to pay a tariff that is set at a level sufficiently high to cover operation and maintenance costs. It also includes measures to promote sanitation and to improve hygiene behaviour. The national program follows a pilot program launched in 1999.[49]
According to a 2008 World Bank study in 10 Indian states, Swajaldhara results in lower capital costs, lower administrative costs and better service quality compared to the supply-driven approach. In particular, the study found that the average full cost of supply-driven schemes is ₹38 (56.5¢ US) per cubic meter, while it is only ₹26 (38.6¢ US) per cubic meter for demand-driven schemes. These costs include capital, operation and maintenance costs, administrative costs and coping costs incurred by users of malfunctioning systems. Coping costs include travelling long distances to obtain water, standing in long queues, storing water and repairing failed systems. Among the surveyed systems that were built using supply-driven approach system breakdowns were common, the quantity and quality of water supply were less than foreseen in designs, and 30% of households did not get daily supply in summer. The poor functioning of one system sometimes leads to the construction of another system, so that about 30% of households surveyed were served by several systems. As of 2008 only about 10% of rural water schemes built in India used a demand-driven approach. Since water users have to pay lower or no tariffs under the supply-driven approach, this discourages them to opt for a demand-driven approach, even if the likelihood of the systems operating on a sustainable basis is higher under a demand-driven approach.[50]
Achieving continuous water supply in Karnataka
In the cities of Hubli, Belgaum and Gulbarga in the state of Karnataka, the private operator Veolia increased water supply from once every 2–15 days for 1–2 hours, to 24 hours per day for 180,000 people (12% of the population of the 3 cities) within 2 years (2006–2008). This was achieved by carefully selecting and ring-fencing demonstration zones (one in each city), renovating the distribution network, installing meters, introducing a well-functioning commercial system, and effective grass-roots social intermediation by an NGO, all without increasing the amount of bulk water supplied. The project, known by its acronym as KUWASIP (Karnataka Urban Water Sector Improvement Project), was supported by a US$39.5 million loan from the World Bank. It constitutes a milestone for India, where no large city so far has achieved continuous water supply. The project is expected to be scaled-up to cover the entire area of the three cities.[2][40][41]
Microcredit for water connections in Tamil Nadu
In Tiruchirapalli in Tamil Nadu, the NGO Gramalaya, established in 1987, and women self-help groups promote access to water supply and sanitation by the poor through microcredit. Among the benefits are that women can spend more time with their children, earn additional income, and sell surplus water to neighbours. This money contributes to her repayment of the WaterCredit loan. The initiative is supported by the US-based non-profit Water Partners International.[51]
The Jamshedpur Utilities and Services Company
The Jamshedpur Utilities and Services Company (JUSCO) provides water and sanitation services in Jamshedpur, a major industrial center in East India that is home to Tata Steel. Until 2004 a division of Tata Steel provided water to the city’s residents. However, service quality was poor with intermittent supply, high water losses and no metering.[18] To improve this situation and to establish good practices that could be replicated in other Indian cities, JUSCO was set up as a wholly owned subsidiary of Tata Steel in 2004.
Efficiency and service quality improved substantially over the following years. The level on non-revenue water decreased from an estimated 36% in 2005 to 10% in 2009; one quarter of residents received continuous water supply (although the average supply remained at only 7 hours per day) in 2009; the share of metered connections increased from 2% in 2007 to 26% in 2009; the number of customers increased; and the company recovered its operating costs plus a portion of capital costs. Identifying and legalising illegal connections was an important element in the reduction of non-revenue water. The utility prides itself today of the good drinking water quality provided and encourages its customers to drink from the tap. The utility also operates a wastewater treatment plant that meets discharge standards. The private utility pays salaries that are higher than civil service salaries and conducts extensive training programs for its staff. It has also installed a modern system to track and resolve customer complaints. Furthermore, it conducts independent annual customer satisfaction surveys. JUSCO’s vision is to be the preferred provider of water supply and other urban services throughout India. Together with Ranhill Malaysia it won a 25-year concession contract for providing the water supply in Haldia City, West Bengal.[18]
Efficiency of utilities
There are only limited data on the operating efficiency of utilities in India, and even fewer data on the efficiency of investments. Two indicators of operating efficiency are non-revenue water and labour productivity.
Non-revenue water. According to the results of a Service Level Benchmarking (SLB) Program carried out by the Ministry of Urban Development (MoUD) in 2006 in 28 cities, the average level of non-revenue water (NRW) was 44 percent.[2] Another study of 20 cities by the Jawaharlal Nehru National Urban Renewal Mission with the support of the Asian Development Bank showed an average level of non-revenue water (NRW) of 32%. However, 5 out of the 20 cities did not provide any data. For those that provided data there probably is a large margin of error, since only 25% of connections are metered, which makes it very difficult to estimate non-revenue water. Also, three utilities in the sample show NRW levels of less than 20%, two of which have practically no metering, which indicates that the numbers are not reliable and actual values are likely to be higher.[3] In Delhi, which was not included in the ADB study, non-revenue water stood at 53% and there were about 20 employees per 1000 connections. Furthermore, only 70% of revenue billed was actually collected.
Labour productivity. Concerning labour productivity, the 20 utilities in the sample had on average 7.4 employees per 1,000 connections, which is much higher than the estimated level for an efficient utility.[3] A survey of a larger sample of Indian utilities showed an average ratio of 10.9 employees per 1,000 connections.[4]
Tariffs, cost recovery and subsidies
Water and sewer tariffs in India are low in both urban and rural areas. In urban areas they were set at the equivalent of about US$0.10 per cubic meter in 2007 and recovered about 60% of operating and maintenance costs, with large differences between cities. Some cities such as Kolkata do not bill residential users at all. In rural areas the level of cost recovery often is even lower than in urban areas and was estimated at only 20% in rural Punjab. Subsidies were estimated at US$1.1 billion per year in the mid-1990s, accounting to 4% of all government subsidies in India. 70% of those benefiting from the subsidies are not poor.
Urban areas
Metering. Water metering is the precondition for billing water users on the basis of volume consumed. Estimates of the share of customers metered vary depending on the study quoted. According to the results of a Service Level Benchmarking (SLB) Program carried out by the Ministry of Urban Development in 2006 in 28 cities, the share of metering was 50 percent.[2] According to a 1999 survey of 300 cities about 62% of urban water customers in metropolitan areas and 50% in smaller cities are metered (average 55%). However, meters often do not work so that many "metered" customers are charged flat rates. Bangalore and Pune are among the few Indian cities that meter all their customers. Many other cities have no metering at all or meter only commercial customers.[4] Users of standposts receive water free of charge. A 2007 study of 20 cities by the Jawaharlal Nehru National Urban Renewal Mission with the support of the Asian Development Bank (ADB) showed that only 25% of customers of these utilities were metered. Most other customers paid a flat tariff independent of consumption. Some utilities, such as the one serving Kolkata, actually do not bill residential users at all.[52]
Tariff levels. According to the same ADB study the average tariff for all customers – including industrial, commercial and public customers – is ₹4.9 (7.3¢ US) per cubic meter.[3] According to a 2007 global water tariff survey by the OECD the residential water tariff for a consumption of 15 m³ was equivalent to US$0.15 per m3 in Bangalore, US$0.12 per m3 in Calcutta, US$0.11 per m3 in New Delhi and US$0.09 per m3 in Mumbai. Only Bangalore had a sewer tariff of US$0.02 per m3. The other three cities did not charge for sewerage, although the better-off tend to be the ones with access to sewers.[53]
Tariff structure. The tariff for customers that are effectively metered is typically a uniform linear tariff, although some cities apply increasing-block tariffs.[4]
Affordability. Urban water tariffs were highly affordable according to data from the year 2000. A family of five living on the poverty line which uses 20 cubic meter of water per month would spend less than 1.2% of its budget on its water bill if it had a water meter. If it did not have a water meter and was charged a flat rate, it would pay 2.0% of its budget. This percentage lies below the often used affordability threshold of 5%. However, at that time the average metered tariff was estimated at only US$0.03 per m3, or less than three times what it was estimated to be in 2007.[54] Apparently no more up-to-date estimates on the share of the average water bill in the budget of the poor are available.
Cost recovery. According to a 2007 study of 20 cities the average rate of cost recovery for operating and maintenance costs of utilities in these cities was 60%. Seven of the 20 utilities generated a cash surplus to partially finance investments. Chennai generated the highest relative surplus. The lowest cost recovery ratio was found in Indore in Madhya Pradesh, which recovered less than 20% of its operating and maintenance costs.[3] According to the results of a Service Level Benchmarking (SLB) Program carried out by the Ministry of Urban Development in 2006 in 28 cities, cost recovery was 67% on average.[2]
Delhi example. Between 2011 and 2013 Delhi Jal Board (DJB) has increased its revenues by 50 percent and reduced operating subsidies from the National Capital Territory of Delhi. It owes ₹350 billion (US$5.2 billion) in debt, but hopes that the debt will be converted into a grant. The utility focuses on improving its customer database, meter reading through hand-held devices, billing and bill collection under a new manager, Debashree Mukherjee, who took the helm of the utility in 2012.[38] As of 2004, in Delhi revenues were just sufficient to cover about 60% of operating costs of DJB; maintenance was, as a result, minimal. In the past, the Delhi utility has relied heavily on government financial support for recurrent and capital expenditures in the magnitude of ₹3 billion (US$44.6 million) per year and ₹7 billion (US$104.0 million) respectively. Accounts receivable represent more than 12 months of billing, part of it being non-recoverable.[16] The average tariff was estimated at US$0.074/m³ in 2001, compared to production costs of US$0.085/m³, the latter probably being a very conservative estimate that does not take into account capital costs.[55]
Challenges faced in attempting to increase tariffs. Even if users are willing to pay more for better services, political interests often prevent tariffs from being increased even to a small extent. An example is the city of Jabalpur where the central government and the state government financed a ₹130 million (US$1.9 million) water supply project from 2000–2004 to be operated by the Jabalpur Municipal Corporation, an entity that collected only less than half of its operational costs in revenues even before this major investment. Even so, the municipal corporation initially refused to increase tariffs. Only following pressure from the state government it reluctantly agreed to increase commercial tariffs, but not residential tariffs.[56]
Rural areas
Cost recovery in rural areas is low and a majority of the rural water systems are defunct for lack of maintenance. Some state governments subsidise rural water systems, but funds are scarce and insufficient.[57] In rural areas in Punjab, operation and maintenance cost recovery is only about 20%. On one hand, expenditures are high due to high salary levels, high power tariff and a high number of operating staff. On the other hand, revenue is paid only by the 10% of the households who have private connections. Those drawing water from public stand posts do not pay any water charges at all, although the official tariff for public stand post users is ₹15 (22.3¢ US) per month per household.[34]
Subsidies and targeting of subsidies
There are no accurate recent estimates of the level of subsidies for water and sanitation in India. It has been estimated that transfers to the water sector in India amounted to ₹54,708 million (US$813.0 million) per year in the mid-1990s, accounting for 4% of all government subsidies in India. About 98% of this subsidy is said to come from State rather than Central budgets.[58] This figure may only cover recurrent cost subsidies and not investment subsidies, which are even higher (see below). There is little targeting of subsidies. According to the World Bank, 70% of those benefiting from subsidies for public water supply are not poor, while 40% of the poor are excluded because they do not have access to public water services.[59]
Investment and financing
Investment in urban water supply and sanitation has increased during the first decade of the 21st century, not least thanks to increased central government grants made available under Jawaharlal Nehru National Urban Renewal Mission under the Congress government until 2014 and the Swachh Bharat Abhiyan (Clean India Mission) under the BJP government since 2014, alongside loans from the Housing and Urban Development Corporation.
Investment
The Eleventh Five-Year Plan (2007–2012) foresaw investments of ₹1,270.25 billion (US$18.9 billion) for urban water supply and sanitation, including urban (stormwater) drainage and solid waste management.[6]
Financing
The funding of government programmes for water supply and sanitation is shared by the central government, states and other contributors, with the share contributed by various stakeholders varying between programmes and over time. For example, as of 2016 the states pay 60% and the central government pays 40% for investments financed under the Clean India Mission and the National Rural Drinking Water Programme. Until 2015 the central government had funded 75% of the Clean India Mission.[60]
Under the 11th Plan (2007-12) 55% of the investments were to be financed by the central government, 28% by state governments, 8% by "institutional financing" such as HUDCO, 8% by external agencies and 1.5% by the private sector. Local governments were not expected to contribute to the investments. The volume of investments was expected to double to reach 0.7% of GDP. Also, it implied a shift in financing from state governments to the central government.[6] During the 9th Plan only 24% of investments were financed by the central government and 76% by state governments. Central government financing was heavily focused on water supply in rural areas.[61]
Institutions
The current system of financing water supply and sanitation is fragmented through a number of different national and state programs. This results in simultaneous implementation with different and conflicting rules in neighbouring areas. For example, in rural areas different programs undermine each other, adversely affecting demand driven approaches requiring cost sharing by users.
State budgets the major source of financing for water supply and sanitation. State Financing Corporations (SFC) play an important role in making recommendations regarding the allocation of state tax revenues between states and municipalities, criteria for grants, and measures to improve the financial position of municipalities. According to the Planning Commission, SFCs are in some cases not sufficiently transparent and/or competent, have high transactions costs, and their recommendations are sometimes not being implemented.[62] An important source of financing are loans from Housing and Urban Development Corporation Ltd (HUDCO), a Central government financial undertaking. HUDCO loans to municipal corporations need to be guaranteed by state governments. HUDCO also on-lends loans from foreign aid, including Japanese aid, to states. The Jawaharlal Nehru National Urban Renewal Mission (2005-2014) played an important role in financing urban water supply and sanitation through central government grants. However, its grants were limited to the 35 largest cities in the country and 28 other selected cities, so that most cities with less than 1 million inhabitants were not eligible to receive grants from this mission. It was replaced by the Atal Mission for Rejuvenation and Urban Transformation (AMRUT), the new government's flagship programme for urban development. In addition, in 2014 the new government announced its high-profile Swachh Bharat Abhiyan (Clean India Mission) that aims at eradicating open defecation by 2019, covering 4,041 cities and towns. The programme has received funding and technical support from the World Bank, corporations and state governments under the Sarva Shiksha Abhiyan and Rashtriya Madhyamik Shiksha Abhiyan schemes.[63] Swachh Bharat Abhiyan is expected to cost over ₹620 billion (US$9.2 billion).[64] An amount of ₹90 billion (US$1.3 billion) was allocated for the mission in 2016 Union budget of India.[65] In 2015 the government introduced a 0.5% service tax on air travel, telephony, eating out and banking to finance the Clean India Campaign.[66] A budget tracking study revealed that the shift of policy focus from water to sanitation as part of the Clean India Campaign has resulted in a cut in government spending on rural water supply. A Parliamentary Standing Committee report found that the government would be unable to achieve its 2017 target of providing 50% rural households with piped water.[67]
In 1996 Tamil Nadu introduced a public-private partnership, the Tamil Nadu Urban Development Fund (TNUDF), to channel both grants and loans to cities in the state. TNUDF has received funding from the World Bank, Japanese JICA and KfW from Germany. It also mobilizes funding from the capital market through a water and sanitation pooled fund, under which several municipalities joined together to issue a bond in the local market. TNUDF so far is the only functioning state-level fund that channels loans to ULBs in India.[68] In 2012 the state of Orissa has created an Urban Development Fund modelled on the example of Tamil Nadu.
External cooperation
In absolute terms India receives almost twice as much development assistance for water, sanitation and water resources management as any other country, according to data from the Organisation for Economic Co-operation and Development. India accounts for 13 per cent of commitments in global water aid for 2006–07, receiving an annual average of about US$830 million (€620 million), more than double the amount provided to China. India's biggest water and sanitation donor is Japan, which provided US$635 million, followed by the World Bank with US$130 million.[69][70] The annual average for 2004–06, however, was about half as much at US$448 million, of which Japan provided US$293 million and the World Bank US$87 million.[71] The Asian Development Bank and Germany are other important external partners in water supply and sanitation.
In 2003 the Indian government decided it would only accept bilateral aid from five countries (the United Kingdom, the United States, Russia, Germany and Japan). A further 22 bilateral donors were asked to channel aid through nongovernmental organisations, United Nations agencies or multilateral institutions such as the European Union, the Asian Development Bank or the World Bank.[72]
Asian Development Bank
India has increased its loans from the Asian Development Bank (ADB) since 2005 after the introduction of new financing modalities, such as the multitranche financing facility (MFF) which features a framework agreement with the national government under which financing is provided in flexible tranches for subprojects that meet established selection criteria. In 2008 four MFFs for urban development investment programs were under way in North Karnataka (US$862 million), Jammu and Kashmir (US$1,260 million), Rajasthan (US$450 million), and Uttarakhand (US$1,589 million). Included in these MFFs are major investments for the development of urban water supply and sanitation services.[73]
Germany
Germany supports access to water and sanitation in India through financial cooperation by KfW development bank and technical cooperation by GIZ. Since the early 1990s both institutions have supported watershed management in rural Maharashtra, using a participatory approach first piloted by the Social Center in Ahmednagar and that constituted a fundamental break with the previous top-down, technical approach to watershed management that had yielded little results.[74] The involvement of women in decision-making is an essential part of the project. While the benefits are mostly in terms of increased agricultural production, the project also increases availability of water resources for rural water supply.[75] In addition, GIZ actively supports the introduction of ecological sanitation concepts in India, including community toilets and decentralised wastewater systems for schools as well as small and medium enterprises. Many of these systems produce biogas from wastewater, provide fertiliser and irrigation water.[76]
Japan
As India's largest donor in the sector the Japan International Cooperation Agency (JICA) finances a multitude of projects with a focus on capital-intensive urban water supply and sanitation projects, often involving follow-up projects in the same locations.
Current projects. Projects approved between 2006 and 2009 include the Guwahati Water Supply Project (Phases I and II) in Assam, the Kerala Water Supply Project (Phased II and III), the Hogenakkal Water Supply and Fluorosis Mitigation Project (Phases I and II) in Tamil Nadu, the Goa Water Supply and Sewerage Project, the Agra Water Supply Project, the Amritsar Sewerage Project in Punjab, the Orissa Integrated Sanitation Improvement Project, and the Bangalore Water Supply and Sewerage Project (Phase II).[77]
Evaluation of past projects. An ex-post evaluation of one large program, the Urban Water Supply and Sanitation Improvement Program, showed that "some 60%–70% of the goals were achieved" and that "results were moderate". The program was implemented by the Housing and Urban Development Corporation, Ltd. (HUDCO) from 1996 to 2003 in 26 cities. The evaluation says that "state government plans were not based on sufficient demand research, including the research for residents' willingness to pay for services", so that demand for connections was overestimated. Also fees (water tariffs) were rarely increased despite recommendations to increase them. The evaluation concludes that "HUDCO was not able to make significant contributions to the effectiveness, sustainability, or overall quality of individual projects. One of the reasons that not much attention was given to this problem is probably that there was little risk of default on the loans thanks to state government guarantees."[78]
World Bank
Current projects. The World Bank finances a number of projects in urban and rural areas that are fully or partly dedicated to water supply and sanitation. In urban areas the World Bank supported or supports among others the USD 1.55 bn National Ganga River Basin Project approved in 2011, the Andhra Pradesh Municipal Development Project (approved in 2009, US$300 million loan), the Karnataka Municipal Reform Project (approved in 2006, US$216 million loan), the Third Tamil Nadu Urban Development Project (approved in 2005, US$300 million loan) and the Karnataka Urban Water Sector Improvement Project (approved in 2004, US$39.5 million loan). In rural areas it supports the Andhra Pradesh Rural Water Supply and Sanitation (US$150 million loan, approved in 2009), the Second Karnataka Rural Water Supply and Sanitation Project (approved in 2001, US$151.6 million loan), the Uttarakhand Rural Water Supply and Sanitation Project (approved in 2006, US$120 million loan) and the Punjab Rural Water Supply and Sanitation Project (approved in 2006, US$154 million loan).[79]
Evaluation of past projects. A study by the World Bank's independent evaluation department evaluated the impact of the World Bank-supported interventions in the provision of urban water supply and wastewater services in Mumbai between 1973 and 1990. It concluded that water supply and sewerage planning, construction and operations in Bombay posed daunting challenges to those who planned and implemented the investment program. At the outset, there was a huge backlog of unmet demand because of underinvestment. Population and economic growth accelerated in the following decades and the proportion of the poor increased as did the slums which they occupied. The intended impacts of the program have not been realised. Shortcomings include that "water is not safe to drink; water service, especially to the poor, is difficult to access and is provided at inconvenient hours of the day; industrial water needs are not fully met; sanitary facilities are too few in number and often unusable; and urban drains, creeks and coastal waters are polluted with sanitary and industrial wastes."[80]
See also
- Cleanest cities in India
- List of water supply and sanitation by country
- Water pollution in India
- Swachh Bharat Abhiyan
References
- ↑ WHO & UNICEF Joint Monitoring Programme - table
- 1 2 3 4 5 6 World Bank Water and Sanitation Program (WSP): (September 2010). "The Karnataka Urban Water Sector Improvement Project: 24x7 Water Supply is Achievable" (PDF). Retrieved 20 August 2012.
- 1 2 3 4 5 6 Asian Development Bank:2007 Benchmarking and Data Book of Water Utilities in India, 2007, p. 3
- 1 2 3 4 5 6 National Institute of Urban Affairs: Status of Water Supply, Sanitation and Solid Waste Management, 2005, p. xix–xxvi. The evaluation is based on a survey of all 23 metropolitan cities in India (cities with more than 1 million inhabitants) and a representative sample of 277 smaller cities with an aggregate population of 140 million. The survey was carried out in 1999.
- 1 2 GTZ:ECOLOGICAL SANITATION – A NEED OF TODAY! PROGRESS OF ECOSAN IN INDIA, 2006, p. 3. This figure refers to 921 Class I Cities and Class II Towns in 2003–04.
- 1 2 3 Planning Commission (India):DRAFT REPORT OF THE STEERING COMMITTEE ON URBAN DEVELOPMENT FOR ELEVENTH FIVE YEAR PLAN (2007–2012), 2007. Retrieved 15 April 2010.
- 1 2 3 UNICEF/WHO Joint Monitoring Programme for Water Supply and Sanitation estimate for 2008 based on the 2006 Demographic and Health Survey, the 2001 census, other data and the extrapolation of previous trends to 2010.
- ↑ Planning Commission of India. "Health and Family Welfare and AYUSH : 11th Five Year Plan" (PDF). Retrieved 19 September 2010., p. 78
- ↑ State of Urban Services in India's Cities: Spending and Financing
- ↑ "The State of the World's Toilet 2016" (PDF). Retrieved 27 November 2016.
- ↑ "Overflowing Cities: 157 Million Indians Still Without Toilets". Retrieved 27 November 2016.
- ↑ UNICEF/WHO Joint Monitoring Programme for Water Supply and Sanitation:JMP tables, retrieved on 28 June 2012
- ↑ The Telegraph:India the world's largest open air toilet, 25 June 2012, retrieved on 28 June 2012. According to JMP data for 2010 the share of people defecating in the open was 64% in Nepal, 63% in India, 37% in Pakistan, 29% in Afghanistan and 20% in Bangladesh. According to these figures, the statement by Jairam Ramesh is correct except for Nepal.
- ↑ Sethi, Aman. "At the Mercy of the Water Mafia, Foreign Policy, July/August 2015". Retrieved 11 October 2015.
- ↑ quoting V Srinivasa Chary, director, Centre for Energy, Environment, Urban Governance and Infrastructure Development at the Administrative Staff College of India, Hyderabad. (23 March 2010). "'Only 2 Indian cities have continuous water supply'". Business Standard. Retrieved 24 August 2013.
- 1 2 3 World Bank:Delhi Water Supply & Sewerage Project, Project Information Document Concept Stage, 15 March 2006 Archived 17 October 2008 at the Wayback Machine.
- ↑ Marie Helene Zerah: Unreliable supply in Delhi, Delhi 2000
- 1 2 3 Asian Development Bank:Every Drop Counts. Learning from good practices in eight Asian cities, 2010, accessed on 26 September 2010
- ↑ Comment by David Foster, Senior Urban Advisor at The Administrative Staff College of India, as part of the LinkedIn discussion on "What are the most serious barriers to providing Continuously Pressurized (24/7) Water Supply?", 11 April 2009,
- ↑ Dr. Sanjay and V. Dahasahasra, Maharashtra Jeevan Pradhikaran:A model for transforming an intermittent into a 24/7 water supply system, August 2007
- ↑ National Institute of Urban Affairs: Status of Water Supply, Sanitation and Solid Waste Management, 2005, p. 28
- ↑ "Water Supply & Sanitation – Reaching the Poor Through Sustainable Partnerships: The Slum Sanitation Program in Mumbai, India". Retrieved 29 July 2015.
- ↑ Mumbai Slum: Dharavi, National Geographic, May 2007
- 1 2 "A special report on India: Creaking, groaning: Infrastructure is India's biggest handicap". The Economist. 11 December 2008.
- ↑ Betwa Sharma. "665 million Indians still defecate in open: UN". Rediff news. Retrieved 19 September 2010.
- ↑ Using shame to change sanitary habits, Los Angeles Times, 6 September 2007 Archived 5 May 2009 at the Wayback Machine.
- 1 2 SPECIAL REPORT: Putrid Rivers Of Sludge: Delhi's bureaucrats bicker over cholera and the role of city drains and state sewers. NewsWeek on 7–14 July 2008 issue
- ↑ John P. Cunha, DO, FACOEP. "Travelers' Diarrhea: Learn About Antibiotics and Treatment". MedicineNet. Retrieved 29 July 2015.
- ↑ http://www.fullstopindia.com/2010/01/10-ways-to-avoid-travelers-diarrhea-in-india/
- ↑ Survey by Dr Ashish Mittal, reported by Rupa Jha for the BBC on 7 February 2009 'My life cleaning Delhi's sewers'
- ↑ Projects Monitor:Stage-IV of Cauvery water supply scheme underway, 17 August 2009
- ↑ Bangalore Water Supply and Sanitation Board:Water Sources. Retrieved 28 August 2009.
- ↑ Global Water Intelligence: Chennai to get more desal after Nemmeli award, 7 January 2010
- 1 2 3 World Bank:Punjab Rural Water Supply and Sanitation Project, Project Appraisal Document , 2006, Annex 1
- ↑ Planning Commission:India Water Supply and Sanitation Assessment 2002, a WHO-UNICEF sponsored study, 2003, p. 23-26
- ↑ Water and Sanitation Program (2010). "New Sanitation Award Creates Healthy Competition Among Indian Cities". Retrieved 21 August 2012.
- ↑ 10th Plan, p. 613
- 1 2 "Delhi Jal Board focuses on its finances". Global Water Intelligence. October 2013. Retrieved 27 December 2013.
- ↑ The Financial Express: Jusco reaches Bhopal, aims for other cities under JNURM, 25 August 2007
- 1 2 World Bank:Introducing 24/7 water supply – Challenges in three cities in Karnataka, India. Retrieved 29 March 2009.
- 1 2 World Bank: Karnataka Urban Water Sector Improvement Project. Retrieved 29 March 2009.
- ↑ The Hindu Business Line: Bangalore water board upbeat on project to plug leakage. Retrieved 29 March 2009.
- ↑ The Latur water supply project is replicable across India, Interview with Ashok Natarajan, Managing Director of Hydro Comp Enterprises, 1 March 2009
- ↑ Dealcurry.com:SPML Infra To Raise PE Funding For Bhiwandi Water Project, 21 June 2010
- ↑ IRC:India: Unrealistic approach hampers rural sanitation programme, 1 June 2007
- ↑ Institute of Development Studies:Community-led total sanitation:India
- ↑ Benny George:Nirmal Gram Puraskar: A Unique Experiment in Incentivising Sanitation Coverage in Rural India, International Journal of Rural Studies (IJRS), Vol. 16, No. 1, April 2009
- ↑ Swachh Bharat Abhiyan Report Stats, 18 November 2016
- ↑ Ministry of Rural Development, Department of Drinking Water Supply:Swajaldhara, updated on 31 March 2009. Retrieved 15 April 2010.
- ↑ World Bank:Inefficiency of Rural Water Supply Schemes in India, Smita Misra, 2008
- ↑ Water Partners International:Mrs. Manonmani's Story Archived 16 June 2008 at the Wayback Machine.
- ↑ Asian Development Bank:Benchmarking and Data Book of Water Utilities in India, 2007, p. 9
- ↑ OECD/Global Water Intelligence Water Tariff Survey 2007, quoted in Peter Gleick:The World's Water 2008–2009, p. 321-322
- ↑ National Institute of Urban Affairs (NIUA), 2002, Status of Water Supply, Sanitation and Solid Waste Management in Urban India, quoted in: World Bank/PPIAF/Water and Saniation Program/World Bank Institute:Water Tariffs and Subsidies in South Asia: A Scorecard for India, 2002, p. 7-8
- ↑ Delhi ADB 2001 The same source estimates the working ratio at 2.45, which implies that current revenues must be less than half of recurrent costs
- ↑ Global Water Partnership:Malay Raj MukerjeeIndia: Issues in introducing a realistic water pricing regime in urban local bodies
- ↑ Planning Commission:10th Plan, p. 604
- ↑ Srivastava, D.K. and Sen, T.K. (1997), Government Subsidies in India, National Institute of Public Finance and Policy, New Delhi, quoted in: World Bank/PPIAF/Water and Sanitation Program/World Bank Institute:Water Tariffs and Subsidies in South Asia: A Scorecard for India, 2002, p. 8
- ↑ World Bank/PPIAF/Water and Sanitation Program/World Bank Institute:Water Tariffs and Subsidies in South Asia: A Scorecard for India, 2002, p. 12
- ↑ "Tracking Policy and Budgetary Commitments for Drinking Water and Sanitation: A Study of Select States" (PDF). Centre for Budget and Governance Accountability (CBGA). January 2016. Retrieved 28 July 2016.
- ↑ Planning Commission of India:India Assessment 2002, Water Supply and Sanitation, a WHO-UNICEF sponsored study, 2003, p. 51-53
- ↑ Planning Commission:10th Plan (2002–2007), p. 611
- ↑ "Swachh Bharat Abhiyaan: Government builds 7.1 lakh toilets in January". timesofindia-economictimes.
- ↑ "PM Modi's 'Swachh Bharat Abhiyan' set for mega launch Thursday; schools, offices gear up for event". Zee News.
- ↑ "Budget 2016: Swachh Bharat Abhiyan gets Rs 9,000 crore", The Economic Times, 29 February 2016
- ↑ "New steps to make Swachh Bharat, or Clean India Campaign, a reality". IRC - Supporting water, sanitation and hygiene services for life. 17 December 2015. Retrieved 28 July 2016.
- ↑ Dietvorst, Cor (21 July 2016). "The decision to divert funding from water to sanitation turned sour when drought struck India.". IRC. Retrieved 28 July 2016.
- ↑ Tamil Nadu Urban Development Fund. "Water and Sanitation Pooled Fund". Retrieved 20 August 2012.
- ↑ Financial Times:India gets biggest share of aid for water and hygiene, 7 April 2009
- ↑ OECD, 2007:Measuring Aid to Water Supply and Sanitation, p. 3
- ↑ OECD:Aid to the water sector commitments, India, calculated from the following pivot table:Water focus charts: Disbursements 2004–2006
- ↑ Gareth Price, Chatham House:India’s aid dynamics: from recipient to donor?, Asia Programme Working Paper, September 2004, p. 4
- ↑ Asian Development Bank:Country Water Action: India. Testing Innovative Financing, December 2008
- ↑ In German: Interview mit Pater Hermann Bacher SJ, Jesuiten 4/2005
- ↑ KfW:Project – Erosion Protection in India. Getting Women Involved in Decision-Making Processes, June 2009
- ↑ GTZ:Sustainable Sanitation in India. Examples from Indo-German Development Cooperation, November 2008
- ↑ JICA:Ex-Ante Evaluation. Retrieved 18 March 2010.
- ↑ JICA:Urban Water Supply and Sanitation Improvement Program, External Evaluator: Hajime Sonoda Field Survey: September 2005. Retrieved 18 March 2010.
- ↑ "Projects - Active Projects". Retrieved 29 July 2015.
- ↑ "India - Water Supply and Waste Water Services in Bombay: First, Second and Third Bombay Water Supply and Sewerage Projects - Independent Evaluation Group (IEG) - The World Bank Group". Retrieved 29 July 2015.
External links
- World Bank:India's Water Economy:Bracing for a Turbulent Future, 2005
- Sustaining Water for All in a Changing Climate The World Bank, 2010, Case Study on water resources in Andhra Pradesh, India. pgs. 73–77.
- Comprehensive Portal on Water in India: India Water Portal
- Solution Exchange:Water Community in India
- Water and Environmental Sanitation Network India:WES-Net India
- Asian Development Bank/Jawaharlal Nehru National Urban Renewal Mission: 2007 Benchmarking and Data Book of Water Utilities in India
- World Bank:Reaching the Poor Through Sustainable Partnerships: The Slum Sanitation Program in Mumbai, India
- Jawaharlal Nehru National Urban Renewal Mission:Overview