Reaganomics
| ||
|---|---|---|
President of the United States First Term Second Term Post-Presidency
|
||
.jpg)
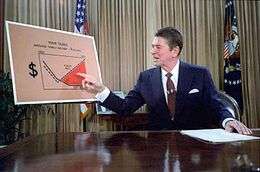
Reaganomics (/reɪɡəˈnɒmɪks/; a portmanteau of [Ronald] Reagan and economics attributed to Paul Harvey)[1] refers to the economic policies promoted by U.S. President Ronald Reagan during the 1980s. These policies are commonly associated with supply-side economics, referred to as trickle-down economics or voodoo economics by political opponents, and free-market economics by political advocates.
The four pillars of Reagan's economic policy were to reduce the growth of government spending, reduce the federal income tax and capital gains tax, reduce government regulation, and tighten the money supply in order to reduce inflation.[2]
Historical context

Prior to the Reagan administration, the United States economy experienced a decade of rising unemployment and inflation (known as stagflation). Political pressure favored stimulus resulting in an expansion of the money supply. President Richard Nixon's wage and price controls were phased out.[3] The federal oil reserves were created to ease any future short term shocks. President Jimmy Carter had begun phasing out price controls on petroleum while he created the Department of Energy. Much of the credit for the resolution of the stagflation is given to two causes: a three-year contraction of the money supply by the Federal Reserve Board under Paul Volcker, initiated in the last year of Carter's presidency,[3] and long-term easing of supply and pricing in oil during the 1980s oil glut.
In stating that his intention was to lower taxes, Reagan's approach was a departure from his immediate predecessors. Reagan enacted lower marginal tax rates as well as simplified income tax codes and continued deregulation. During Reagan's presidency, the annual deficits averaged 4.2% of GDP[4] after inheriting an annual deficit of 2.7% of GDP in 1980 under president Carter.[4] The real (inflation adjusted) rate of growth in federal spending fell from 4% under Jimmy Carter to 2.5% under Ronald Reagan. GDP per working-age adult, which had increased at only a 1.15% annual rate during the Carter administration, increased at a 1.8% rate during the Reagan administration. The increase in productivity growth was even higher: output per hour in the business sector, which had been roughly constant in the Carter years, increased at a 1.4% rate in the Reagan years.[2]
During the Nixon and Ford Administrations, before Reagan's election, a combined supply and demand side policy was considered unconventional by the moderate wing of the Republican Party. While running against Reagan for the Presidential nomination in 1980, George H. W. Bush had derided Reaganomics as "voodoo economics".[5] Similarly, in 1976, Gerald Ford had severely criticized Reagan's proposal to turn back a large part of the Federal budget to the states.
Justifications
In his 1980 campaign speeches, Reagan presented his economic proposals as a return to the free enterprise principles, free market economy that had been in favor before the Great Depression and FDR's New Deal policies. At the same time he attracted a following from the supply-side economics movement, which formed in opposition to Keynesian demand-stimulus economics. This movement produced some of the strongest supporters for Reagan's policies during his term in office.
The contention of the proponents, that the tax rate cuts would more than cover any increases in federal debt, was influenced by a theoretical taxation model based on the elasticity of tax rates, known as the Laffer curve. Arthur Laffer's model predicts that excessive tax rates actually reduce potential tax revenues, by lowering the incentive to produce; the model also predicts that insufficient tax rates (rates below the optimum level for a given economy) lead directly to a reduction in tax revenues.
Policies
Reagan lifted remaining domestic petroleum price and allocation controls on January 28, 1981,[6] and lowered the oil windfall profits tax in August 1981. He ended the oil windfall profits tax in 1988.[7] In 1982 Reagan agreed to a rollback of corporate tax cuts and a smaller rollback of individual income tax cuts. The 1982 tax increase undid a third of the initial tax cut. In 1983 Reagan instituted a payroll tax increase on Social Security and Medicare hospital insurance.[8] In 1984 another bill was introduced that closed tax loopholes. According to tax historian Joseph Thorndike, the bills of 1982 and 1984 "constituted the biggest tax increase ever enacted during peacetime".[9]
With the Tax Reform Act of 1986, Reagan and Congress sought to eliminate many deductions, reduce the highest marginal rates, and simplify the number of tax brackets.[10][11] In 1983, Democrats Bill Bradley and Dick Gephardt had offered a proposal; in 1984 Reagan had the Treasury Department produce its own plan. The eventual bipartisan 1986 act aimed to be revenue-neutral: while it reduced the top marginal rate, it also cleaned up the tax base by removing certain tax write-offs, preferences, and exceptions, thus raising the effective tax on activities previously specially favored by the code. Ultimately, the combination of the decrease in deductions and decrease in rates raised revenue equal to about 4% of existing tax revenue.[12]

The primary effect of the tax changes over the course of Reagan's term in office was a change in the composition of federal receipts, towards more payroll taxes and new investment taxes, and away from higher earners and capital gains on existing investments. Federal revenue share of GDP fell from 19.6% in fiscal 1981 to 17.3% in 1984, before rising back to 18.4% by fiscal year 1989. Personal income tax revenues fell during this period relative to GDP, while payroll tax revenues rose relative to GDP.[4] Reagan's 1981 cut in the top regular tax rate on unearned income reduced the maximum capital gains rate to only 20% – its lowest level since the Hoover administration.[13]The 1986 act set tax rates on capital gains at the same level as the rates on ordinary income like salaries and wages, with both topping out at 28%.[14]
Reagan significantly increased public expenditures, primarily the Department of Defense, which rose (in constant 2000 dollars) from $267.1 billion in 1980 (4.9% of GDP and 22.7% of public expenditure) to $393.1 billion in 1988 (5.8% of GDP and 27.3% of public expenditure); most of those years military spending was about 6% of GDP, exceeding this number in 4 different years. All these numbers had not been seen since the end of U.S. involvement in the Vietnam War in 1973.[15] In 1981, Reagan significantly reduced the maximum tax rate, which affected the highest income earners, and lowered the top marginal tax rate from 70% to 50%; in 1986 he further reduced the rate to 28%.[16] The federal deficit under Reagan peaked at 6% of GDP in 1983, falling to 3.2% of GDP in 1987[17] and to 3.1% of GDP in his final budget.[18] The inflation-adjusted rate of growth in federal spending fell from 4% under Jimmy Carter to 2.5% under Ronald Reagan; however, federal deficit as percent of GDP was up throughout the Reagan presidency from 2.7% at the end of (and throughout) the Carter administration.[2][18] As a short-run strategy to reduce inflation and lower nominal interest rates, the U.S. borrowed both domestically and abroad to cover the Federal budget deficits, raising the national debt from $997 billion to $2.85 trillion.[19] This led to the U.S. moving from the world's largest international creditor to the world's largest debtor nation.[20] Reagan described the new debt as the "greatest disappointment" of his presidency.[21]
According to William A. Niskanen, one of the architects of Reaganomics, "Reagan delivered on each of his four major policy objectives, although not to the extent that he and his supporters had hoped", and notes that the most substantial change was in the tax code, where the top marginal individual income tax rate fell from 70.1% to 28.4%, and there was a "major reversal in the tax treatment of business income", with effect of "reducing the tax bias among types of investment but increasing the average effective tax rate on new investment". Roger Porter, another architect of the program, acknowledges that the program was weakened by the many hands that changed the President's calculus, such as Congress.[2][22] President Reagan raised taxes eleven times over the course of his presidency, all in the name of fiscal responsibility,[23] but the overall tax burden went down during his presidency.[24] According to Paul Krugman, "Over all, the 1982 tax increase undid about a third of the 1981 cut; as a share of GDP, the increase was substantially larger than Mr. Clinton's 1993 tax increase."[8] According to historian and domestic policy adviser Bruce Bartlett, Reagan's tax increases over the course of his presidency took back half of the 1981 tax cut. Though since the Reagan tax reductions, top marginal tax rates have remained lower than at any point in US history since 1931, when the top marginal rate was raised from 25% to 63%.[25]
Results
Overview
Spending during Reagan's two terms (FY 1981–88) averaged 22.4% GDP, well above the 20.6% GDP average from 1971 to 2009. In addition, the public debt rose from 26% GDP in 1980 to 41% GDP by 1988. In dollar terms, the public debt rose from $712 billion in 1980 to $2.052 trillion in 1988, a roughly three-fold increase.[4]:143 The unemployment rate rose from 7% in 1980 to 11% in 1982, then declined to 5% in 1988. The inflation rate declined from 10% in 1980 to 4% in 1988.[2]
Some economists have stated that Reagan's policies were an important part of bringing about the second longest peacetime economic expansion in U.S. history.[27][28] During the Reagan administration, the American economy went from a GDP growth of -0.3% in 1980 to 4.1% in 1988 (in constant 2005 dollars), averaging 7.91% annual growth in current dollars.[29] This reduced the unemployment rate by 1.6%, from 7.1% in 1980 to 5.5% in 1988.[30][31] A net job increase of about 21 million also occurred through mid-1990. Reagan's administration is the only one not to have raised the minimum wage.[32] The inflation rate, 13.5% in 1980, fell to 4.1% in 1988, which was achieved by applying high interest rates by the Federal Reserve (peaking at 20% in June 1981).[33] The latter contributed to a relatively brief recession in late 1981 and early 1982 where unemployment rose to 9.7% and GDP fell by 1.9%.
The misery index, defined as the inflation rate added to the unemployment rate, shrank from 19.33 when he began his administration to 9.72 when he left, the greatest improvement record for a President since Harry S. Truman left office.[34] In terms of American households, the percentage of total households making less than $10,000 a year (in real 2007 dollars) shrank from 8.8% in 1980 to 8.3% in 1988 while the percentage of households making over $75,000 went from 20.2% to 25.7% during that period, both signs of progress.[35]
Unemployment rates

The job growth under the Reagan administration was an average of 2.1% per year, with unemployment averaging 7.5%. The unemployment averaged 6.4% under President Carter and 7.8% under President Ford.[36] Towards the end of his second term, however, the unemployment rate dropped to 5.4%.
Growth rates
Comparing the recovery after the 1981–82 recession (1983–90) with the prior 1970s decade, between 1971 (end of a recession) through 1980, shows that the rate of growth of real GDP per capita averaged 3.05% under Reagan versus 2.14% under Carter.[37] Following the 1981 recession, the unemployment rate had averaged slightly higher (6.75% vs. 6.35%), productivity growth lower (1.38% vs. 1.92%), and private investment as a percentage of GDP slightly less (16.08% vs. 16.86%). Real wages were lower following the recession, while real median family income grew by $4,000 during the Reagan period.[38][39] But, using data of U.S. Bureau of Economic Analysis, real U.S. GDP in 2009-chained dollars divided by the U.S. population, shows that real per-capita GDP went from $26,196.55 in the 4th quarter of 1976 to $28,447.21 4th quarter of 1980, a real increase of 8.6% during President Carter’s four years. President Reagan’s eight years in office saw per-capita GDP grow another 23.4% to $35,097.83.[40]
GDP growth
Comparing the recovery after the 1981–82 recession (1983–90) with the prior 1970s decade, between 1971 (end of a recession) through 1980, shows that the rate of growth of real GDP per capita averaged 3.05% under Reagan versus 2.14% under Carter.[38][39]
Poverty level

Wealth distribution in the United States by net worth (2007).[41] The net wealth of many people in the lowest 20% is negative because of debt.[41] By 2014 the wealth gap deepened.
During the period 1980–88, the percentage of the total population below the poverty level ranged from a low of 13.0% in 1980 and 1988 to a high of 15.2% in 1983, yet dropped 1.2% during Reagan's administration and dropped 3.3% from the high in 1983 to the low in 1988.[42] During Reagan's first term, critics noted homelessness as a visible problem in U.S. urban centers.[43] In the closing weeks of his presidency, Reagan told The New York Times that the homeless "make it their own choice for staying out there".[44] His policies became widely known as "trickle-down economics", due to the significant cuts in the upper tax brackets, as that extra money for the wealthy could trickle along to low-income groups.[45] Supporters pointed to the drop in poverty by the end of Reagan's term to validate that the tax cuts did indeed trickle down to the poor; opponents noted that the poverty rate quickly shot up even higher in the first year of his successor's term, implying that the full effect of Reagan's policies led to a net increase in poverty.[42]
Federal income tax and payroll tax levels
During the Reagan administration, federal receipts grew from $618 billion to $991 billion (an increase of 60%); while outlays grew from $746 billion to $1144 billion (an increase of 53%).[46][47] According to a 1996 report of the Joint Economic Committee of the United States Congress, during Reagan's two terms, and through 1993, the top 10% of taxpayers paid an increased share of income taxes (not including payroll taxes) to the Federal government, while the lowest 50% of taxpayers paid a reduced share of income tax revenue.[48] Personal income tax revenues declined from 9.4% GDP in 1981 to 8.3% GDP in 1989, while payroll tax revenues increased from 6.0% GDP to 6.7% GDP during the same period.[4]
Tax receipts

According to a 2003 Treasury study, the tax cuts in the Economic Recovery Tax Act of 1981 resulted in a significant decline in revenue relative to a baseline without the cuts, approximately $111 billion (in 1992 dollars) on average during the first four years after implementation or nearly 3% GDP annually.[49][50] Other tax bills had neutral or, in the case of the Tax Equity and Fiscal Responsibility Act of 1982, a (~+1% of GDP) increase in revenue as a share of GDP. It should be however noted that the study did not examine the longer-term impact of Reagan tax policy, including sunset clauses and "the long-run, fully-phased-in effect of the tax bills".[50] The fact that tax receipts as a percentage of GDP fell following the Economic Recovery Tax Act of 1981 shows a decrease in tax burden as share of GDP and a commensurate increase in the deficit, as spending did not fall relative to GDP. Total tax revenue from income tax receipts increased during Reagan's two terms, with the exception of 1982–83.[51]
The effect of Reagan's 1981 tax cuts (reduced revenue relative to a baseline without the cuts) were at least partially offset by phased in Social Security payroll tax increases that had been enacted by President Jimmy Carter and the 95th Congress in 1977, and further increases by Reagan in 1983[52] An accounting indicated nominal tax receipts increased from $599 billion in 1981 to $1.032 trillion in 1990, an increase of 72% in current dollars. In 2005 dollars, the tax receipts in 1990 were $1.5 trillion, an increase of 20% above inflation.[53] From 1991 to 2000, receipts increased by 90% in current dollars, or 60% in 2005 dollars. An analysis from the Center on Budget and Policy Priorities calculated that the average annual growth rate of real income-tax receipts per working-age person eventually rose over the two decades from 0.2% (1981–90) to 3.1% (1990–2001).[54]
Debt and government expenditures
Reagan was inaugurated in January 1981, so the first fiscal year he budgeted was 1982 and the final year was 1989.
- During Reagan's presidency, the national debt grew from $997 billion to $2.85 trillion.[19] This led to the U.S. moving from the world's largest international creditor to the world's largest debtor nation.[20] Reagan described the new debt as the "greatest disappointment" of his presidency.[21]
- The federal deficit as percentage of GDP rose from 3.8% of GDP in fiscal year 1982 to a peak of 5.9% of GDP in 1983, then fell to 2.7% GDP in 1989.[55]
- The federal government spent an average of 21.6% GDP from 1982–89, versus the 1974–1981 average of 20.3% GDP.
- Federal revenues averaged 17.5% GDP from 1982–89, versus the 1974–81 average of 17.8% GDP.
- Federal income tax revenues fell from 9.1% GDP in 1981 to a trough of 7.5% GDP in 1984, then rose to 8.0% GDP in 1989.[56]
Analysis
According to a 1996 study by the Cato Institute, a libertarian think tank,[38] on 8 of the 10 key economic variables examined, the American economy performed better during the Reagan years than during the pre- and post-Reagan years. Real median family income grew by $4,000 during the Reagan period after experiencing no growth in the pre-Reagan years; it experienced a loss of almost $1,500 in the post-Reagan years. Interest rates, inflation, and unemployment fell faster under Reagan than they did immediately before or after his presidency. The only economic variable that was lower during period than in both the pre- and post-Reagan years was the savings rate, which fell rapidly in the 1980s. The productivity rate was higher in the pre-Reagan years but lower in the post-Reagan years.[38]
Economist Stephen Moore stated in the Cato analysis, "No act in the last quarter century had a more profound impact on the U.S. economy of the eighties and nineties than the Reagan tax cut of 1981." He argued that Reagan's tax cuts, combined with an emphasis on federal monetary policy, deregulation, and expansion of free trade created a sustained economic expansion, the greatest American sustained wave of prosperity ever. He also claims that the American economy grew by more than a third in size, producing a $15 trillion increase in American wealth. Consumer and investor confidence soared. Cutting federal income taxes, cutting the U.S. government spending budget, cutting useless programs, scaling down the government work force, maintaining low interest rates, and keeping a watchful inflation hedge on the monetary supply was Ronald Reagan's formula for a successful economic turnaround.[38]
Milton Friedman stated, "Reaganomics had four simple principles: Lower marginal tax rates, less regulation, restrained government spending, noninflationary monetary policy. Though Reagan did not achieve all of his goals, he made good progress."[57] Further, the Heritage Foundation stated, "the U.S. government must allow the entrepreneur to enjoy the rewards of success. If taxes take away most profit, then the entrepreneur will have less incentive to take a risk. If there are great restrictions on how the entrepreneur can use his profit, then there is little reason for the entrepreneur to take a risk. The entrepreneur's courage to take a risk is what leads to new American discoveries and what drives the U.S. economy forward. Reaganomics knows this. It is one of the reasons why Ronald Reagan has reduced American taxes dramatically."[58]
The Tax Reform Act of 1986 and its impact on the alternative minimum tax (AMT) reduced nominal rates on the wealthy and eliminated tax deductions, while raising tax rates on lower-income individuals.[57][58][59][60] The across the board tax system reduced marginal rates and further reduced bracket creep from inflation. The highest income earners (with incomes exceeding $1,000,000) received a tax break, restoring a flatter tax system.[61] In 2006, the IRS's National Taxpayer Advocate's report characterized the effective rise in the AMT for individuals as a problem with the tax code.[62] Through 2007, the revised AMT had brought in more tax revenue than the former tax code, which has made it difficult for Congress to reform.[61][63]
Economist Paul Krugman argued the economic expansion during the Reagan administration was primarily the result of the business cycle and the monetary policy by Paul Volcker.[64] Krugman argues that there was nothing unusual about the economy under Reagan because unemployment was reducing from a high peak and that it is consistent with Keynesian economics for the economy to grow as employment increases if inflation remains low.[65]
The CBO Historical Tables indicate that federal spending during Reagan's two terms (FY 1981–88) averaged 22.4% GDP, well above the 20.6% GDP average from 1971 to 2009. In addition, the public debt rose from 26.1% GDP in 1980 to 41.0% GDP by 1988. In dollar terms, the public debt rose from $712 billion in 1980 to $2,052 billion in 1988, a three-fold increase.[4] Krugman argued in June 2012 that Reagan's policies were consistent with Keynesian stimulus theories, pointing to the significant increase in per-capita spending under Reagan.[66]
William Niskanen noted that during the Reagan years, privately held federal debt increased from 22% to 38% of GDP, despite a long peacetime expansion. Second, the savings and loan problem led to an additional debt of about $125 billion. Third, greater enforcement of U.S. trade laws increased the share of U.S. imports subjected to trade restrictions from 12% in 1980 to 23% in 1988.[2]
Economists Raghuram Rajan and Luigi Zingales pointed out that many deregulation efforts had either taken place or had begun before Reagan (note the deregulation of airlines and trucking under Carter, and the beginning of deregulatory reform in railroads, telephones, natural gas, and banking). They stated, "The move toward markets preceded the leader [Reagan] who is seen as one of their saviors."[67] Economists Paul Joskow and Roger Noll made a similar contention.[68]
Economist William A. Niskanen, a member of Reagan's Council of Economic Advisers wrote that deregulation had the "lowest priority" of the items on the Reagan agenda[2] given that Reagan "failed to sustain the momentum for deregulation initiated in the 1970s" and that he "added more trade barriers than any administration since Hoover." By contrast, economist Milton Friedman has pointed to the number of pages added to the Federal Register each year as evidence of Reagan's anti-regulation presidency (the Register records the rules and regulations that federal agencies issue per year). The number of pages added to the Register each year declined sharply at the start of the Ronald Reagan presidency breaking a steady and sharp increase since 1960. The increase in the number of pages added per year resumed an upward, though less steep, trend after Reagan left office. In contrast, the number of pages being added each year increased under Ford, Carter, George H. W. Bush, Clinton, and others.[69] The number of pages in Federal Register is however criticized as an extremely crude measure of regulatory activity, because it can be easily manipulated (e.g. font sizes have been changed to keep page count low).[70] The apparent contradiction between Niskanen's statements and Friedman's data may be resolved by seeing Niskanen as referring to statutory deregulation (laws passed by Congress) and Friedman to administrative deregulation (rules and regulations implemented by federal agencies).
See also
- Clintonomics
- Mellonomics
- Monetarism
- Neoliberalism
- Mont Pelerin Society
- Rogernomics
- Thatcherism
- Abenomics
Footnotes
- ↑ Holley, Joe (March 1, 2009). "Broadcaster Delivered 'The Rest of the Story'". The Washington Post. Retrieved March 1, 2009.
- 1 2 3 4 5 6 7 Niskanen, William A. (1992). "Reaganomics". In David R. Henderson (ed.). Concise Encyclopedia of Economics (1st ed.). Library of Economics and Liberty. OCLC 317650570, 50016270, 163149563
- 1 2 Greenspan, Alan (2007). The Age of Turbulence. Penguin Press.
- 1 2 3 4 5 6 "CBO Historical Tables" (PDF). Retrieved 2012-01-04.
- ↑ "Reagonomics or 'voodoo economics'?". BBC News. 2004-06-05. Retrieved 2012-01-04.
- ↑ "Executive Order 12287 – Decontrol of Crude Oil and Refined Petroleum Products". January 28, 1981.
- ↑ Joseph J. Thorndike (Nov 10, 2005). "Historical Perspective: The Windfall Profit Tax". Retrieved August 14, 2013.
- 1 2 Paul Krugman (June 8, 2004). "The Great Taxer". The New York Times. Retrieved August 30, 2011.
- ↑ "Taxes: What people forget about Reagan".
- ↑ "U.S. Federal Individual Income Tax Rates History, 1913–2011 (Nominal and Inflation-Adjusted Brackets)". Tax Foundation. September 9, 2011. Retrieved August 12, 2012.
- ↑ "The Tragic Death of the Temporary Tax Cut". Time. 2011-10-01. Retrieved 2011-12-01.
- ↑ Feldstein, Martin (October 24, 2011). "The tax reform evidence from 1986". The Wall Street Journal. Retrieved January 21, 2012.
- ↑ "The Hidden Entitlements: Capital Gains". Citizens for Tax Justice. Retrieved August 15, 2012.
- ↑ Kocieniewski, David (2012-01-18). "Since 1980s, the Kindest of Tax Cuts for the Rich". The New York Times. Retrieved January 21, 2012.
- ↑ Historical tables, Budget of the United States Government, 2013, table 6.1.
- ↑ "Effective Federal Tax Rates: 1979–2001" (PDF). Bureau of Economic Analysis. July 10, 2007.
- ↑ "The Democratic Fisc". The Wall Street Journal. July 25, 2012. Retrieved March 22, 2011.
- 1 2 "US Federal Deficit as Percentage of GDP".
- 1 2 "Historical Debt Outstanding". U.S. Treasury Department. Retrieved September 8, 2010.
- 1 2 "Reagan Policies Gave Green Light to Red Ink". The Washington Post. 2004-06-09. Retrieved May 25, 2007.
- 1 2 Cannon, Lou (2001) p. 128
- ↑ Niskanen continues: "It is not clear whether this measure [reduce bias, increase effective tax rate on new investment] was a net improvement in the tax code."
- ↑ Rampell, Catherine (November 18, 2011). "Tax Pledge May Scuttle a Deal on Deficit". The New York Times. Retrieved January 27, 2012.
- ↑ Office of Management and Budget, Budget of the United States Government, Fiscal Year 1990, p. 4-4
- ↑ Barlett, Paul (April 6, 2012). "Reagan's Tax Increases". The New York Times. Retrieved April 29, 2012.
- ↑ Center for American Progress, Take a Walk on the Supply Side
- ↑ Paul Craig Roberts (August 31, 1992). "Debt, Lies, and Inflation". National Review. Retrieved February 27, 2010.
- ↑ Gardner, Jennifer M. (1994). "The 1990–1991 Recession: How Bad was the Labor Market?" (PDF). Monthly Labor Review. U.S. Department of Labor: Bureau of Labor Statistics. 117 (6): 3–11. Retrieved 6 April 2011.
- ↑ "Gross Domestic Product" (Microsoft Excel spreadsheet). Bureau of Economic Analysis. July 27, 2012. Retrieved August 15, 2012.
- ↑ "Civilian Unemployment Rate". U.S. Department of Labor: Bureau of Labor Statistics. August 3, 2012. Retrieved August 12, 2012.
- ↑ "Labor Force Statistics from the Current Population Survey: Employment status of the civilian noninstitutional population, 1941 to date". U.S. Department of Labor: Bureau of Labor Statistics. Retrieved August 12, 2012.
- ↑ "History of Federal Minimum Wage Rates Under the Fair Labor Standards Act, 1938–2009". United States Department of Labor: Wage and Hour Division (WHD). Retrieved December 27, 2009.
- ↑ "Consumer Price Index, All Urban Consumers – (CPI-U), U.S. city average, All items, 1982–84=100". U.S. Department Of Labor: Bureau of Labor Statistics. August 15, 2012. Retrieved August 15, 2012.
- ↑ http://www.miseryindex.us/indexbyPresident.aspx
- ↑ "Income, Poverty, and Health Insurance Coverage in the United States: 2007" by the Census Bureau, http://www.census.gov/prod/2008pubs/p60-235.pdf (Table A-1 on p. 27)
- ↑ The National Unemployment Rate, The Bureau of Labor Statistics, bls.gov
- ↑ http://research.stlouisfed.org/fred2/series/USARGDPC/downloaddata?cid=32267
- 1 2 3 4 5 (October 22, 1996) – Supply-Side Tax Cuts and the Truth about the Reagan Economic Record, by William A. Niskanen and Stephen Moore
- 1 2 "What's Happening with Real Wages". Mind Contagion. Retrieved August 12, 2012.
- ↑ "Table 1.1.6. Real Gross Domestic Product, Chained Dollars". U.S. Bureau of Economic Analysis. Retrieved November 14, 2013.
- 1 2 Recent Trends in Household Wealth in the United States: Rising Debt and the Middle-Class Squeeze – an Update to 2007 by Edward N. Wolff, Levy Economics Institute of Bard College, March 2010
- 1 2 "Poverty, by Region" (Microsoft Excel spreadsheet). United States Census Bureau. Retrieved August 12, 2012.
- ↑ Peter Dreier (2004). "Reagan's Legacy: Homelessness in America". National Housing Institute. Retrieved April 29, 2011.
- ↑ Steven V. Roberts (Dec 23, 1988). "Reagan on Homelessness: Many Choose to Live in the Streets". The New York Times. Retrieved January 4, 2012.
- ↑ Etebari, Mehrun (July 17, 2003). "Trickle-Down Economics: Four Reasons why it Just Doesn't Work". faireconomy.org. Retrieved 2007-03-31.
- ↑ "Federal Budget Receipts and Outlays". Presidency.ucsb.edu. Retrieved 2012-01-04.
- ↑ "Table 4.A1 – Old-Age and Survivors Insurance, selected years 1937–2007 (in millions of dollars)" (PDF). U.S. Social Security Administration. Retrieved August 12, 2012.
- ↑ Christopher Frenze (April 1996). "The Reagan Tax Cuts: Lessons for Tax Reform". U.S. Congress, Joint Economic Committee. Archived from the original on Feb 26, 2009. Retrieved March 22, 2011.
- ↑ Thorndike, Joseph J (June 14, 2004). "Historical Perspective: The Reagan Legacy". Taxhistory.org. Retrieved November 28, 2007.
- 1 2 Office of Tax Analysis (2003, rev. Sept 2006). "Revenue Effects of Major Tax Bills" (PDF). United States Department of the Treasury. Working Paper 81, Table 2. Retrieved 2007-11-28. Check date values in:
|date=(help) - ↑ CBO Historical Tables – Retrieved May 8, 2015
- ↑ Agresti, James D. and Stephen F. Cardone (January 27, 2011).Social Security Facts. Retrieved March 22, 2011.
- ↑ "Table 1.3 – Summary of Receipts, Outlays, and Surpluses or Deficits (-) in Current Dollars, Constant (FY 2005) Dollars, and as Percentages of GDP: 1940–2015" (xls). Office of Management and Budget. Retrieved October 12, 2010-10-12. Check date values in:
|access-date=(help) - ↑ Richard Kogan: Will the Tax Cuts Ultimately Pay for Themselves? March 3, 2003
- ↑ Federal Surplus or Deficit as Percent of Gross Domestic Product, Federal Reserve Bank of St. Louis
- ↑ CBO-The Budget and Economic Outlook 2014-2014 See Historical Budget Data Supplement – February 2014
- 1 2 The Real Free Lunch: Markets and Private Property
- 1 2 Reaganomics and Conservatism's Future: Two Lectures in China
- ↑ http://taxfoundation.org/article/us-federal-individual-income-tax-rates-history-1913-2011-nominal-and-inflation-adjusted-brackets/
- ↑ Ferrara, Peter (May 5, 2011).Reaganomics Vs. Obamanomics: Facts And Figures. Forbes
- 1 2 Leiserson, Greg (2008). "The Individual Alternative Minimum Tax: Historical Data and Projections" (PDF). Brookings Institution & Urban Institute. Retrieved 2008-07-29.
- ↑ "National Taxpayer Advocate 2006 Annual Report to Congress – Executive Summary" (PDF). Internal Revenue Service. Retrieved 2008-07-29.
- ↑ Hulse, Carl; Lee, Suevon (2008). "Alternative Minimum Tax". The New York Times. Retrieved 2008-07-29.
- ↑ Roubini, Nouriel (1997). "Supply Side Economics: Do Tax Rate Cuts Increase Growth and Revenues and Reduce Budget Deficits ? Or Is It Voodoo Economics All Over Again?". Stern School of Business. Retrieved 2012-01-10.
- ↑ (Krugman, 2004 & quote The secret of the long climb after 1982 was the economic plunge that preceded it. By the end of 1982 the recession in U.S. economy was deeply depressed, with the worst unemployment rate since the Great Depression. So there was plenty of room to grow before the economy returned to anything like full employment.)
- ↑ NYT-Paul Krugman-Reagan was a Keynesian-June 2012
- ↑ Saving Capitalism from the Capitalists p. 268.
- ↑ American Economic Policy in the 1980s, ed. Martin Feldstein, NBER 1994, pp. 371–72.
- ↑ Friedman, Milton (June 11, 2004). "Freedom's Friend". The Wall Street Journal. Retrieved December 30, 2006.
- ↑ James Gattuso (September 28, 2004). "Reining in the Regulators: How Does President Bush Measure Up?". The Heritage Foundation. Retrieved August 21, 2011.
References
- Bienkowski Wojciech, Brada Josef, Radlo Mariusz-Jan eds. (2006) Reaganomics Goes Global. What Can the EU, Russia and Transition Countries Learn from the USA?, Palgrave Macmillan.
- Boskin Michael J. (1987) Reagan and the US Economy. The Successes, Failures, and Unfinished Agenda, ICEG.
- Krugman, Paul (June 11, 2004). "An Economic Legend". The New York Times. ISSN 0362-4331. Retrieved 2010-03-25.
- Niskanen, William A. (1988) Reaganomics: An Insider's Account of the Policies and the People, Oxford University Press, Oxford.
- Marable Manning. (1981) REAGANISM, RACISM, AND REACTION: Black Political Realignment in the 1980s, Taylor & Francis, Ltd.
- Bowser, Benjamin. (1985) Race Relations in the 1980's: The Case of the United States, Sage Publications Incorporated.
External links
- Laffer, Arthur. "The four pillars of Reaganomics". The Heritage Foundation.
- "Reaganomics". University of Houston.
| ||
| Life and politics |  | |
| Presidency |
| |
| Speeches | ||
| Books | ||
| Elections | ||
| Popular culture | ||
| Family |
| |
| ||