Villaz-Saint-Pierre
| Villaz-Saint-Pierre | ||
|---|---|---|
| ||
 Villaz-Saint-Pierre | ||
|
Location of Villaz-Saint-Pierre 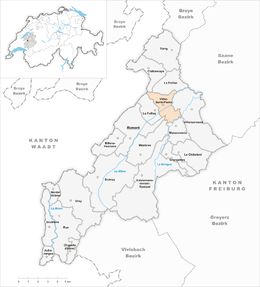 | ||
| Coordinates: 46°43′N 6°57′E / 46.717°N 6.950°ECoordinates: 46°43′N 6°57′E / 46.717°N 6.950°E | ||
| Country | Switzerland | |
| Canton | Fribourg | |
| District | Glâne | |
| Government | ||
| • Mayor | Syndic | |
| Area[1] | ||
| • Total | 5.59 km2 (2.16 sq mi) | |
| Elevation | 729 m (2,392 ft) | |
| Population (Dec 2015[2]) | ||
| • Total | 1,231 | |
| • Density | 220/km2 (570/sq mi) | |
| Postal code | 1690 | |
| SFOS number | 2111 | |
| Surrounded by | Châtonnaye, La Folliaz, Massonnens, Mézières, Romont, Sédeilles (VD), Villorsonnens | |
| Website |
http://www.villaz-st-pierre.ch SFSO statistics | |

Villaz-Saint-Pierre is a municipality in the district of Glâne in the canton of Fribourg in Switzerland.
History
Villaz-Saint-Pierre is first mentioned in 1177 as Villa.[3]
Geography
Villaz-Saint-Pierre has an area, as of 2009, of 5.6 square kilometers (2.2 sq mi). Of this area, 3.44 km2 (1.33 sq mi) or 61.5% is used for agricultural purposes, while 1.32 km2 (0.51 sq mi) or 23.6% is forested. Of the rest of the land, 0.74 km2 (0.29 sq mi) or 13.2% is settled (buildings or roads), 0.03 km2 (7.4 acres) or 0.5% is either rivers or lakes.[4]
Of the built up area, housing and buildings made up 5.7% and transportation infrastructure made up 5.2%. Out of the forested land, all of the forested land area is covered with heavy forests. Of the agricultural land, 32.0% is used for growing crops and 29.0% is pastures. All the water in the municipality is flowing water.[4]
It consists of the villages of Villaz-Saint-Pierre and Fuyens. On 1 January 1978 the former municipality of Fuyens merged into the municipality of Villaz-Saint-Pierre.[5]
Coat of arms
The blazon of the municipal coat of arms is Gules, a Saltire Argent.[6]
Demographics
Villaz-Saint-Pierre has a population (as of December 2015) of 1,231.[7] As of 2008, 10.6% of the population are resident foreign nationals.[8] Over the last 10 years (2000–2010) the population has changed at a rate of 6.5%. Migration accounted for 1.5%, while births and deaths accounted for 6.3%.[9]
Most of the population (as of 2000) speaks French (819 or 89.3%) as their first language, German is the second most common (26 or 2.8%) and Albanian is the third (21 or 2.3%). There are 6 people who speak Italian.[10]
As of 2008, the population was 51.4% male and 48.6% female. The population was made up of 437 Swiss men (44.4% of the population) and 69 (7.0%) non-Swiss men. There were 405 Swiss women (41.2%) and 73 (7.4%) non-Swiss women.[11] Of the population in the municipality, 301 or about 32.8% were born in Villaz-Saint-Pierre and lived there in 2000. There were 381 or 41.5% who were born in the same canton, while 109 or 11.9% were born somewhere else in Switzerland, and 116 or 12.6% were born outside of Switzerland.[10]
As of 2000, children and teenagers (0–19 years old) make up 29.1% of the population, while adults (20–64 years old) make up 58.6% and seniors (over 64 years old) make up 12.3%.[9]
As of 2000, there were 419 people who were single and never married in the municipality. There were 415 married individuals, 56 widows or widowers and 27 individuals who are divorced.[10]
As of 2000, there were 357 private households in the municipality, and an average of 2.5 persons per household.[9] There were 114 households that consist of only one person and 37 households with five or more people. In 2000, a total of 348 apartments (87.4% of the total) were permanently occupied, while 26 apartments (6.5%) were seasonally occupied and 24 apartments (6.0%) were empty.[12] As of 2009, the construction rate of new housing units was 7.5 new units per 1000 residents.[9] The vacancy rate for the municipality, in 2010, was 1.61%.[9]
The historical population is given in the following chart:[3][13]

Politics
In the 2011 federal election the most popular party was the SP which received 32.9% of the vote. The next three most popular parties were the SVP (24.9%), the CVP (15.4%) and the FDP (11.5%).[14]
The SPS improved their position in Villaz-Saint-Pierre rising to first, from second in 2007 (with 24.9%) The SVP moved from third in 2007 (with 21.9%) to second in 2011, the CVP moved from first in 2007 (with 26.1%) to third and the FDP retained about the same popularity (14.5% in 2007). A total of 338 votes were cast in this election, of which 1 or 0.3% was invalid.[15]
Economy
As of 2010, Villaz-Saint-Pierre had an unemployment rate of 5.1%. As of 2008, there were 37 people employed in the primary economic sector and about 15 businesses involved in this sector. 248 people were employed in the secondary sector and there were 19 businesses in this sector. 84 people were employed in the tertiary sector, with 23 businesses in this sector.[9] There were 428 residents of the municipality who were employed in some capacity, of which females made up 39.0% of the workforce.
In 2008 the total number of full-time equivalent jobs was 338. The number of jobs in the primary sector was 29, all of which were in agriculture. The number of jobs in the secondary sector was 238 of which 181 or (76.1%) were in manufacturing and 57 (23.9%) were in construction. The number of jobs in the tertiary sector was 71. In the tertiary sector; 23 or 32.4% were in wholesale or retail sales or the repair of motor vehicles, 17 or 23.9% were in the movement and storage of goods, 1 was in a hotel or restaurant, 22 or 31.0% were technical professionals or scientists, 2 or 2.8% were in education.[16]
In 2000, there were 165 workers who commuted into the municipality and 309 workers who commuted away. The municipality is a net exporter of workers, with about 1.9 workers leaving the municipality for every one entering.[17] Of the working population, 16.1% used public transportation to get to work, and 61% used a private car.[9]
Religion
From the 2000 census, 764 or 83.3% were Roman Catholic, while 55 or 6.0% belonged to the Swiss Reformed Church. Of the rest of the population, there were 9 members of an Orthodox church (or about 0.98% of the population). There were 36 (or about 3.93% of the population) who were Islamic. There were 3 individuals who were Buddhist. 28 (or about 3.05% of the population) belonged to no church, are agnostic or atheist, and 22 individuals (or about 2.40% of the population) did not answer the question.[10]
Education
In Villaz-Saint-Pierre about 297 or (32.4%) of the population have completed non-mandatory upper secondary education, and 86 or (9.4%) have completed additional higher education (either university or a Fachhochschule). Of the 86 who completed tertiary schooling, 69.8% were Swiss men, 24.4% were Swiss women.[10]
The Canton of Fribourg school system provides one year of non-obligatory Kindergarten, followed by six years of Primary school. This is followed by three years of obligatory lower Secondary school where the students are separated according to ability and aptitude. Following the lower Secondary students may attend a three or four year optional upper Secondary school. The upper Secondary school is divided into gymnasium (university preparatory) and vocational programs. After they finish the upper Secondary program, students may choose to attend a Tertiary school or continue their apprenticeship.[18]
During the 2010-11 school year, there were a total of 71 students attending 4 classes in Villaz-Saint-Pierre. A total of 196 students from the municipality attended any school, either in the municipality or outside of it. There were no kindergarten classes in the municipality, but 30 students attended kindergarten in a neighboring municipality. The municipality had 4 primary classes and 71 students. During the same year, there were no lower secondary classes in the municipality, but 46 students attended lower secondary school in a neighboring municipality. There were no upper Secondary classes or vocational classes, but there were 23 upper Secondary students and 32 upper Secondary vocational students who attended classes in another municipality. The municipality had no non-university Tertiary classes, but there were 3 non-university Tertiary students and one specialized Tertiary student who attended classes in another municipality.[11]
As of 2000, there were 48 students in Villaz-Saint-Pierre who came from another municipality, while 107 residents attended schools outside the municipality.[17]
References
- ↑ Arealstatistik Standard - Gemeindedaten nach 4 Hauptbereichen
- ↑ Swiss Federal Statistical Office - STAT-TAB, online database – Ständige und nichtständige Wohnbevölkerung nach institutionellen Gliederungen, Geburtsort und Staatsangehörigkeit (German) accessed 30 August 2016
- 1 2 Villaz-Saint-Pierre in German, French and Italian in the online Historical Dictionary of Switzerland.
- 1 2 Swiss Federal Statistical Office-Land Use Statistics 2009 data (German) accessed 25 March 2010
- ↑ Nomenklaturen – Amtliches Gemeindeverzeichnis der Schweiz (German) accessed 4 April 2011
- ↑ Flags of the World.com accessed 17-November-2011
- ↑ Swiss Federal Statistical Office - STAT-TAB, online database – Ständige und nichtständige Wohnbevölkerung nach institutionellen Gliederungen, Geburtsort und Staatsangehörigkeit (German) accessed 30 August 2016
- ↑ Swiss Federal Statistical Office - Superweb database - Gemeinde Statistics 1981-2008 (German) accessed 19 June 2010
- 1 2 3 4 5 6 7 Swiss Federal Statistical Office accessed 17-November-2011
- 1 2 3 4 5 STAT-TAB Datenwürfel für Thema 40.3 - 2000 (German) accessed 2 February 2011
- 1 2 Canton of Fribourg Statistics (German) accessed 3 November 2011
- ↑ Swiss Federal Statistical Office STAT-TAB - Datenwürfel für Thema 09.2 - Gebäude und Wohnungen (German) accessed 28 January 2011
- ↑ Swiss Federal Statistical Office STAT-TAB Bevölkerungsentwicklung nach Region, 1850-2000 (German) accessed 29 January 2011
- ↑ Canton of Fribourg National Council Election of 23 October 2011 Statistics (German) (French) accessed 3 November 2011
- ↑ Swiss Federal Statistical Office, Nationalratswahlen 2007: Stärke der Parteien und Wahlbeteiligung, nach Gemeinden/Bezirk/Canton (German) accessed 28 May 2010
- ↑ Swiss Federal Statistical Office STAT-TAB Betriebszählung: Arbeitsstätten nach Gemeinde und NOGA 2008 (Abschnitte), Sektoren 1-3 (German) accessed 28 January 2011
- 1 2 Swiss Federal Statistical Office - Statweb (German) accessed 24 June 2010
- ↑ Chart of the education system in Canton Fribourg (German)