Uxbridge (UK Parliament constituency)
| Uxbridge | |
|---|---|
|
Former Borough constituency for the House of Commons | |
|
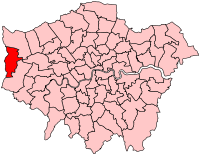
Boundary of Uxbridge in Greater London for the 2005 general election. | |
| County | Greater London |
| Major settlements | Uxbridge |
| 1885–2010 | |
| Number of members | One |
| Replaced by | Uxbridge and South Ruislip, and Ruislip, Northwood and Pinner |
| Created from | Middlesex |
Uxbridge was a borough constituency represented in the House of Commons of the Parliament of the United Kingdom. It elected one Member of Parliament (MP) using the first-past-the-post voting system, from 1885 until it was abolished at the 2010 general election.
Boundaries
1885-1918: The parliamentary constituency of Uxbridge was created as the westernmost county division of the historic county of Middlesex. The Redistribution of Seats Act 1885 defined the seat as comprising the parishes of Ashford*, Bedfont, Cowley, Cranford, Feltham, Hampton, Hampton Wick, Hanworth, Harefield, Harlington, Harmondsworth, Hayes, Hillingdon East, Hillingdon West, Ickenham, Laleham*, Littleton*, Northolt, Ruislip, Shepperton*, Staines*, Stanwell*, Sunbury*, Teddington, Uxbridge, West Drayton, and Yiewsley.
The parishes marked * were, from 1965, included in the administrative county of Surrey. The other parishes, in the above list, were at the same time incorporated in Greater London. In 1974 the south-west Middlesex communities, which had been transferred to Surrey, were linked to become the Borough of Spelthorne.
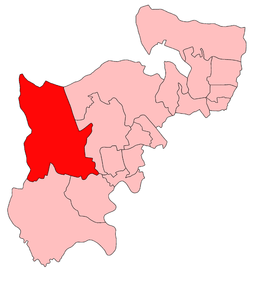
1918-1945: Uxbridge was cut down to be the north-western county division of Middlesex. The areas of south-west Middlesex which subsequently became the Borough of Spelthorne, with Feltham, Hampton, Hampton Wick and Teddington were all combined in a new Spelthorne constituency.
The local government areas in the new Uxbridge seat were defined, by the Representation of the People Act 1918, as the urban districts of Hayes, Ruislip-Northwood, Southall-Norwood, Uxbridge, and Yiewsley as well as the Uxbridge Rural District.
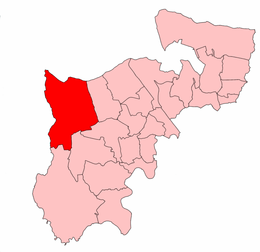
1945-1950: As part of an interim redistribution of parliamentary seats with more than 100,000 registered electors, changes were made to the Middlesex constituencies. Uxbridge was reduced to the urban districts of Ruislip-Northwood and Uxbridge.
1950-1974: In the general redistribution which took effect in 1950, Ruislip-Northwood became a new seat. Uxbridge (which became the Municipal Borough of Uxbridge in 1955) was joined by the Yiewsley and West Drayton Urban District, to form the last incarnation of the Uxbridge county division.
In 1965 the area of the constituency became part of the London Borough of Hillingdon.
1974-1983: The seat was re-classified as a borough constituency, comprising the Hillingdon wards of Colham-Cowley, Harefield, Hillingdon East, Hillingdon West, Ickenham, Uxbridge, and Yiewsley.
1983-1997: The constituency was unchanged from 1974, but following re-warding it comprised the wards of Colham, Cowley, Harefield, Hillingdon East, Hillingdon North, Hillingdon West, Ickenham, Uxbridge North, Uxbridge South, West Drayton, and Yiewsley.
1997-2010: There was a small boundary change, with Harefield ward being transferred to the Ruislip-Northwood constituency. The remaining wards were Colham, Cowley, Hillingdon East, Hillingdon North, Hillingdon West, Ickenham, Uxbridge North, Uxbridge South, West Drayton and Yiewsley.
Boundary review
Following their review of parliamentary representation in North London, the Boundary Commission for England has created a new constituency of Uxbridge and South Ruislip.
A number of electoral wards in Hillingdon are moved into the new constituency of Ruislip, Northwood and Pinner
Members of Parliament
Election results
Elections in the 1880s

| Party | Candidate | Votes | % | ± | |
|---|---|---|---|---|---|
| Conservative | Frederick Dixon Dixon-Hartland | 5,093 | 66.1 | n/a | |
| Liberal | James Pellatt Rickman | 2,615 | 33.9 | n/a | |
| Majority | 2,478 | 32.2 | n/a | ||
| Turnout | 77.8 | n/a | |||
| Conservative win (new seat) | |||||
| Party | Candidate | Votes | % | ± | |
|---|---|---|---|---|---|
| Conservative | Frederick Dixon Dixon-Hartland | unopposed | n/a | n/a | |
| Conservative hold | Swing | n/a | |||
Elections in the 1890s
| Party | Candidate | Votes | % | ± | |
|---|---|---|---|---|---|
| Conservative | Frederick Dixon Dixon-Hartland | 5,172 | 71.8 | n/a | |
| Liberal | Leslie C Probyn | 2,029 | 28.2 | n/a | |
| Majority | 3,143 | 43.6 | n/a | ||
| Turnout | 61.3 | n/a | |||
| Conservative hold | Swing | n/a | |||
| Party | Candidate | Votes | % | ± | |
|---|---|---|---|---|---|
| Conservative | Sir Frederick Dixon Dixon-Hartland | unopposed | n/a | n/a | |
| Conservative hold | Swing | n/a | |||
Elections in the 1900s
| Party | Candidate | Votes | % | ± | |
|---|---|---|---|---|---|
| Conservative | Sir Frederick Dixon Dixon-Hartland | unopposed | n/a | n/a | |
| Conservative hold | Swing | n/a | |||

| Party | Candidate | Votes | % | ± | |
|---|---|---|---|---|---|
| Conservative | Sir Frederick Dixon Dixon-Hartland | 6,429 | 50.6 | n/a | |
| Liberal | Sidney Job Pocock | 6,284 | 49.4 | n/a | |
| Majority | 145 | 1.2 | n/a | ||
| Turnout | 79.8 | n/a | |||
| Conservative hold | Swing | n/a | |||
Elections in the 1910s

| Party | Candidate | Votes | % | ± | |
|---|---|---|---|---|---|
| Conservative | Hon. Charles Thomas Mills | 10,116 | 65.2 | +14.6 | |
| Liberal | Sidney Job Pocock | 5,408 | 34.8 | -14.6 | |
| Majority | 4,708 | 30.4 | +29.2 | ||
| Turnout | 88.0 | +8.2 | |||
| Conservative hold | Swing | +14.6 | |||
| Party | Candidate | Votes | % | ± | |
|---|---|---|---|---|---|
| Conservative | Hon. Charles Thomas Mills | 9,005 | 67.8 | +2.6 | |
| Liberal | Manmath Chandra Mallik | 4,286 | 32.2 | -2.6 | |
| Majority | 35.6 | +5.2 | |||
| Turnout | 75.4 | -12.6 | |||
| Conservative hold | Swing | +2.6 | |||
| Party | Candidate | Votes | % | ± | |
|---|---|---|---|---|---|
| Unionist | Hon. Arthur Robert Mills | unopposed | n/a | n/a | |
| Unionist hold | Swing | n/a | |||

| Party | Candidate | Votes | % | ± | |
|---|---|---|---|---|---|
| Unionist | 9,814 | 59.1 | n/a | ||
| Labour | Harry Gosling | 6,251 | 37.6 | n/a | |
| Liberal | Norman Mackenzie Snowball | 545 | 3.3 | n/a | |
| Majority | 3,563 | 21.5 | n/a | ||
| Turnout | 55.9 | n/a | |||
| Unionist hold | Swing | n/a | |||
- endorsed by Coalition Government
Elections in the 1920s
| Party | Candidate | Votes | % | ± | |
|---|---|---|---|---|---|
| Unionist | Charles Dennistoun Burney | 12,391 | 52.7 | ||
| Labour | William John Brown | 7,292 | 31.0 | ||
| National Liberal | F. S. Evans | 3,844 | 16.3 | ||
| Majority | 5,099 | 21.7 | |||
| Turnout | 73.0 | ||||
| Unionist hold | Swing | ||||

| Party | Candidate | Votes | % | ± | |
|---|---|---|---|---|---|
| Unionist | Charles Dennistoun Burney | 9,254 | 40.6 | -12.1 | |
| Liberal | Graham Seton Hutchison | 7,423 | 32.5 | +16.2 | |
| Labour | Robert P. Small | 6,146 | 26.9 | -4.1 | |
| Majority | 1,831 | 8.1 | -13.6 | ||
| Turnout | 66.6 | -6.4 | |||
| Unionist hold | Swing | -14.2 | |||
| Party | Candidate | Votes | % | ± | |
|---|---|---|---|---|---|
| Unionist | Charles Dennistoun Burney | 13,525 | 52.1 | ||
| Labour | Robert P. Small | 8,459 | 32.6 | ||
| Liberal | J S Griffith-Jones | 3,976 | 15.3 | ||
| Majority | 5,066 | 19.5 | |||
| Turnout | 71.8 | ||||
| Unionist hold | Swing | ||||
| Party | Candidate | Votes | % | ± | |
|---|---|---|---|---|---|
| Unionist | John Jestyn Llewellin | 17,770 | 41.2 | -10.9 | |
| Labour | Reginald Francis Orlando Bridgeman | 16,422 | 38.2 | +5.6 | |
| Liberal | Richard Christian Cecil James Binney | 8,847 | 20.6 | +5.3 | |
| Majority | 1,348 | 3.0 | -16.5 | ||
| Turnout | 72.2 | +0.4 | |||
| Unionist hold | Swing | -8.2 | |||
Elections in the 1930s
| Party | Candidate | Votes | % | ± | |
|---|---|---|---|---|---|
| Conservative | John Jestyn Llewellin | 35,836 | 71.96 | ||
| Labour | Lawrence M. Worsnop | 11,609 | 23.31 | ||
| Independent | Reginald Francis Orlando Bridgeman | 2,358 | 4.73 | ||
| Majority | 24,227 | 48.65 | |||
| Turnout | 68.36 | ||||
| Conservative hold | Swing | ||||
| Party | Candidate | Votes | % | ± | |
|---|---|---|---|---|---|
| Conservative | John Jestyn Llewellin | 34,727 | 54.06 | ||
| Labour | Lawrence M. Worsnop | 24,000 | 37.36 | ||
| Liberal | William Ridgway | 5,514 | 8.58 | ||
| Majority | 10,727 | 16.70 | |||
| Turnout | 65.20 | ||||
| Conservative hold | Swing | ||||
Election in the 1940s
| Party | Candidate | Votes | % | ± | |
|---|---|---|---|---|---|
| Labour Co-op | Frank Beswick | 25,190 | 43.74 | ||
| Conservative | John Jestyn Llewellin | 24,106 | 41.85 | ||
| Liberal | John Ernest Aylett | 8,300 | 14.41 | ||
| Majority | 1,084 | 1.88 | |||
| Turnout | 73.93 | ||||
| Labour Co-op gain from Conservative | Swing | ||||
Elections in the 1950s
| Party | Candidate | Votes | % | ± | |
|---|---|---|---|---|---|
| Labour Co-op | Frank Beswick | 20,139 | 48.16 | ||
| Conservative | C.B. Thorne | 17,741 | 42.43 | ||
| Liberal | John Ernest Aylett | 3,933 | 9.41 | ||
| Majority | 2,398 | 5.74 | |||
| Turnout | 84.56 | ||||
| Labour Co-op hold | Swing | ||||
| Party | Candidate | Votes | % | ± | |
|---|---|---|---|---|---|
| Labour Co-op | Frank Beswick | 21,249 | 49.14 | ||
| Conservative | Leslie Charles Curran | 19,701 | 45.56 | ||
| Liberal | Lucien Fior | 2,289 | 5.29 | ||
| Majority | 1,548 | 3.58 | |||
| Turnout | 84.75 | ||||
| Labour Co-op hold | Swing | ||||
| Party | Candidate | Votes | % | ± | |
|---|---|---|---|---|---|
| Labour Co-op | Frank Beswick | 22,244 | 51.00 | ||
| Conservative | Leslie Charles Curran | 21,368 | 49.00 | ||
| Majority | 876 | 2.01 | |||
| Turnout | 81.71 | ||||
| Labour Co-op hold | Swing | ||||
| Party | Candidate | Votes | % | ± | |
|---|---|---|---|---|---|
| Conservative | Leslie Charles Curran | 22,360 | 46.51 | ||
| Labour Co-op | Frank Beswick | 20,970 | 43.62 | ||
| Liberal | Gordon Robert Goodall | 4,746 | 9.87 | ||
| Majority | 1,390 | 2.89 | |||
| Turnout | 84.35 | ||||
| Conservative gain from Labour Co-op | Swing | ||||
Elections in the 1960s
| Party | Candidate | Votes | % | ± | |
|---|---|---|---|---|---|
| Conservative | Leslie Charles Curran | 20,519 | 43.63 | ||
| Labour | Thomas J. Parker | 19,866 | 42.24 | ||
| Liberal | Gordon Robert Goodall | 6,644 | 14.13 | ||
| Majority | 653 | 1.39 | |||
| Turnout | 80.77 | ||||
| Conservative hold | Swing | ||||
| Party | Candidate | Votes | % | ± | |
|---|---|---|---|---|---|
| Labour | John Ryan | 21,793 | 45.46 | ||
| Conservative | Leslie Charles Curran | 20,903 | 43.61 | ||
| Liberal | Gordon Robert Goodall | 5,241 | 10.93 | ||
| Majority | 890 | 1.86 | |||
| Turnout | 82.55 | ||||
| Labour gain from Conservative | Swing | ||||
Elections in the 1970s
| Party | Candidate | Votes | % | ± | |
|---|---|---|---|---|---|
| Conservative | Leslie Charles Curran | 23,414 | 49.35 | ||
| Labour | John Ryan | 19,768 | 41.66 | ||
| Liberal | Gordon Robert Goodall | 4,265 | 8.99 | ||
| Majority | 3,646 | 7.68 | |||
| Turnout | 74.95 | ||||
| Conservative gain from Labour | Swing | ||||
| Party | Candidate | Votes | % | ± | |
|---|---|---|---|---|---|
| Conservative | Michael Shersby | 14,178 | 42.31 | -7.04 | |
| Labour | Manuela Sykes | 13,000 | 38.79 | -2.87 | |
| Liberal | Ian Stuart | 3,650 | 10.89 | +1.9 | |
| National Front | John Clifton | 2,920 | 8.71 | N/A | |
| Union Movement | Dan Harmston | 873 | 2.60 | N/A | |
| National Independence | Clare Macdonald | 551 | 1.64 | N/A | |
| Democratic Conservative against the Common Market | Reginald Simmerson | 341 | 1.02 | N/A | |
| Majority | 1,178 | 3.52 | |||
| Turnout | 35,513 | ||||
| Conservative hold | Swing | ||||
| Party | Candidate | Votes | % | ± | |
|---|---|---|---|---|---|
| Conservative | Michael Shersby | 20,542 | 42.08 | ||
| Labour | Manuela Sykes | 18,127 | 37.13 | ||
| Liberal | J.S. Pincham | 10,150 | 20.79 | ||
| Majority | 2,415 | 4.95 | |||
| Turnout | 82.48 | ||||
| Conservative hold | Swing | ||||
| Party | Candidate | Votes | % | ± | |
|---|---|---|---|---|---|
| Conservative | Michael Shersby | 19,969 | 44.51 | ||
| Labour | G.E. Pringle | 17,816 | 39.71 | ||
| Liberal | J.S. Pincham | 7,081 | 15.78 | ||
| Majority | 2,153 | 4.80 | |||
| Turnout | 75.09 | ||||
| Conservative hold | Swing | ||||
| Party | Candidate | Votes | % | ± | |
|---|---|---|---|---|---|
| Conservative | Michael Shersby | 24,967 | 52.49 | ||
| Labour | G.E. Pringle | 16,972 | 35.68 | ||
| Liberal | Jonathan Hunt | 5,031 | 10.58 | ||
| National Front | P. Budgen | 595 | 1.25 | ||
| Majority | 7,995 | 16.81 | |||
| Turnout | 78.86 | ||||
| Conservative hold | Swing | ||||
Elections in the 1980s
| Party | Candidate | Votes | % | ± | |
|---|---|---|---|---|---|
| Conservative | Michael Shersby | 23,875 | 53.62 | ||
| Social Democratic | P. Russell | 11,038 | 24.79 | ||
| Labour | P.J. Magee | 9,611 | 21.59 | ||
| Majority | 12,837 | 28.83 | |||
| Turnout | 72.26 | ||||
| Conservative hold | Swing | ||||
| Party | Candidate | Votes | % | ± | |
|---|---|---|---|---|---|
| Conservative | Michael Shersby | 27,292 | 56.47 | ||
| Labour | David Michael Ernest Keys | 11,322 | 23.43 | ||
| Social Democratic | Anthony Philip Goodman | 9,164 | 18.96 | ||
| Green | Ian Edward Flindall | 549 | 1.14 | ||
| Majority | 15,970 | 33.05 | |||
| Turnout | 76.52 | ||||
| Conservative hold | Swing | ||||
Elections in the 1990s
| Party | Candidate | Votes | % | ± | |
|---|---|---|---|---|---|
| Conservative | Michael Shersby | 27,487 | 56.44 | ||
| Labour | Robert John Emlyn Evans | 14,308 | 29.38 | ||
| Liberal Democrat | SJ Carey | 5,900 | 12.11 | ||
| Green | Ian Edward Flindall | 538 | 1.10 | ||
| BNP | Michael O'Rourke | 350 | 0.72 | ||
| Natural Law | A Deans | 120 | 0.25 | ||
| Majority | 13,179 | 27.06 | |||
| Turnout | 30,071 | 78.88 | |||
| Conservative hold | Swing | ||||
| Party | Candidate | Votes | % | ± | |
|---|---|---|---|---|---|
| Conservative | Michael Shersby | 18,095 | 43.5 | ||
| Labour | David Williams | 17,371 | 41.8 | ||
| Liberal Democrat | Andrew Malyan | 4,528 | 10.9 | ||
| Referendum | Garrick Aird | 1,153 | 2.8 | N/A | |
| Socialist Alternative | Julia Leonard | 398 | 1.0 | N/A | |
| Majority | 724 | 1.7 | |||
| Turnout | 72.3 | ||||
| Conservative hold | Swing | ||||
| Party | Candidate | Votes | % | ± | |
|---|---|---|---|---|---|
| Conservative | Alexander John Randall | 16,288 | 51.1 | +7.6 | |
| Labour | Andrew Francis Slaughter | 12,522 | 39.3 | −2.5 | |
| Liberal Democrat | Keith Kerr | 1,792 | 5.6 | −5.4 | |
| Monster Raving Loony | Screaming Lord Sutch | 396 | 1.3 | N/A | |
| Socialist Alternative | Julia Leonard | 259 | 0.8 | −0.1 | |
| BNP | Frances Taylor | 205 | 0.7 | N/A | |
| National Democrats | Ian Hugh Myddleton Anderson | 157 | 0.5 | N/A | |
| National Front | John McAuley | 110 | 0.3 | N/A | |
| Independent Liberal | Henry Middleton | 69 | 0.2 | N/A | |
| UKIP | James Feisenberger | 39 | 0.1 | N/A | |
| Rainbow Dream Ticket | Ronnie Carroll | 30 | 0.1 | N/A | |
| Majority | 3,766 | 11.8 | |||
| Turnout | 55.2 | -16.9 | |||
| Conservative hold | Swing | ||||
Elections in the 2000s
| Party | Candidate | Votes | % | ± | |
|---|---|---|---|---|---|
| Conservative | Alexander John Randall | 15,751 | 47.1 | +3.6 | |
| Labour | David Salisbury-Jones | 13,653 | 40.9 | -0.9 | |
| Liberal Democrat | Catherine Royce | 3,426 | 10.3 | −0.6 | |
| UKIP | Paul Cannons | 588 | 1.8 | N/A | |
| Majority | 2,098 | 6.2 | |||
| Turnout | 33,418 | 57.5 | -14.8 | ||
| Conservative hold | Swing | ||||
| Party | Candidate | Votes | % | ± | |
|---|---|---|---|---|---|
| Conservative | Alexander John Randall | 16,840 | 49.0 | +1.9 | |
| Labour | Roderick Dubrow-Marshall | 10,669 | 31.0 | −9.9 | |
| Liberal Democrat | Tariq Mahmood | 4,544 | 13.2 | +2.9 | |
| BNP | Cliff le May | 763 | 2.2 | N/A | |
| Green | Stephen Young | 725 | 2.1 | N/A | |
| UKIP | Robert Kerby | 553 | 1.6 | −0.2 | |
| National Front | Peter Shaw | 284 | 0.8 | N/A | |
| Majority | 6,171 | 18.0 | |||
| Turnout | 34,378 | 59.4 | +1.9 | ||
| Conservative hold | Swing | +5.9 | |||
See also
References
- ↑ Leigh Rayment's Historical List of MPs – Constituencies beginning with "U"
- 1 2 3 4 5 6 7 8 9 British Parliamentary Election Results 1885-1918, FWS Craig
- ↑ Debrett's House of Commons & Judicial Bench, 1886
- ↑ British Parliamentary Election Results 1918-1949, FWS Craig
- ↑ British Parliamentary Election Results 1918-1949, FWS Craig
- ↑ British Parliamentary Election Results 1918-1949, FWS Craig
- ↑ British Parliamentary Election Results 1918-1949, FWS Craig
- ↑ British Parliamentary Election Results 1918-1949, FWS Craig
- ↑ http://www.politicsresources.net/area/uk/ge92/i20.htm
Coordinates: 51°32′20″N 0°27′47″W / 51.539°N 0.463°W