Uttwil
| Uttwil | ||
|---|---|---|
|
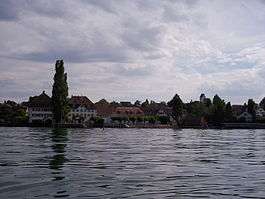
Uttwil village | ||
| ||
 Uttwil | ||
|
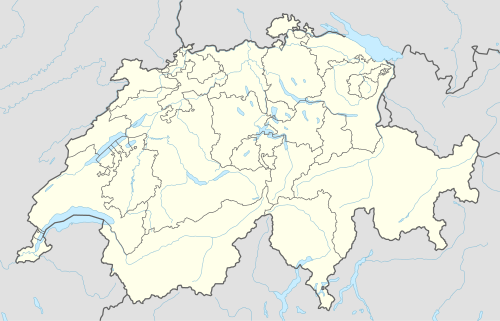
Location of Uttwil  | ||
| Coordinates: 47°35′N 9°21′E / 47.583°N 9.350°ECoordinates: 47°35′N 9°21′E / 47.583°N 9.350°E | ||
| Country | Switzerland | |
| Canton | Thurgau | |
| District | Arbon | |
| Area[1] | ||
| • Total | 4.34 km2 (1.68 sq mi) | |
| Elevation | 419 m (1,375 ft) | |
| Population (Dec 2015[2]) | ||
| • Total | 1,832 | |
| • Density | 420/km2 (1,100/sq mi) | |
| Postal code | 8592 | |
| SFOS number | 4451 | |
| Surrounded by | Dozwil, Friedrichshafen (DE-BY), Hefenhofen, Immenstaad am Bodensee (DE-BY), Kesswil, Romanshorn | |
| Website |
www SFSO statistics | |

Uttwil is a municipality in the district of Arbon in the canton of Thurgau in Switzerland.
Geography
Uttwil has an area, as of 2009, of 4.34 square kilometers (1.68 sq mi). Of this area, 2.29 km2 (0.88 sq mi) or 52.8% is used for agricultural purposes, while 1.33 km2 (0.51 sq mi) or 30.6% is forested. Of the rest of the land, 0.7 km2 (0.27 sq mi) or 16.1% is settled (buildings or roads), 0.04 km2 (9.9 acres) or 0.9% is either rivers or lakes and 0.01 km2 (2.5 acres) or 0.2% is unproductive land.[3]
Of the built up area, industrial buildings made up 8.3% of the total area while housing and buildings made up 0.7% and transportation infrastructure made up 0.7%. Power and water infrastructure as well as other special developed areas made up 2.5% of the area while parks, green belts and sports fields made up 3.9%. Out of the forested land, 29.0% of the total land area is heavily forested and 1.6% is covered with orchards or small clusters of trees. Of the agricultural land, 36.2% is used for growing crops, while 16.6% is used for orchards or vine crops. All the water in the municipality is in lakes.[3]
Demographics
Uttwil has a population (as of December 2015) of 1,832[4] As of 2008, 13.9% of the population are foreign nationals.[5] Over the last 10 years (1997–2007) the population has changed at a rate of 18.7%. Most of the population (as of 2000) speaks German(94.2%), with Italian being second most common ( 2.0%) and Albanian being third ( 1.0%).[6]
As of 2008, the gender distribution of the population was 50.9% male and 49.1% female. The population was made up of 710 Swiss men (43.0% of the population), and 130 (7.9%) non-Swiss men. There were 712 Swiss women (43.1%), and 99 (6.0%) non-Swiss women.[5]
In 2008 there were 20 live births to Swiss citizens and 2 births to non-Swiss citizens, and in same time span there were 11 deaths of Swiss citizens and 2 non-Swiss citizen deaths. Ignoring immigration and emigration, the population of Swiss citizens increased by 9 while the foreign population remained the same. There were 2 Swiss men who emigrated from Switzerland to another country, 6 Swiss women who emigrated from Switzerland to another country, 10 non-Swiss men who emigrated from Switzerland to another country and 7 non-Swiss women who emigrated from Switzerland to another country. The total Swiss population change in 2008 (from all sources) was an increase of 20 and the non-Swiss population change was an increase of 25 people. This represents a population growth rate of 2.8%.[5]
The age distribution, as of 2009, in Uttwil is; 210 children or 12.3% of the population are between 0 and 9 years old and 199 teenagers or 11.6% are between 10 and 19. Of the adult population, 165 people or 9.6% of the population are between 20 and 29 years old. 227 people or 13.3% are between 30 and 39, 308 people or 18.0% are between 40 and 49, and 244 people or 14.3% are between 50 and 59. The senior population distribution is 191 people or 11.2% of the population are between 60 and 69 years old, 100 people or 5.8% are between 70 and 79, there are 58 people or 3.4% who are between 80 and 89, and there are 9 people or 0.5% who are 90 and older.[7]
As of 2000, there were 594 private households in the municipality, and an average of 2.4 persons per household.[6] In 2000 there were 250 single family homes (or 75.1% of the total) out of a total of 333 inhabited buildings. There were 33 two family buildings (9.9%), 12 three family buildings (3.6%) and 38 multi-family buildings (or 11.4%).[8] There were 354 (or 24.6%) persons who were part of a couple without children, and 787 (or 54.7%) who were part of a couple with children. There were 70 (or 4.9%) people who lived in single parent home, while there are 6 persons who were adult children living with one or both parents, 4 persons who lived in a household made up of relatives, 8 who lived in a household made up of unrelated persons, and 16 who are either institutionalized or live in another type of collective housing.[9]
The vacancy rate for the municipality, in 2008, was 1.2%. As of 2007, the construction rate of new housing units was 11.2 new units per 1000 residents.[6] In 2000 there were 669 apartments in the municipality. The most common apartment size was the 4 room apartment of which there were 208. There were 15 single room apartments and 109 apartments with six or more rooms.[10] As of 2000 the average price to rent an average apartment in Uttwil was 1117.55 Swiss francs (CHF) per month (US$890, £500, €720 approx. exchange rate from 2000). The average rate for a one-room apartment was 496.67 CHF (US$400, £220, €320), a two-room apartment was about 636.43 CHF (US$510, £290, €410), a three-room apartment was about 891.42 CHF (US$710, £400, €570) and a six or more room apartment cost an average of 1490.00 CHF (US$1190, £670, €950). The average apartment price in Uttwil was 100.1% of the national average of 1116 CHF.[11]
In the 2007 federal election the most popular party was the SVP which received 43.91% of the vote. The next three most popular parties were the FDP (16.64%), the SP (11.15%) and the Green Party (10.63%). In the federal election, a total of 531 votes were cast, and the voter turnout was 49.2%.[12]
The historical population is given in the following table:[13]
| year | population |
|---|---|
| 1950 | 842 |
| 1960 | 836 |
| 1980 | 876 |
| 1990 | 1,102 |
| 2000 | 1,439 |
Economy
As of 2007, Uttwil had an unemployment rate of 1.29%. As of 2005, there were 80 people employed in the primary economic sector and about 22 businesses involved in this sector. 37 people are employed in the secondary sector and there are 13 businesses in this sector. 140 people are employed in the tertiary sector, with 40 businesses in this sector.[6]
In 2000 there were 995 workers who lived in the municipality. Of these, 591 or about 59.4% of the residents worked outside Uttwil while 70 people commuted into the municipality for work. There were a total of 474 jobs (of at least 6 hours per week) in the municipality.[14] Of the working population, 10% used public transportation to get to work, and 58.5% used a private car.[6]
Religion
From the 2000 census, 464 or 32.2% were Roman Catholic, while 696 or 48.4% belonged to the Swiss Reformed Church. Of the rest of the population, there were 4 Old Catholics (or about 0.28% of the population) who belonged to the Christian Catholic Church of Switzerland there are 6 individuals (or about 0.42% of the population) who belong to the Orthodox Church, and there are 37 individuals (or about 2.57% of the population) who belong to another Christian church. There was 1 individual who was Jewish, and 30 (or about 2.08% of the population) who are Islamic. There are 12 individuals (or about 0.83% of the population) who belong to another church (not listed on the census), 150 (or about 10.42% of the population) belong to no church, are agnostic or atheist, and 39 individuals (or about 2.71% of the population) did not answer the question.[15]
Education
In Uttwil about 78.2% of the population (between age 25-64) have completed either non-mandatory upper secondary education or additional higher education (either university or a Fachhochschule).[6]
Uttwil is of the Dozwil-Kesswil-Uttwil secondary school district. It is also home to the Uttwil primary school district.
In the primary school district there are 154 students. There are 44 children in the kindergarten, and the average class size is 22 kindergartners. Of the children in kindergarten, 14 or 31.8% are female, 6 or 13.6% are not Swiss citizens and 9 or 20.5% do not speak German natively. The lower and upper primary levels begin at about age 5-6 and lasts for 6 years. There are 61 children in who are at the lower primary level and 49 children in the upper primary level. The average class size in the primary school is 18.33 students. At the lower primary level, there are 31 children or 50.8% of the total population who are female, 6 or 9.8% are not Swiss citizens and 7 or 11.5% do not speak German natively. In the upper primary level, there are 18 or 36.7% who are female, 6 or 12.2% are not Swiss citizens and 7 or 14.3% do not speak German natively.
In the 2008/2009 school year there are 111 students in the secondary school district. At the secondary level, students are divided according to performance. The secondary level begins at about age 12 and usually lasts 3 years. Finally, there are 111 teenagers who are in special or remedial classes, of which 51 or 45.9% are female, 11 or 9.9% are not Swiss citizens and 6 or 5.4% do not speak German natively.[16]
References
- ↑ Arealstatistik Standard - Gemeindedaten nach 4 Hauptbereichen
- ↑ Swiss Federal Statistical Office - STAT-TAB, online database – Ständige und nichtständige Wohnbevölkerung nach institutionellen Gliederungen, Geburtsort und Staatsangehörigkeit (German) accessed 30 August 2016
- 1 2 Swiss Federal Statistical Office-Land Use Statistics 2009 data (German) accessed 25 March 2010
- ↑ Swiss Federal Statistical Office - STAT-TAB, online database – Ständige und nichtständige Wohnbevölkerung nach institutionellen Gliederungen, Geburtsort und Staatsangehörigkeit (German) accessed 30 August 2016
- 1 2 3 Swiss Federal Statistical Office - Superweb database - Gemeinde Statistics 1981-2008 (German) accessed 19 June 2010
- 1 2 3 4 5 6 Swiss Federal Statistical Office accessed 08-September-2010
- ↑ Statistical Office of Thurgau, MS Excel document – Altersstruktur der Wohnbevölkerung nach zivilrechtlichem Wohnsitzbegriff am 31.12.2009 (German) accessed 23 June 2010
- ↑ Statistical Office of Thurgau, MS Excel document - Wohngebäude nach Anzahl Wohneinheiten und Gemeinden, Jahr 2000 (German) accessed 24 June 2010
- ↑ Statistical Office of Thurgau, MS Excel document – Wohnbevölkerung nach Haushaltstyp und Gemeinde, Jahr 2000 (German) accessed 23 June 2010
- ↑ Statistical Office of Thurgau, MS Excel document - Wohnungen nach Anzahl Zimmer und Gemeinden, Jahr 2000 (German) accessed 24 June 2010
- ↑ Statistical Office of Thurgau, MS Excel document - Durchschnittlicher Wohnungsmietpreis nach Anzahl Zimmer und Gemeinden (German) accessed 24 June 2010
- ↑ Swiss Federal Statistical Office, Nationalratswahlen 2007: Stärke der Parteien und Wahlbeteiligung, nach Gemeinden/Bezirk/Canton (German) accessed 28 May 2010
- ↑ Statistical Office of Thurgau, MS Excel document – Wohnbevölkerung im Kanton Thurgau nach Gemeinden, seit 1850 (German) accessed 22 June 2010
- ↑ Swiss Federal Statistical Office - Statweb (German) accessed 24 June 2010
- ↑ Statistical Office of Thurgau, MS Excel document – Wohnbevölkerung Gemeinden nach religiöser Zugehörigkeit, Jahr 2000 (German) accessed 23 June 2010
- ↑ Canton Thurgau Schools (German) accessed 23 June 2010
| Wikimedia Commons has media related to Uttwil. |