United States presidential election in North Carolina, 2004
| | ||||||||||||||||||||||||||||||||
| ||||||||||||||||||||||||||||||||
| ||||||||||||||||||||||||||||||||
|
| ||||||||||||||||||||||||||||||||
| County Results
Kerry—60-70%
Kerry—50-60%
Kerry—<50%
Bush—<50%
Bush—50-60%
Bush—60-70%
Bush—70-80% | ||||||||||||||||||||||||||||||||
| ||||||||||||||||||||||||||||||||

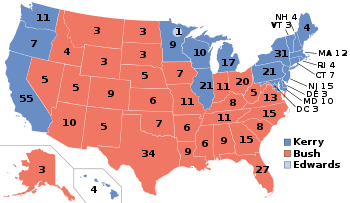
The 2004 United States presidential election in North Carolina took place on November 2, 2004 throughout all 50 states and D.C., which was part of the 2004 United States presidential election. Voters chose 15 representatives, or electors to the Electoral College, who voted for President and Vice President.
North Carolina was won by incumbent President George W. Bush by a 12.4% margin of victory. Prior to the election, all 12 news organizations considered this a state Bush would win, or otherwise considered as a red state. NC was the home state of John Edwards, Democratic nominee for vice-president, who was then representing the state in the United States Senate. This was not enough for Democrats to break Republican success in this state since the 1976 presidential election of Jimmy Carter.
Primaries
- North Carolina Democratic primary, 2004
Campaign
Predictions
| Elections in North Carolina | ||||||
|---|---|---|---|---|---|---|
 | ||||||
|
||||||
|
State legislature
|
||||||
There were 12 news organizations who made state by state predictions of the election. Here are their last predictions before election day.[1]
- D.C. Political Report: Likely Republican
- Associated Press: Leans Bush
- CNN: Bush
- Cook Political Report: Leans Republican
- Newsweek: Leans Bush
- New York Times: Solid Bush
- Rasmussen Reports: Bush
- Research 2000: Leans Bush
- Washington Post: Bush
- Washington Times: Solid Bush
- Zogby International: Bush
- Washington Dispatch: Bush
Polling
Bush won every single pre-election poll. The final 3 poll average showed Bush leading 52% to 44%.[2]
Fundraising
Bush raised $4,465,160.[3] Kerry raised $2,049,794.[4]
Advertising and visits
Neither campaign advertised or visited the state during the fall campaign.[5][6]
Analysis
John Edwards failed to make his home state competitive in the general election. The main reason why is that Bush's approval rating was consistently above 50%. Matthew Dowd, chief strategist for the Bush campaign, says the findings indicate that the Tar Heel state remains safely Republican in the presidential election.[7] Polls showed Kerry had a strong 44% of voters in NC, but Bush consistently polled between 49%–54% and his approval ratings remained in the lower 50% range.[8][9] In the end, Edwards didn't even have any effect on North Carolina's results, as they were identical to the 2000 results.
Bush won a majority of the 100 counties and congressional districts. The only region in the state that Kerry dominated in was the Northeast part of the state, the location of North Carolina's 1st congressional district. The only significant improvement Kerry–Edwards made on Al Gore in 2000 was winning heavy populated Mecklenburg County.
Results
| United States presidential election in North Carolina, 2004 | ||||||
|---|---|---|---|---|---|---|
| Party | Candidate | Running mate | Votes | Percentage | Electoral votes | |
| Republican | George W. Bush | Richard Cheney | 1,961,166 | 56.02% | 15 | |
| Democratic | John Kerry | John Edwards | 1,525,849 | 43.58% | 0 | |
| Libertarian | Michael Badnarik | Richard Campagna | 11,731 | 0.34% | 0 | |
| Totals | - | 100% | 15 | |||
| Voter turnout (Voting Age population) | 55.4% | |||||
Results breakdown
By county
| County | Kerry | Votes | Bush | Votes | Others | Votes |
|---|---|---|---|---|---|---|
| Alamance | 38.2% | 20,686 | 61.5% | 33,302 | 0.3% | 187 |
| Alexander | 29.6% | 4,618 | 70.1% | 10,928 | 0.3% | 54 |
| Alleghany | 39.8% | 1,922 | 59.7% | 2,883 | 0.5% | 22 |
| Anson | 58.7% | 5,413 | 41.1% | 3,796 | 0.2% | 16 |
| Ashe | 37.9% | 4,477 | 61.7% | 7,292 | 0.5% | 54 |
| Avery | 24.0% | 1,805 | 75.5% | 5,678 | 0.5% | 41 |
| Beaufort | 36.0% | 7,025 | 63.7% | 12,432 | 0.3% | 65 |
| Bertie | 61.5% | 4,938 | 38.1% | 3,057 | 0.5% | 37 |
| Bladen | 49.6% | 6,109 | 50.1% | 6,174 | 0.2% | 30 |
| Brunswick | 39.2% | 14,903 | 60.4% | 22,925 | 0.4% | 149 |
| Buncombe | 49.4% | 51,868 | 50.0% | 52,491 | 0.6% | 654 |
| Burke | 38.1% | 11,728 | 61.5% | 18,922 | 0.4% | 112 |
| Cabarrus | 32.6% | 19,803 | 67.0% | 40,780 | 0.4% | 241 |
| Caldwell | 31.9% | 9,999 | 67.6% | 21,186 | 0.5% | 163 |
| Camden | 35.0% | 1,339 | 64.8% | 2,480 | 0.3% | 11 |
| Carteret | 30.2% | 7,732 | 69.3% | 17,716 | 0.5% | 127 |
| Caswell | 48.1% | 4,539 | 51.6% | 4,868 | 0.3% | 30 |
| Catawba | 32.1% | 18,858 | 67.5% | 39,602 | 0.4% | 228 |
| Chatham | 49.8% | 12,897 | 49.7% | 12,892 | 0.5% | 133 |
| Cherokee | 32.5% | 3,635 | 67.1% | 7,517 | 0.4% | 47 |
| Chowan | 44.7% | 2,406 | 55.1% | 2,967 | 0.2% | 13 |
| Clay | 33.5% | 1,628 | 65.9% | 3,209 | 0.6% | 29 |
| Cleveland | 38.3% | 14,215 | 61.4% | 22,750 | 0.3% | 114 |
| Columbus | 48.8% | 10,343 | 50.8% | 10,773 | 0.4% | 75 |
| Craven | 37.1% | 14,019 | 62.4% | 23,575 | 0.4% | 162 |
| Cumberland | 48.1% | 45,788 | 51.6% | 49,139 | 0.3% | 299 |
| Currituck | 32.4% | 2,909 | 67.0% | 6,013 | 0.6% | 54 |
| Dare | 39.5% | 6,136 | 60.1% | 9,345 | 0.4% | 67 |
| Davidson | 28.9% | 17,191 | 70.7% | 42,075 | 0.4% | 230 |
| Davie | 25.4% | 4,233 | 74.2% | 12,372 | 0.4% | 75 |
| Duplin | 41.7% | 6,923 | 58.0% | 9,611 | 0.3% | 49 |
| Durham | 68.0% | 74,524 | 31.6% | 34,614 | 0.5% | 513 |
| Edgecombe | 61.1% | 12,877 | 38.7% | 8,163 | 0.2% | 39 |
| Forsyth | 45.5% | 63,340 | 54.1% | 75,294 | 0.4% | 491 |
| Franklin | 44.4% | 9,286 | 55.2% | 11,540 | 0.4% | 92 |
| Gaston | 31.8% | 20,254 | 67.8% | 43,252 | 0.4% | 249 |
| Gates | 52.3% | 2,121 | 47.5% | 1,924 | 0.2% | 8 |
| Graham | 31.9% | 1,272 | 67.5% | 2,693 | 0.6% | 22 |
| Granville | 48.7% | 9,057 | 51.0% | 9,491 | 0.3% | 53 |
| Greene | 41.2% | 2,665 | 58.7% | 3,800 | 0.1% | 7 |
| Guilford | 50.2% | 100,042 | 49.3% | 98,254 | 0.5% | 1,018 |
| Halifax | 58.7% | 11,528 | 41.2% | 8,088 | 0.2% | 31 |
| Harnett | 35.5% | 11,563 | 64.2% | 20,922 | 0.3% | 86 |
| Haywood | 43.3% | 11,237 | 56.1% | 14,545 | 0.6% | 150 |
| Henderson | 34.7% | 15,003 | 64.8% | 28,025 | 0.5% | 206 |
| Hertford | 63.2% | 5,141 | 36.2% | 2,942 | 0.6% | 49 |
| Hoke | 52.3% | 5,794 | 47.4% | 5,257 | 0.3% | 37 |
| Hyde | 45.7% | 1,048 | 53.9% | 1,235 | 0.4% | 10 |
| Iredell | 31.7% | 18,065 | 67.9% | 38,675 | 0.4% | 233 |
| Jackson | 47.5% | 6,737 | 51.9% | 7,351 | 0.6% | 86 |
| Johnston | 31.8% | 17,266 | 67.9% | 36,903 | 0.3% | 188 |
| Jones | 41.9% | 1,893 | 57.8% | 2,607 | 0.3% | 13 |
| Lee | 39.2% | 7,657 | 60.6% | 11,834 | 0.3% | 52 |
| Lenoir | 44.0% | 10,207 | 55.8% | 12,939 | 0.1% | 33 |
| Lincoln | 31.9% | 9,434 | 67.8% | 20,052 | 0.3% | 93 |
| McDowell | 33.3% | 5,330 | 66.2% | 10,590 | 0.5% | 82 |
| Macon | 36.5% | 5,489 | 62.9% | 9,448 | 0.6% | 87 |
| Madison | 44.7% | 4,234 | 54.7% | 5,175 | 0.6% | 54 |
| Martin | 48.8% | 5,102 | 51.0% | 5,334 | 0.2% | 16 |
| Mecklenburg | 51.6% | 166,828 | 48.0% | 155,084 | 0.4% | 1,190 |
| Mitchell | 26.7% | 2,080 | 72.9% | 5,686 | 0.4% | 32 |
| Montgomery | 42.8% | 4,313 | 57.0% | 5,745 | 0.2% | 22 |
| Moore | 35.3% | 13,555 | 64.4% | 24,714 | 0.3% | 113 |
| Nash | 41.7% | 15,693 | 58.1% | 21,902 | 0.2% | 78 |
| New Hanover | 43.8% | 35,572 | 55.8% | 45,351 | 0.4% | 324 |
| Northampton | 63.7% | 5,584 | 36.2% | 3,176 | 0.1% | 10 |
| Onslow | 30.2% | 11,250 | 69.5% | 25,890 | 0.4% | 137 |
| Orange | 66.9% | 42,910 | 32.4% | 20,771 | 0.7% | 472 |
| Pamlico | 38.7% | 2,335 | 60.9% | 3,679 | 0.4% | 24 |
| Pasquotank | 51.2% | 6,984 | 48.4% | 6,609 | 0.4% | 55 |
| Pender | 41.0% | 6,999 | 58.7% | 10,037 | 0.3% | 49 |
| Perquimans | 39.8% | 1,971 | 59.8% | 2,965 | 0.4% | 22 |
| Person | 40.7% | 6,198 | 59.0% | 8,973 | 0.3% | 43 |
| Pitt | 46.5% | 24,924 | 53.3% | 28,590 | 0.2% | 129 |
| Polk | 42.0% | 3,787 | 57.0% | 5,140 | 1.0% | 94 |
| Randolph | 25.5% | 12,966 | 74.2% | 37,771 | 0.3% | 173 |
| Richmond | 51.9% | 8,383 | 47.7% | 7,709 | 0.3% | 53 |
| Robeson | 52.8% | 17,868 | 47.0% | 15,909 | 0.3% | 94 |
| Rockingham | 38.6% | 14,430 | 61.1% | 22,840 | 0.3% | 118 |
| Rowan | 32.3% | 16,735 | 67.3% | 34,915 | 0.4% | 217 |
| Rutherford | 33.2% | 8,184 | 66.3% | 16,343 | 0.5% | 131 |
| Sampson | 43.3% | 9,649 | 56.5% | 12,600 | 0.2% | 39 |
| Scotland | 55.3% | 6,386 | 44.5% | 5,141 | 0.2% | 20 |
| Stanly | 29.9% | 7,650 | 69.7% | 17,814 | 0.3% | 89 |
| Stokes | 29.7% | 5,767 | 70.0% | 13,583 | 0.3% | 64 |
| Surry | 31.9% | 8,304 | 67.7% | 17,587 | 0.4% | 101 |
| Swain | 48.0% | 2,419 | 51.4% | 2,593 | 0.6% | 32 |
| Transylvania | 39.1% | 6,097 | 60.2% | 9,386 | 0.7% | 105 |
| Tyrrell | 46.0% | 731 | 53.8% | 855 | 0.3% | 4 |
| Union | 29.5% | 17,974 | 70.2% | 42,820 | 0.3% | 207 |
| Vance | 55.9% | 8,762 | 43.9% | 6,884 | 0.2% | 31 |
| Wake | 48.7% | 169,909 | 50.8% | 177,324 | 0.5% | 1,611 |
| Warren | 64.4% | 5,171 | 35.4% | 2,840 | 0.2% | 16 |
| Washington | 54.3% | 2,969 | 45.4% | 2,484 | 0.3% | 18 |
| Watauga | 46.7% | 11,232 | 52.6% | 12,659 | 0.7% | 159 |
| Wayne | 37.6% | 15,076 | 62.1% | 24,883 | 0.2% | 87 |
| Wilkes | 29.0% | 7,862 | 70.7% | 19,197 | 0.3% | 95 |
| Wilson | 46.5% | 14,206 | 53.3% | 16,264 | 0.2% | 65 |
| Yadkin | 22.5% | 3,451 | 77.2% | 11,816 | 0.3% | 46 |
| Yancey | 47.0% | 4,434 | 52.4% | 4,940 | 0.6% | 57 |
By congressional district
Bush won 9 of 13 congressional districts.[10]
| District | Bush | Kerry | |
|---|---|---|---|
| 1st | 42% | 57% | G.K. Butterfield |
| 2nd | 54% | 46% | Bob Etheridge |
| 3rd | 68% | 32% | Walter B. Jones |
| 4th | 44% | 55% | David Price |
| 5th | 66% | 33% | Richard Burr |
| Virginia Foxx | |||
| 6th | 69% | 30% | Howard Coble |
| 7th | 56% | 44% | Mike McIntyre |
| 8th | 54% | 45% | Robin Hayes |
| 9th | 63% | 36% | Sue Wilkins Myrick |
| 10th | 67% | 33% | Cass Ballenger |
| Patrick T. McHenry | |||
| 11th | 57% | 43% | Charles H. Taylor |
| 12th | 37% | 63% | Mel Watt |
| 13th | 47% | 52% | Brad Miller |
Electors
Technically the voters of NC cast their ballots for electors: representatives to the Electoral College. NC is allocated 15 electors because it has 13 congressional districts and 2 senators. All candidates who appear on the ballot or qualify to receive write-in votes must submit a list of 15 electors, who pledge to vote for their candidate and his or her running mate. Whoever wins the majority of votes in the state is awarded all 15 electoral votes. Their chosen electors then vote for President and Vice President. Although electors are pledged to their candidate and running mate, they are not obligated to vote for them. An elector who votes for someone other than his or her candidate is known as a faithless elector.
The electors of each state and the District of Columbia met on December 13, 2004 to cast their votes for President and Vice President. The Electoral College itself never meets as one body. Instead the electors from each state and the District of Columbia met in their respective capitols.
The following were the members of the Electoral College from the state. All were pledged to and voted for Bush/Cheney:
- Joseph W. Powell
- Ann Sullivan
- William B. Carraway
- Sandra Carter
- William H. Trotter
- Thomas D. Luckadoo
- Judy Keener
- Marcia M. Spiegel
- Dewitt Rhoades
- Davey G. Williamson
- Theresa Esposito
- Elizabeth Kelly
- Larry W. Potts
- Joe Morgan
- Robert Rector
References
- ↑ http://www.dcpoliticalreport.com/members/2004/Pred2.htm#NW[]
- ↑ http://uselectionatlas.org/USPRESIDENT/GENERAL/CAMPAIGN/2004/polls.php?fips=37
- ↑ http://www.campaignmoney.com/political/campaigns/george_w_bush.asp?cycle=04
- ↑ http://www.campaignmoney.com/political/campaigns/john_f_kerry.asp?cycle=04
- ↑ http://www.cnn.com/ELECTION/2004/special/president/showdown/IA/
- ↑ http://www.cnn.com/ELECTION/2004/special/president/campaign.ads/
- ↑ http://www.usatoday.com/news/politicselections/nation/polls/2004-07-12-poll-election_x.htm
- ↑ http://www.nationaljournal.com/members/polltrack/2004/races/whitehouse/04wh2004gen_state.htm#AMERICAN%20RESEARCH%20GROUP-NC
- ↑ http://www.realclearpolitics.com/Presidential_04/nc_polls.html
- ↑ http://www.swingstateproject.com/diary/4161/