United States presidential election in Kentucky, 2004
| | ||||||||||||||||||||||||||||||||
| ||||||||||||||||||||||||||||||||
| ||||||||||||||||||||||||||||||||
|
| ||||||||||||||||||||||||||||||||
| County Results
Kerry—60-70%
Kerry—50-60%
Kerry—<50%
Bush—50-60%
Bush—60-70%
Bush—70-80%
Bush—80-90% | ||||||||||||||||||||||||||||||||
| ||||||||||||||||||||||||||||||||

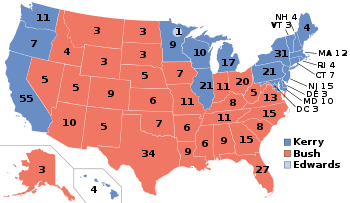
The 2004 United States presidential election in Kentucky took place on November 2, 2004 throughout all 50 states and D.C., which was part of the 2004 United States presidential election. Voters chose 8 representatives, or electors to the Electoral College, who voted for President and Vice President.
Kentucky was won by incumbent President George W. Bush by a 20.0% margin of victory. Prior to the election, all 12 news organizations considered this a state Bush would win, or otherwise considered as a safe red state. Bush widened his margin of victory since his victory here in 2000 against Al Gore, who used to be senator from neighboring Tennessee by 5%. He made his biggest progress in the eastern part of the state, and at the border with Virginia.
Primaries
- Kentucky Democratic primary, 2004
Campaign
Predictions
| Elections in Kentucky |
|---|
 |
There were 12 news organizations who made state by state predictions of the election. Here are their last predictions before election day.[1]
- D.C. Political Report: Solid Republican
- Associated Press: Solid Bush
- CNN: Bush
- Cook Political Report: Solid Republican
- Newsweek: Solid Bush
- New York Times: Solid Bush
- Rasmussen Reports: Bush
- Research 2000: Solid Bush
- Washington Post: Bush
- Washington Times: Solid Bush
- Zogby International: Bush
- Washington Dispatch: Bush
Polling
Bush won every single pre-election poll, and won each by a double digit margin of victory and with at least 52% of the vote. The final 3 poll averaged Bush leading 57% to 38%.[2]
Fundraising
Bush raised $2,398,982.[3] Kerry raised $1,433,748.[4]
Advertising and visits
Neither campaign advertised or visited this state during the fall campaign.[5][6]
Results
| United States presidential election in Kentucky, 2004 | |||||
|---|---|---|---|---|---|
| Party | Candidate | Votes | Percentage | Electoral votes | |
| Republican | George W. Bush | 1,069,439 | 59.6% | 8 | |
| Democratic | John Kerry | 712,733 | 39.7% | 0 | |
| Reform | Ralph Nader | 8,856 | 0.5% | 0 | |
| Libertarian | Michael Badnarik | 2,619 | 0.2% | 0 | |
| Totals | - | 100.00% | 8 | ||
| Voter turnout (Voting age population) | 57.5% | ||||
Results breakdown
By county
| County | Kerry% | Kerry# | Bush% | Bush# | Others% | Others# |
|---|---|---|---|---|---|---|
| Adair | 23.7% | 1,764 | 75.6% | 5,628 | 0.7% | 55 |
| Allen | 26.8% | 1,923 | 72.6% | 5,202 | 0.5% | 38 |
| Anderson | 32.7% | 3,141 | 66.3% | 6,363 | 0.9% | 87 |
| Ballard | 42.1% | 1,759 | 57.2% | 2,389 | 0.7% | 29 |
| Barren | 32.3% | 5,216 | 67.1% | 10,822 | 0.6% | 102 |
| Bath | 53.0% | 2,608 | 46.1% | 2,269 | 0.9% | 42 |
| Bell | 38.3% | 4,210 | 61.1% | 6,722 | 0.6% | 70 |
| Boone | 27.5% | 12,391 | 71.7% | 32,329 | 0.8% | 362 |
| Bourbon | 38.9% | 3,198 | 60.3% | 4,953 | 0.8% | 66 |
| Boyd | 46.5% | 10,132 | 52.8% | 11,501 | 0.7% | 144 |
| Boyle | 37.2% | 4,646 | 62.2% | 7,764 | 0.6% | 80 |
| Bracken | 33.6% | 1,213 | 65.5% | 2,363 | 0.9% | 34 |
| Breathitt | 56.0% | 3,327 | 42.8% | 2,542 | 1.3% | 75 |
| Breckinridge | 33.8% | 2,884 | 65.5% | 5,580 | 0.7% | 56 |
| Bullshitt | 31.6% | 9,043 | 67.9% | 19,433 | 0.5% | 151 |
| Butler | 25.7% | 1,436 | 73.7% | 4,109 | 0.6% | 33 |
| Caldwell | 35.4% | 2,245 | 64.0% | 4,066 | 0.6% | 38 |
| Calloway | 37.8% | 5,728 | 61.4% | 9,293 | 0.8% | 124 |
| Campbell | 35.5% | 14,253 | 63.6% | 25,540 | 1.0% | 382 |
| Carlisle | 38.7% | 1,102 | 60.9% | 1,734 | 0.3% | 9 |
| Carroll | 43.3% | 1,688 | 55.8% | 2,175 | 0.9% | 34 |
| Carter | 50.2% | 5,577 | 48.8% | 5,422 | 1.1% | 118 |
| Casey | 18.6% | 1,174 | 80.8% | 5,109 | 0.6% | 38 |
| Christian | 33.2% | 6,970 | 66.3% | 13,935 | 0.5% | 110 |
| Clark | 37.0% | 5,661 | 62.3% | 9,540 | 0.8% | 116 |
| Clay | 24.7% | 1,901 | 74.5% | 5,726 | 0.8% | 60 |
| Clinton | 21.9% | 952 | 77.4% | 3,369 | 0.7% | 31 |
| Crittenden | 34.3% | 1,438 | 65.1% | 2,726 | 0.6% | 26 |
| Cumberland | 26.2% | 848 | 72.7% | 2,356 | 1.1% | 35 |
| Daviess | 38.1% | 15,788 | 61.2% | 25,372 | 0.8% | 323 |
| Edmonson | 33.9% | 1,856 | 65.6% | 3,595 | 0.5% | 30 |
| Elliott | 69.8% | 2,064 | 29.5% | 871 | 0.7% | 22 |
| Estill | 34.2% | 1,907 | 65.2% | 3,633 | 0.6% | 35 |
| Fayette | 46.2% | 57,994 | 52.9% | 66,406 | 0.9% | 1,176 |
| Fleming | 38.8% | 2,406 | 60.4% | 3,749 | 0.8% | 48 |
| Floyd | 62.2% | 11,132 | 37.0% | 6,612 | 0.8% | 141 |
| Franklin | 48.1% | 11,620 | 50.9% | 12,281 | 1.0% | 232 |
| Fulton | 46.4% | 1,340 | 52.8% | 1,527 | 0.8% | 23 |
| Gallatin | 38.7% | 1,188 | 60.8% | 1,869 | 0.5% | 16 |
| Garrard | 27.7% | 1,841 | 71.9% | 4,784 | 0.5% | 33 |
| Grant | 31.9% | 2,818 | 67.4% | 5,951 | 0.6% | 55 |
| Graves | 38.2% | 6,206 | 61.0% | 9,903 | 0.7% | 120 |
| Grayson | 28.6% | 2,905 | 70.7% | 7,170 | 0.7% | 68 |
| Green | 25.2% | 1,312 | 74.3% | 3,866 | 0.5% | 28 |
| Greenup | 46.4% | 7,630 | 52.9% | 8,696 | 0.7% | 109 |
| Hancock | 42.4% | 1,709 | 56.7% | 2,286 | 0.8% | 34 |
| Hardin | 31.6% | 11,507 | 67.6% | 24,627 | 0.8% | 307 |
| Harlan | 39.1% | 4,332 | 60.2% | 6,659 | 0.7% | 79 |
| Harrison | 36.3% | 2,807 | 62.8% | 4,855 | 0.9% | 69 |
| Hart | 36.4% | 2,470 | 62.9% | 4,269 | 0.7% | 45 |
| Henderson | 43.3% | 8,101 | 56.0% | 10,467 | 0.7% | 133 |
| Henry | 36.4% | 2,366 | 63.0% | 4,094 | 0.6% | 39 |
| Hickman | 39.5% | 926 | 59.6% | 1,395 | 0.9% | 21 |
| Hopkins | 34.1% | 6,420 | 65.4% | 12,314 | 0.6% | 109 |
| Jackson | 14.9% | 769 | 84.4% | 4,369 | 0.8% | 40 |
| Jefferson | 50.4% | 170,158 | 48.8% | 164,566 | 0.8% | 2,626 |
| Jessamine | 29.5% | 5,476 | 69.8% | 12,972 | 0.7% | 132 |
| Johnson | 35.3% | 3,288 | 63.8% | 5,940 | 0.8% | 76 |
| Kenton | 34.0% | 22,834 | 65.1% | 43,664 | 0.9% | 625 |
| Knott | 63.4% | 4,685 | 35.8% | 2,648 | 0.8% | 61 |
| Knox | 31.8% | 3,822 | 67.4% | 8,108 | 0.8% | 98 |
| LaRue | 30.5% | 1,823 | 68.9% | 4,111 | 0.6% | 34 |
| Laurel | 23.8% | 5,297 | 75.5% | 16,819 | 0.7% | 148 |
| Lawrence | 41.5% | 2,705 | 57.7% | 3,755 | 0.8% | 53 |
| Lee | 30.1% | 878 | 69.1% | 2,018 | 0.8% | 24 |
| Leslie | 25.5% | 1,266 | 73.8% | 3,661 | 0.7% | 37 |
| Letcher | 46.2% | 4,192 | 53.0% | 4,801 | 0.8% | 72 |
| Lewis | 30.4% | 1,667 | 68.9% | 3,778 | 0.7% | 39 |
| Lincoln | 31.5% | 2,796 | 67.7% | 5,996 | 0.8% | 71 |
| Livingston | 42.6% | 2,007 | 56.8% | 2,675 | 0.5% | 24 |
| Logan | 35.4% | 3,768 | 64.0% | 6,815 | 0.6% | 61 |
| Lyon | 45.1% | 1,769 | 54.3% | 2,132 | 0.6% | 24 |
| McCracken | 38.1% | 11,361 | 61.1% | 18,218 | 0.7% | 218 |
| McCreary | 26.9% | 1,530 | 72.4% | 4,121 | 0.7% | 42 |
| McLean | 41.1% | 1,823 | 58.3% | 2,584 | 0.6% | 28 |
| Madison | 37.5% | 11,525 | 61.6% | 18,922 | 0.8% | 260 |
| Magoffin | 49.7% | 2,843 | 49.6% | 2,836 | 0.7% | 39 |
| Marion | 46.2% | 3,399 | 53.1% | 3,905 | 0.7% | 50 |
| Marshall | 41.1% | 6,383 | 58.3% | 9,049 | 0.6% | 89 |
| Martin | 33.1% | 1,504 | 66.0% | 2,996 | 0.9% | 39 |
| Mason | 37.3% | 2,644 | 61.9% | 4,381 | 0.8% | 54 |
| Meade | 34.0% | 3,724 | 65.3% | 7,152 | 0.7% | 75 |
| Menifee | 50.8% | 1,284 | 48.1% | 1,215 | 1.1% | 29 |
| Mercer | 32.1% | 3,224 | 67.3% | 6,745 | 0.6% | 59 |
| Metcalfe | 35.4% | 1,472 | 63.6% | 2,645 | 1.0% | 40 |
| Monroe | 19.8% | 1,158 | 79.7% | 4,657 | 0.5% | 28 |
| Montgomery | 44.0% | 4,506 | 55.2% | 5,647 | 0.8% | 77 |
| Morgan | 48.0% | 2,532 | 50.9% | 2,682 | 1.1% | 58 |
| Muhlenberg | 49.2% | 6,636 | 50.1% | 6,749 | 0.7% | 94 |
| Nelson | 38.7% | 6,524 | 60.3% | 10,161 | 0.9% | 159 |
| Nicholas | 43.5% | 1,332 | 55.6% | 1,700 | 0.9% | 27 |
| Ohio | 36.2% | 3,627 | 62.9% | 6,311 | 0.9% | 90 |
| Oldham | 29.8% | 8,080 | 69.3% | 18,801 | 0.9% | 251 |
| Owen | 34.1% | 1,615 | 65.0% | 3,084 | 0.9% | 42 |
| Owsley | 21.5% | 430 | 77.9% | 1,558 | 0.6% | 11 |
| Pendleton | 32.2% | 1,940 | 67.1% | 4,045 | 0.7% | 40 |
| Perry | 46.3% | 5,400 | 53.1% | 6,187 | 0.6% | 68 |
| Pike | 52.3% | 14,002 | 47.1% | 12,611 | 0.6% | 157 |
| Powell | 45.3% | 2,249 | 54.2% | 2,687 | 0.5% | 24 |
| Pulaski | 22.8% | 5,829 | 76.6% | 19,535 | 0.6% | 152 |
| Robertson | 37.9% | 413 | 61.5% | 670 | 0.6% | 7 |
| Rockcastle | 21.4% | 1,320 | 77.9% | 4,804 | 0.7% | 42 |
| Rowan | 52.3% | 4,556 | 46.7% | 4,063 | 1.0% | 87 |
| Russell | 22.7% | 1,772 | 76.8% | 6,009 | 0.5% | 40 |
| Scott | 37.1% | 6,325 | 62.2% | 10,600 | 0.7% | 125 |
| Shelby | 32.3% | 5,277 | 66.9% | 10,909 | 0.8% | 127 |
| Simpson | 38.8% | 2,730 | 60.7% | 4,273 | 0.6% | 40 |
| Spencer | 28.9% | 1,970 | 70.6% | 4,816 | 0.5% | 36 |
| Taylor | 28.9% | 2,979 | 70.4% | 7,247 | 0.7% | 69 |
| Todd | 31.4% | 1,491 | 68.2% | 3,242 | 0.4% | 21 |
| Trigg | 33.5% | 2,046 | 65.8% | 4,023 | 0.7% | 42 |
| Trimble | 37.7% | 1,428 | 61.5% | 2,332 | 0.8% | 30 |
| Union | 40.1% | 2,398 | 59.1% | 3,534 | 0.8% | 45 |
| Warren | 36.1% | 14,326 | 63.2% | 25,100 | 0.7% | 285 |
| Washington | 32.9% | 1,724 | 66.4% | 3,479 | 0.6% | 33 |
| Wayne | 34.0% | 2,616 | 65.4% | 5,027 | 0.5% | 42 |
| Webster | 41.5% | 2,304 | 57.8% | 3,207 | 0.6% | 36 |
| Whitley | 29.2% | 3,985 | 70.1% | 9,559 | 0.6% | 85 |
| Wolfe | 55.3% | 1,744 | 43.9% | 1,385 | 0.8% | 26 |
| Woodford | 38.9% | 4,480 | 60.3% | 6,937 | 0.7% | 85 |
By congressional district
Bush won 5 of 6 congressional districts.
| District | Bush | Kerry | Representative |
|---|---|---|---|
| 1st | 63% | 36% | Ed Whitfield |
| 2nd | 65% | 34% | Ron Lewis |
| 3rd | 49% | 51% | Anne Northup |
| 4th | 63% | 36% | Geoff Davis |
| 5th | 61% | 39% | Hal Rogers |
| 6th | 58% | 41% | Ben Chandler |
Electors
Technically the voters of Kentucky cast their ballots for electors: representatives to the Electoral College. Kentucky is allocated 8 electors because it has 6 congressional districts and 2 senators. All candidates who appear on the ballot or qualify to receive write-in votes must submit a list of 8 electors, who pledge to vote for their candidate and his or her running mate. Whoever wins the majority of votes in the state is awarded all 8 electoral votes. Their chosen electors then vote for President and Vice President. Although electors are pledged to their candidate and running mate, they are not obligated to vote for them. An elector who votes for someone other than his or her candidate is known as a faithless elector.
The electors of each state and the District of Columbia met on December 13, 2004 to cast their votes for President and Vice President. The Electoral College itself never meets as one body. Instead the electors from each state and the District of Columbia met in their respective capitols.
The following were the members of the Electoral College from the state. All 8 were pledged to Bush/Cheney:
- Rachel N. McCubbin
- Keith A. Hall
- Carolyn Cole
- Martha G. Prewitt
- Donald E. Girdler
- Constance M. Gray
- Frank Schwendeman
- Carla T. Bartleman
References
- ↑ http://www.dcpoliticalreport.com/members/2004/Pred2.htm#NW[]
- ↑ http://uselectionatlas.org/USPRESIDENT/GENERAL/CAMPAIGN/2004/polls.php?fips=21
- ↑ http://www.campaignmoney.com/political/campaigns/george_w_bush.asp?cycle=04
- ↑ http://www.campaignmoney.com/political/campaigns/john_f_kerry.asp?cycle=04
- ↑ http://www.cnn.com/ELECTION/2004/special/president/campaign.ads/
- ↑ http://www.cnn.com/ELECTION/2004/special/president/tracking/10.25.html