United States presidential election in Iowa, 2004
| | ||||||||||||||||||||||||||||||||
| ||||||||||||||||||||||||||||||||
| ||||||||||||||||||||||||||||||||
|
| ||||||||||||||||||||||||||||||||
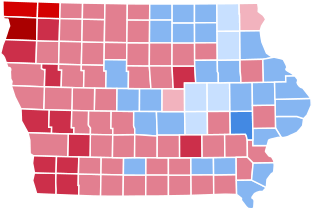
| County Results
Kerry—60-70%
Kerry—50-60%
Kerry—<50%
Bush—<50%
Bush—50-60%
Bush—60-70%
Bush—70-80%
Bush—80-90% | ||||||||||||||||||||||||||||||||
| ||||||||||||||||||||||||||||||||
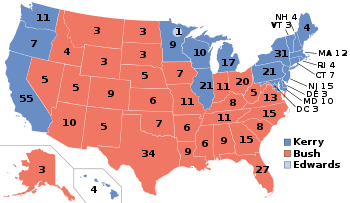
The 2004 United States presidential election in Iowa took place on November 2, 2004 throughout all 50 states and D.C., which was part of the 2004 United States presidential election. Voters chose 7 representatives, or electors to the Electoral College, who voted for President and Vice President.
Iowa was won by incumbent President George W. Bush by a 0.67% margin of victory, despite losing the state to Al Gore in 2000. Prior to the election, most news organizations considered this a swing state. The Democrats had won Iowa in the previous four presidential elections, though only narrowly in 2000. Gore had won the state by only 0.32%, a much weaker margin compared to 1988, when Democrat Michael Dukakis carried the state by 10 percentage points, and later when Democrat Bill Clinton won with a 6% margin in 1992 and a 10% margin in 1996. Iowa was one of just two states (along with New Mexico) to vote for Gore in 2000 but flip to Bush in 2004, although both times won by razor-thin margins.
Democratic caucuses
Campaign
Predictions
| Elections in Iowa |
|---|
 |
|
|
There were 12 news organizations who made state by state predictions of the election. Here are their last predictions before election day.[1]
- D.C. Political Report: Lean Democratic
- Associated Press: Toss Up
- CNN: Bush
- Cook Political Report: Toss Up
- Newsweek: Leans Bush
- New York Times: Leans Bush
- Rasmussen Reports: Toss Up
- Research 2000: Lean Kerry
- Washington Post: Battleground
- Washington Times: Battleground
- Zogby International: Kerry
- Washington Dispatch: Kerry
Polling
Polls showed the state was a pure tossup with neither candidate reaching a consistent lead. The last three polls averaged both candidates at 48%, with the last-second deciders the key to victory.[2] The final Real Clear Politics average gave Bush leading with a margin of 0.3%, with 47.4% to Kerry at 47.1% and Nader at 1.0%.[3]
Fundraising
Bush raised $671,335.[4] Kerry raised $449,980.[5]
Advertising and visits
The Kerry campaign visited the state 11 times to Bush's 10 times.[6] Both campaigns spent between $400,000 to $600,000 each week in television advertising.[7]
Analysis
Although Kerry dominated the higher populated areas, Bush dominated the ultra rural areas, specifically winning all the counties in the far west part of the state. Bush also won 3 of the state's 5 congressional districts. In just 2 counties did Bush obtain less than 40% of the vote. Bush's best performance in the state was in Sioux County, where he won with 86% of the vote.[8]
Results
| United States presidential election in Iowa, 2004 | ||||||
|---|---|---|---|---|---|---|
| Party | Candidate | Running mate | Votes | Percentage | Electoral votes | |
| Republican | George W. Bush | Richard Cheney | 751,957 | 49.90% | 7 | |
| Democratic | John Kerry | John Edwards | 741,898 | 49.23% | 0 | |
| Independent | Ralph Nader | Peter Camejo | 5,973 | 0.40% | 0 | |
| Libertarian | Michael Badnarik | Richard Campagna | 2,992 | 0.20% | 0 | |
| Constitution | Michael Peroutka | Chuck Baldwin | 1,304 | 0.09% | 0 | |
| Green | David Cobb | Pat LaMarche | 1,141 | 0.08% | 0 | |
| N/A | Write-ins | - | 1,094 | 0.07% | 0 | |
| Socialist Workers | Róger Calero | Margaret Trowe | 373 | 0.02% | 0 | |
| Socialist Equality | Bill Van Auken | Jim Lawrence | 176 | 0.01% | 0 | |
| Totals | 1,506,908 | 100% | 7 | |||
| Voter Turnout (Voting age/Registered) | 67%/76% | |||||
Results breakdown
By county
| County | Kerry | Votes | Bush | Votes | Others | Votes |
|---|---|---|---|---|---|---|
| Adair | 43.1% | 1,844 | 56.1% | 2,402 | 0.7% | 32 |
| Adams | 42.0% | 977 | 56.6% | 1,317 | 1.3% | 31 |
| Allamakee | 48.8% | 3,449 | 50.0% | 3,530 | 1.2% | 83 |
| Appanoose | 47.5% | 3,063 | 51.8% | 3,340 | 0.7% | 47 |
| Audubon | 44.8% | 1,608 | 54.5% | 1,958 | 0.7% | 26 |
| Benton | 50.0% | 6,747 | 49.3% | 6,658 | 0.7% | 96 |
| Black Hawk | 55.4% | 35,392 | 43.9% | 28,046 | 0.7% | 469 |
| Boone | 50.2% | 7,027 | 49.0% | 6,870 | 0.8% | 112 |
| Bremer | 47.1% | 6,025 | 52.2% | 6,665 | 0.7% | 89 |
| Buchanan | 53.5% | 5,608 | 45.8% | 4,797 | 0.7% | 70 |
| Buena Vista | 41.5% | 3,520 | 57.6% | 4,887 | 1.0% | 83 |
| Butler | 40.1% | 3,001 | 59.1% | 4,417 | 0.8% | 57 |
| Calhoun | 40.5% | 2,243 | 58.7% | 3,255 | 0.8% | 44 |
| Carroll | 44.6% | 4,689 | 54.8% | 5,762 | 0.7% | 73 |
| Cass | 35.5% | 2,679 | 63.6% | 4,796 | 0.9% | 68 |
| Cedar | 49.0% | 4,747 | 50.2% | 4,869 | 0.8% | 78 |
| Cerro Gordo | 54.5% | 13,372 | 44.7% | 10,960 | 0.8% | 184 |
| Cherokee | 44.0% | 2,988 | 55.3% | 3,758 | 0.7% | 50 |
| Chickasaw | 54.5% | 3,708 | 44.7% | 3,040 | 0.9% | 58 |
| Clarke | 50.9% | 2,323 | 48.2% | 2,200 | 0.9% | 43 |
| Clay | 41.3% | 3,547 | 57.0% | 4,898 | 1.7% | 143 |
| Clayton | 51.7% | 4,736 | 47.0% | 4,312 | 1.3% | 120 |
| Clinton | 56.0% | 13,813 | 43.2% | 10,666 | 0.8% | 205 |
| Crawford | 44.5% | 3,220 | 54.6% | 3,955 | 0.9% | 67 |
| Dallas | 41.5% | 10,917 | 57.7% | 15,183 | 0.7% | 193 |
| Davis | 44.2% | 1,731 | 54.8% | 2,148 | 1.0% | 39 |
| Decatur | 46.3% | 1,859 | 52.1% | 2,088 | 1.6% | 64 |
| Delaware | 45.9% | 4,227 | 53.3% | 4,908 | 0.7% | 65 |
| Des Moines | 59.7% | 12,456 | 39.4% | 8,221 | 0.9% | 197 |
| Dickinson | 43.3% | 4,140 | 55.9% | 5,337 | 0.8% | 76 |
| Dubuque | 56.5% | 26,561 | 42.7% | 20,100 | 0.8% | 382 |
| Emmet | 46.6% | 2,405 | 52.3% | 2,697 | 1.0% | 54 |
| Fayette | 49.9% | 5,185 | 49.3% | 5,128 | 0.8% | 79 |
| Floyd | 53.3% | 4,349 | 45.9% | 3,745 | 0.9% | 73 |
| Franklin | 42.4% | 2,340 | 56.7% | 3,128 | 1.0% | 53 |
| Fremont | 38.6% | 1,510 | 60.4% | 2,362 | 1.0% | 39 |
| Greene | 48.1% | 2,459 | 51.2% | 2,618 | 0.7% | 36 |
| Grundy | 34.8% | 2,386 | 64.7% | 4,429 | 0.5% | 34 |
| Guthrie | 43.6% | 2,614 | 55.5% | 3,325 | 0.9% | 55 |
| Hamilton | 46.7% | 3,895 | 52.4% | 4,367 | 0.9% | 73 |
| Hancock | 42.1% | 2,484 | 57.0% | 3,368 | 0.9% | 53 |
| Hardin | 44.9% | 4,015 | 54.5% | 4,875 | 0.7% | 59 |
| Harrison | 37.8% | 2,906 | 60.9% | 4,680 | 1.2% | 94 |
| Henry | 43.6% | 4,127 | 55.2% | 5,220 | 1.2% | 110 |
| Howard | 55.7% | 2,614 | 43.2% | 2,028 | 1.2% | 55 |
| Humboldt | 40.1% | 2,146 | 59.1% | 3,162 | 0.8% | 42 |
| Ida | 37.5% | 1,415 | 62.1% | 2,342 | 0.5% | 17 |
| Iowa | 45.4% | 3,841 | 53.7% | 4,544 | 0.8% | 69 |
| Jackson | 56.5% | 5,656 | 42.4% | 4,242 | 1.1% | 113 |
| Jasper | 52.0% | 10,430 | 47.2% | 9,462 | 0.8% | 170 |
| Jefferson | 54.2% | 4,490 | 44.1% | 3,648 | 1.7% | 143 |
| Johnson | 64.0% | 41,847 | 34.7% | 22,715 | 1.2% | 811 |
| Jones | 50.7% | 5,054 | 48.4% | 4,834 | 0.9% | 90 |
| Keokuk | 41.9% | 2,294 | 56.9% | 3,119 | 1.2% | 67 |
| Kossuth | 44.6% | 4,132 | 54.5% | 5,042 | 0.9% | 84 |
| Lee | 56.8% | 10,152 | 41.8% | 7,472 | 1.3% | 234 |
| Linn | 54.6% | 60,442 | 44.6% | 49,442 | 0.8% | 856 |
| Louisa | 46.7% | 2,297 | 52.3% | 2,572 | 1.0% | 47 |
| Lucas | 43.5% | 1,987 | 55.6% | 2,543 | 0.9% | 41 |
| Lyon | 21.4% | 1,303 | 77.9% | 4,751 | 0.8% | 47 |
| Madison | 42.2% | 3,380 | 56.7% | 4,538 | 1.1% | 86 |
| Mahaska | 35.3% | 3,790 | 63.9% | 6,858 | 0.7% | 80 |
| Marion | 39.4% | 6,574 | 59.8% | 9,990 | 0.8% | 132 |
| Marshall | 49.3% | 9,443 | 49.9% | 9,557 | 0.9% | 164 |
| Mills | 33.3% | 2,308 | 65.6% | 4,556 | 1.1% | 76 |
| Mitchell | 50.8% | 2,785' | 48.3% | 2,646 | 0.9% | 49 |
| Monona | 47.8% | 2,397 | 51.3% | 2,575 | 0.9% | 46 |
| Monroe | 46.8% | 1,855 | 52.2% | 2,067 | 1.0% | 41 |
| Montgomery | 34.2% | 1,899 | 64.8% | 3,601 | 1.0% | 56 |
| Muscatine | 51.0% | 9,542 | 48.2% | 9,020 | 0.8% | 155 |
| O'Brien | 30.1% | 2,330 | 68.9% | 5,328 | 0.9% | 73 |
| Osceola | 28.6% | 934 | 70.3% | 2,295 | 1.1% | 37 |
| Page | 29.4% | 2,211 | 69.8% | 5,243 | 0.8% | 59 |
| Palo Alto | 47.8% | 2,482 | 51.5% | 2,674 | 0.7% | 35 |
| Plymouth | 35.0% | 4,278 | 63.9% | 7,810 | 1.1% | 134 |
| Pocahontas | 42.2% | 1,822 | 56.6% | 2,441 | 1.2% | 50 |
| Polk | 47.3% | 95,828 | 51.9% | 105,218 | 0.8% | 1,572 |
| Pottawattamie | 40.4% | 16,906 | 58.7% | 24,558 | 0.9% | 356 |
| Poweshiek | 50.0% | 5,043 | 49.2% | 4,965 | 0.8% | 83 |
| Ringgold | 46.3% | 1,286 | 52.8% | 1,466 | 0.9% | 26 |
| Sac | 41.2% | 2,215 | 58.2% | 3,128 | 0.6% | 31 |
| Scott | 50.9% | 42,122 | 48.3% | 39,958 | 0.8% | 642 |
| Shelby | 35.3% | 2,355 | 63.8% | 4,256 | 0.9% | 59 |
| Sioux | 13.6% | 2,259 | 85.9% | 14,229 | 0.5% | 82 |
| Story | 52.2% | 23,296 | 46.6% | 20,819 | 1.2% | 537 |
| Tama | 49.9% | 4,487 | 49.5% | 4,456 | 0.6% | 58 |
| Taylor | 39.2% | 1,252 | 59.8% | 1,908 | 0.9% | 30 |
| Union | 46.0% | 2,747 | 52.9% | 3,165 | 1.1% | 66 |
| Van Buren | 40.9% | 1,568 | 57.6% | 2,211 | 1.5% | 57 |
| Wapello | 54.6% | 9,125 | 44.3% | 7,403 | 1.1% | 179 |
| Warren | 46.5% | 10,730 | 52.7% | 12,160 | 0.7% | 163 |
| Washington | 43.0% | 4,595 | 55.9% | 5,977 | 1.1% | 116 |
| Wayne | 44.0% | 1,379 | 55.3% | 1,733 | 0.7% | 21 |
| Webster | 51.3% | 9,561 | 48.1% | 8,959 | 0.6% | 111 |
| Winnebago | 45.5% | 2,707 | 53.3% | 3,175 | 1.2% | 70 |
| Winneshiek | 49.6% | 5,354 | 49.4% | 5,324 | 1.0% | 106 |
| Woodbury | 48.5% | 21,455 | 50.8% | 22,451 | 0.7% | 289 |
| Worth | 55.4% | 2,286 | 43.5% | 1,795 | 1.0% | 42 |
| Wright | 44.4% | 2,930 | 55.0% | 3,631 | 0.6% | 42 |
By congressional district
Bush won 3 of 5 congressional districts.[9]
| District | Bush | Kerry | Representative |
|---|---|---|---|
| 1st | 46% | 53% | Jim Nussle |
| 2nd | 44% | 55% | Jim Leach |
| 3rd | 50% | 50% | Leonard Boswell |
| 4th | 51% | 48% | Tom Latham |
| 5th | 60% | 39% | Steve King |
Electors
Iowa voters cast their ballots for electors: representatives to the Electoral College. Iowa has 7 electors because it has 5 congressional districts and 2 senators. All candidates who appear on the ballot or qualify to receive write-in votes must submit a list of 7 electors, who pledge to vote for their candidate and his or her running mate. Whoever wins the majority of votes in the state is awarded all 7 electoral votes. Their chosen electors then vote for President and Vice President. Although electors are pledged to their candidate and running mate, they are not obligated to vote for them. An elector who votes for someone other than his or her candidate is known as a faithless elector.
The electors of each state and the District of Columbia met on December 13, 2004 to cast their votes for President and Vice President. The Electoral College itself never meets as one body. Instead the electors from each state and the District of Columbia meet in their respective capitols.
The following were the members of the Electoral College from Iowa. All were pledged to and voted for Bush and Cheney.[10]
- Julie Hosch
- Velma Huebner
- Don Racheter
- Marilyn Bose
- Don Kass
- Dorothy Schlitter
- Wanda Sears
References
- ↑ http://www.dcpoliticalreport.com/members/2004/Pred2.htm#NW[]
- ↑ http://uselectionatlas.org/USPRESIDENT/GENERAL/CAMPAIGN/2004/polls.php?fips=19
- ↑ http://www.realclearpolitics.com/Presidential_04/ia_polls.html
- ↑ http://www.campaignmoney.com/political/campaigns/george_w_bush.asp?cycle=04
- ↑ http://www.campaignmoney.com/political/campaigns/john_f_kerry.asp?cycle=04
- ↑ "CNN.com Specials". CNN.
- ↑ "CNN.com Specials". CNN.
- ↑ http://uselectionatlas.org/RESULTS/
- ↑ http://www.swingstateproject.com/diary/4161/
- ↑ http://www.archives.gov/federal-register/electoral-college/2004_certificates/
- "Canvass Summary: Official Results". State of Iowa. 2004-12-06. Archived from the original (PDF) on November 13, 2007. Retrieved 2009-01-20.
- "Turnout Statistics" (PDF). State of Iowa. 2004-12-06. Retrieved 2009-01-20.