Tyne Bridge (UK Parliament constituency)
Coordinates: 54°58′05″N 1°36′22″W / 54.968°N 1.606°W
| Tyne Bridge | |
|---|---|
|
Former Borough constituency for the House of Commons | |
|
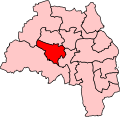
Boundary of Tyne Bridge in Tyne and Wear for the 2005 general election. | |
|
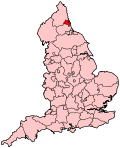
Location of Tyne and Wear within England. | |
| County | Tyne and Wear |
| 1983–2010 | |
| Number of members | One |
| Replaced by | Gateshead, Newcastle upon Tyne Central |
| Created from | Gateshead West, Newcastle upon Tyne Central, Newcastle upon Tyne West, Blaydon, Newcastle upon Tyne North and Gateshead East[1] |
Tyne Bridge was a parliamentary constituency in the north east of England, represented in the House of Commons of the Parliament of the United Kingdom, from 1983 until 2010. It elected one Member of Parliament (MP) by the first past the post system of election.
History
Tyne Bridge contained some of the UK's most deprived areas, and was a safe seat for the Labour Party throughout its existence.
Boundaries
1983-1997: The City of Newcastle wards of Benwell, Elswick, Scotswood, and West City, and the Metropolitan Borough of Gateshead wards of Bede, Bensham, Dunston, and Teams.
1997-2010: The City of Newcastle wards of Benwell, Elswick, Scotswood, and West City, and the Metropolitan Borough of Gateshead wards of Bede, Bensham, Deckham, Dunston, Saltwell, and Teams.
The constituency covered central Tyneside in Tyne and Wear, with part of the constituency being north of the River Tyne in Newcastle, and the other part being south of the river, in Gateshead. It is named for the Tyne Bridge that crosses the river. It included Newcastle city centre; before 1983, this area was in the Newcastle-upon-Tyne North seat.
Boundary review
Following a review of parliamentary representation in Tyne and Wear, the Boundary Commission for England abolished the Tyne Bridge constituency. At the 2010 general election it was replaced by the new constituency of Gateshead south of the River Tyne, and by the Newcastle-upon-Tyne Central constituency to the north.
Members of Parliament
| Election | Member[2] | Party | Notes | |
|---|---|---|---|---|
| 1983 | Harry Cowans | Labour | Previously MP for Newcastle-upon-Tyne Central from 1976. Died October 1985 | |
| 1985 by-election | David Clelland | Labour | Retired 2010 following boundary changes | |
| 2010 | constituency abolished: see Gateshead & Newcastle-upon-Tyne Central | |||
Elections of the 2000s
| Party | Candidate | Votes | % | ± | |
|---|---|---|---|---|---|
| Labour | David Clelland | 16,151 | 61.2 | −9.3 | |
| Liberal Democrat | Chris P. Boyle | 5,751 | 21.8 | +9.5 | |
| Conservative | Tom E. Fairhead | 2,962 | 11.2 | −2.1 | |
| BNP | Kevin Scott | 1,072 | 4.1 | +4.1 | |
| Respect | Miss Jill C. Russell | 447 | 1.7 | +1.7 | |
| Majority | 10,400 | 39.4 | |||
| Turnout | 26,383 | 49.3 | +5.1 | ||
| Labour hold | Swing | −9.4 | |||
| Party | Candidate | Votes | % | ± | |
|---|---|---|---|---|---|
| Labour | David Clelland | 18,345 | 70.5 | −6.3 | |
| Conservative | James Stuart Cook | 3,456 | 13.3 | +2.2 | |
| Liberal Democrat | Jonathan C. Wallace | 3,213 | 12.3 | +4.4 | |
| Socialist Labour | James Fitzpatrick | 533 | 2.0 | N/A | |
| Socialist Alliance | Samuel J. Robson | 485 | 1.9 | N/A | |
| Majority | 14,889 | 57.2 | |||
| Turnout | 26,032 | 44.2 | −12.9 | ||
| Labour hold | Swing | ||||
Elections of the 1990s
| Party | Candidate | Votes | % | ± | |
|---|---|---|---|---|---|
| Labour | David Clelland | 26,767 | 76.8 | +10.0 | |
| Conservative | Adrian H. Lee | 3,861 | 11.1 | −11.0 | |
| Liberal Democrat | Mrs. Mary Wallace | 2,785 | 8.0 | −3.1 | |
| Referendum | Graeme R. Oswald | 919 | 2.6 | N/A | |
| Socialist Alternative | Mrs. Elaine Brumskill | 518 | 1.5 | N/A | |
| Majority | 22,906 | 65.7 | +21.0 | ||
| Turnout | 34,850 | 57.1 | |||
| Labour hold | Swing | +10.5 | |||
| Party | Candidate | Votes | % | ± | |
|---|---|---|---|---|---|
| Labour | David Clelland | 22,328 | 67.2 | +4.1 | |
| Conservative | Charles M. Liddell-Grainger | 7,118 | 21.4 | +0.8 | |
| Liberal Democrat | John S. Burt | 3,804 | 11.4 | −4.9 | |
| Majority | 15,210 | 45.7 | +3.3 | ||
| Turnout | 33,250 | 62.6 | −0.5 | ||
| Labour hold | Swing | +1.7 | |||
Elections of the 1980s
| Party | Candidate | Votes | % | ± | |
|---|---|---|---|---|---|
| Labour | David Clelland | 23,131 | 63.0 | +2.5 | |
| Conservative | Michael Walton Bates | 7,558 | 20.6 | +9.5 | |
| Social Democratic | John C. Mansfield | 6,005 | 16.4 | −13.3 | |
| Majority | 15,573 | 42.4 | |||
| Turnout | 36,694 | 63.1 | |||
| Labour hold | Swing | ||||
- Death of Cowans
| Party | Candidate | Votes | % | ± | |
|---|---|---|---|---|---|
| Labour | David Clelland | 13,517 | 57.8 | +1.3 | |
| Social Democratic | Rod Kenyon | 6,942 | 29.7 | +11.4 [7] | |
| Conservative | Jacqui Lait | 2,588 | 11.1 | −14.1 | |
| Independent | John Connell | 250 | 1.1 | N/A | |
| Independent | George Weiss | 38 | 0.2 | N/A | |
| Independent | Peter R. Smith | 32 | 0.1 | N/A | |
| Majority | 6,575 | 28.1 | |||
| Turnout | 23,367 | 38.1 | −23.4 | ||
| Labour hold | Swing | ||||
| Registered electors | 61,400 | ||||
| Party | Candidate | Votes | % | ± | |
|---|---|---|---|---|---|
| Labour | Harry Cowans | 21,127 | 56.5 | N/A | |
| Conservative | Randall S. Crawley | 9,434 | 25.2 | N/A | |
| Liberal | Tony Dawson | 6,852 | 18.3 | N/A | |
| Majority | 11,693 | 31.3 | N/A | ||
| Turnout | 37,413 | 61.5 | N/A | ||
| Labour win (new seat) | |||||
See also
Notes and references
- ↑ "'Tyne Bridge', June 1983 up to May 1997". ElectionWeb Project. Cognitive Computing Limited. Retrieved 14 March 2016.
- ↑ Leigh Rayment's Historical List of MPs – Constituencies beginning with "T" (part 2)
- ↑ "Politics Resources". Election 1997. Politics Resources. 1 May 1997. Retrieved 7 Jan 2011.
- ↑ C. Rallings & M. Thrasher, The Media Guide to the New Parliamentary Constituencies, p.166 (Plymouth: LGC Elections Centre, 1995)
- ↑ The 1997 election result is calculated relative to the notional, not the actual, 1992 result.
- ↑ "Politics Resources". Election 1992. Politics Resources. 9 April 1992. Retrieved 6 Dec 2010.
- ↑ Change from the Liberal candidate who represented the SDP-Liberal Alliance in the 1983 general election.