Tropical cyclone rainfall forecasting

| Part of a series on |
| Tropical cyclones |
|---|
|
Formation and naming |
|
Climatology and tracking |
|
Tropical cyclone naming Tropical cyclone naming History of tropical cyclone naming List of historic tropical cyclone names List of retired Atlantic hurricane names List of retired Pacific hurricane names List of retired Pacific typhoon names List of retired Philippine typhoon names List of retired Australian cyclone names List of retired South Pacific tropical cyclone names |
|
Outline of tropical cyclones |
Tropical cyclone rainfall forecasting involves using scientific models and other tools to predict the precipitation expected in tropical cyclones such as hurricanes and typhoons. Knowledge of tropical cyclone rainfall climatology is helpful in the determination of a tropical cyclone rainfall forecast. More rainfall falls in advance of the center of the cyclone than in its wake. The heaviest rainfall falls within its central dense overcast and eyewall. Slow moving tropical cyclones, like Hurricane Danny and Hurricane Wilma, can lead to the highest rainfall amounts due to prolonged heavy rains over a specific location. However, vertical wind shear leads to decreased rainfall amounts, as rainfall is favored downshear and slightly left of the center and the upshear side is left devoid of rainfall. The presence of hills or mountains near the coast, as is the case across much of Mexico, Haiti, the Dominican Republic, much of Central America, Madagascar, Réunion, China, and Japan act to magnify amounts on their windward side due to forced ascent causing heavy rainfall in the mountains. A strong system moving through the mid latitudes, such as a cold front, can lead to high amounts from tropical systems, occurring well in advance of its center. Movement of a tropical cyclone over cool water will also limit its rainfall potential. A combination of factors can lead to exceptionally high rainfall amounts, as was seen during Hurricane Mitch in Central America.[1]
Use of forecast models can help determine the magnitude and pattern of the rainfall expected. Climatology and persistence models, such as r-CLIPER, can create a baseline for tropical cyclone rainfall forecast skill. Simplified forecast models, such as the Kraft technique and the eight and sixteen-inch rules, can create quick and simple rainfall forecasts, but come with a variety of assumptions which may not be true, such as assuming average forward motion, average storm size, and a knowledge of the rainfall observing network the tropical cyclone is moving towards. The forecast method of TRaP assumes that the rainfall structure the tropical cyclone currently has changes little over the next 24 hours. The global forecast model which shows the most skill in forecasting tropical cyclone-related rainfall in the United States is the GFS (Global Forecasting System).
Rainfall distribution around a tropical cyclone
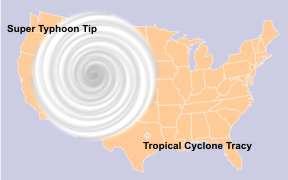
A larger proportion of rainfall falls in advance of the center (or eye) than after the center's passage, with the highest percentage falling in the right-front quadrant. A tropical cyclone's highest rainfall rates can lie in the right rear quadrant within a training (non-moving) inflow band.[2] Rainfall is found to be strongest in their inner core, within a degree of latitude of the center, with lesser amounts farther away from the center. Most of the rainfall in hurricanes is concentrated within its radius of gale-force winds.[3] Larger tropical cyclones have larger rain shields, which can lead to higher rainfall amounts farther from the cyclone's center.[3] Storms which have moved slowly, or loop, lead to the highest rainfall amounts. Riehl calculated that 33.97 inches (863 mm) of rainfall per day can be expected within one-half degree, or 35 miles (56 km), of the center of a mature tropical cyclone.[4] Many tropical cyclones progress at a forward motion of 10 knots, which would limit the duration of this excessive rainfall to around one-quarter of a day, which would yield about 8.50 inches (216 mm) of rainfall. This would be true over water, within 100 miles (160 km) of the coastline,[5] and outside topographic features. As a cyclone moves farther inland and is cut off from its supply of warmth and moisture (the ocean), rainfall amounts from tropical cyclones and their remains decrease quickly.[6]
Vertical wind shear

Vertical wind shear forces the rainfall pattern around a tropical cyclone to become highly asymmetric, with most of the precipitation falling to the left and downwind of the shear vector, or downshear left. In other words, southwesterly shear forces the bulk of the rainfall north-northeast of the center.[7] If the wind shear is strong enough, the bulk of the rainfall will move away from the center leading to what is known as an exposed circulation center. When this occurs, the potential magnitude of rainfall with the tropical cyclone will be significantly reduced.
Interaction with frontal boundaries and upper level troughs
As a tropical cyclone interacts with an upper-level trough and the related surface front, a distinct northern area of precipitation is seen along the front ahead of the axis of the upper level trough. Surface fronts with precipitable water amounts of 1.46 inches (37 mm) or more and upper level divergence overhead east of an upper level trough can lead to significant rainfall.[8] This type of interaction can lead to the appearance of the heaviest rainfall falling along and to the left of the tropical cyclone track, with the precipitation streaking hundreds of miles or kilometers downwind from the tropical cyclone.[9]
Mountains
Moist air forced up the slopes of coastal hills and mountain chains can lead to much heavier rainfall than in the coastal plain.[10] This heavy rainfall can lead to landslides, which still cause significant loss of life such as seen during Hurricane Mitch in Central America, where several thousand perished.[11]
Tools used in preparation of forecast
Climatology and persistence
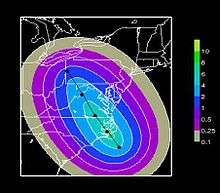
The Hurricane Research Division of the Atlantic Oceanographic and Meteorological Laboratory created the r-CLIPER (rainfall climatology and persistence) model to act as a baseline for all verification regarding tropical cyclone rainfall. The theory is, if the global forecast models cannot beat predictions based on climatology, then there is no skill in their use. There is a definite advantage to using the forecast track with r-CLIPER because it could be run out 120 hours/5 days with the forecast track of any tropical cyclone globally within a short amount of time.[12] The short range variation which uses persistence is the Tropical Rainfall Potential technique (TRaP) technique, which uses satellite-derived rainfall amounts from microwave imaging satellites and extrapolates the current rainfall configuration forward for 24 hours along the current forecast track.[13] This technique's main flaw is that it assumes a steady state tropical cyclone which undergoes little structural change with time, which is why it is only run forward for 24 hours into the future.[14]
Numerical weather prediction
Computer models can be used to diagnose the magnitude of tropical cyclone rainfall. Since forecast models output their information on a grid, they only give a general idea as to the areal coverage of moderate to heavy rainfall. No current forecast models run at a small enough grid scale (1 km or smaller) to be able to detect the absolute maxima measured within tropical cyclones. Of the United States forecasting models, the best performing model for tropical cyclone rainfall forecasting is known as the GFS, or Global Forecasting System.[15] The GFDL model has been shown to have a high bias concerning the magnitude of heavier core rains within tropical cyclones.[16] Beginning in 2007, the NCEP Hurricane-WRF became available to help predict rainfall from tropical cyclones.[17] Recent verification shows that both the European ECMWF forecast model and North American Mesoscale Model (NAM) show a low bias with heavier rainfall amounts within tropical cyclones.[18]
Kraft rule
During the late 1950s, this rule of thumb came into being, developed by R. H. Kraft.[19] It was noted from rainfall amounts (in imperial units) reported by the first order rainfall network in the United States that the storm total rainfall fit a simple equation: 100 divided by the speed of motion in knots.[20] This rule works, even in other countries, as long as a tropical cyclone is moving and only the first order or synoptic station network (with observations spaced about 60 miles (97 km) apart) are used to derive storm totals. Canada uses a modified version of the Kraft rule which divides the results by a factor of two, which takes into account the lower sea surface temperatures seen around Atlantic Canada and the prevalence of systems undergoing vertical wind shear at their northerly latitudes.[18] The main problem with this rule is that the rainfall observing network is denser than either the synoptic reporting network or the first order station networks, which means the absolute maximum is likely to be underestimated. Another problem is that it does not take the size of the tropical cyclone or topography into account.
See also
References
- ↑ Federal Emergency Management Agency. Are You Ready? Retrieved on 2006-04-05.
- ↑ Ivan Ray Tannehill. Hurricanes. Princeton University Press: Princeton, 1942. Pages 70-76.
- 1 2 Corene J. Matyas. Relating Tropical Cyclone Rainfall Patterns to Storm Size. Retrieved on 2007-02-14.
- ↑ Herbert Riehl. Tropical Meteorology. McGraw-Hill Book Company, Inc.: New York, 1954. Pages 293-297.
- ↑ Russell Pfost. Tropical Cyclone Quantitative Precipitation Forecasting. Retrieved on 2007-02-25.
- ↑ Roth, David M; Weather Prediction Center (January 7, 2013). "Maximum Rainfall caused by Tropical Cyclones and their Remnants Per State (1950–2012)". Tropical Cyclone Point Maxima. United States National Oceanic and Atmospheric Administration's National Weather Service. Retrieved March 15, 2013.
- ↑ Shuyi S. Chen, John A. Knaff, and Frank D. Marks, Jr. Effects of Vertical Wind Shear and Storm Motion on Tropical Cyclone Rainfall Asymmetries Deduced from TRMM. Retrieved on 2007-03-28.
- ↑ Norman W. Junker. Original Maddox et al. MCS archetypes associated with flash flooding. Retrieved on 2007-06-24.
- ↑ Norman W. Junker. Hurricanes and extreme rainfall. Retrieved on 2006-02-13.
- ↑ Yuh-Lang Lin, S. Chiao, J. A. Thurman, D. B. Ensley, and J. J. Charney. Some Common Ingredients for heavy Orographic Rainfall and their Potential Application for Prediction. Retrieved on 2007-04-26.
- ↑ John L. Guiney and Miles B. Lawrence. Hurricane Mitch. Retrieved on 2007-04-26.
- ↑ Frank Marks. GPM and Tropical Cyclones. Retrieved on 2007-03-15.
- ↑ Elizabeth Ebert, Sheldon Kusselson, and Michael Turk. Validation of Tropical Rainfall Potential (TRaP) Forecasts for Australian Tropical Cyclones. Retrieved on 2007-03-28.
- ↑ Stanley Q. Kidder, Sheldon J. Kusselson, John A. Knaff, and Robert J. Kuligowski. Improvements to the Experimental Tropical Rainfall Potential (TRaP) Technique. Retrieved on 2007-03-15.
- ↑ Timothy P. Marchok, Robert F. Rogers, and Robert E. Tuleya. Improving the Validation and Prediction of Tropical Cyclone Rainfall. Retrieved on 2007-03-15.
- ↑ Robert E. Tuleya, Mark DeMaria, and Robert J. Kuligowski. Evaluation of GFDL and Simple Statistical Model Rainfall Forecasts for U. S. Landfalling Tropical Storms.
- ↑ WRF Program Coordinator. Monthly Report of the WRF Program Coordinator. Retrieved on 2007-04-10.
- 1 2 David M. Roth Tropical Cyclone Rainfall (July 2007 presentation). Retrieved on 2009-05-07.
- ↑ Frank Marks. WSR-88D Derived Rainfall Distributions in Hurricane Danny (1997). Retrieved on 2007-04-13.
- ↑ Norman W. Junker. Hurricanes and Extreme Rainfall. Retrieved on 2007-03-15.
External links