Tripura Legislative Assembly election, 2008
| | ||||||||||||||||||||||||||||||||||||||
| ||||||||||||||||||||||||||||||||||||||
| ||||||||||||||||||||||||||||||||||||||
|
| ||||||||||||||||||||||||||||||||||||||
| Tripura District Map | ||||||||||||||||||||||||||||||||||||||
| ||||||||||||||||||||||||||||||||||||||

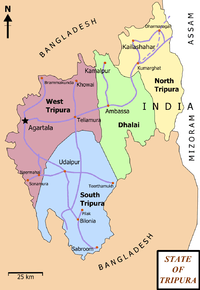
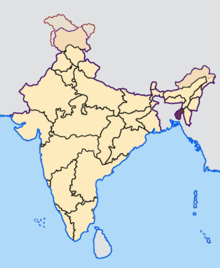
The Tripura Legislative Assembly election of 2008 took place in a single phase on 23 February 2008 to elect the Members of the Legislative Assembly (MLA) from each of the 60 Assembly Constituencies (ACs) in Tripura, India. Counting of votes happened on 7 March 2008 and because of the use of Electronic Voting Machines (EVMs) in this election, the results were ready within the day.
The Communist Party of India (Marxist) (CPI(M)) retained control of the Assembly by winning 49 seats giving them more than a two-thirds majority.[1] This provided the CPI(M) with a fourth consecutive term as the Government of Tripura. The CPI(M) and its allies, the Left Front, have been in power in Tripura since 1978 barring a single term between 1988 and 1993 when the state was ruled by the Indian National Congress (INC).[2]
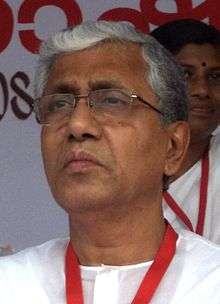
CPI(M) leader Manik Sarkar was sworn in as the Chief Minister of Tripura for the fourth time on 10 March 2008 along with 11 other cabinet Ministers.[3]
Background
The previous elections to the 9th Tripura Legislative Assembly was held in 2003 and the term for this Assembly was set to expire on 19 March 2008. Hence, the Election Commission of India (ECI) announced fresh elections to the 10th Tripura Legislative Assembly on 14 January 2008. Of the 60 ACs in Tripura, 20 are reserved for Scheduled Tribes and 7 are reserved for Scheduled Castes. Elections in all polling stations were held using EVMs.[4]
The CPI(M), headed by Manik Sarkar, had formed the Government in the 9th Tripura Assembly after being re-elected in 2003. The Left Front had won 41 of the 60 seats.[5]
The polls were being watched very closely because this was the first election in a Left Front controlled state after the Nandigram violence where the Left Front Government in West Bengal ordered heavily armed police to stamp out villagers protesting the Government's plans.
Campaign
The 2008 elections saw the Left Front trying to retain power for afourth consecutive term.[6]
A total of 313 candidates contested this election. Fatikroy saw 8 candidates standing for election, which was the highest number of candidates for any single AC in Tripura.[7]
Election Day
Election Day (23 Feb 2008) was peaceful and passed without any incidents of violence in this state that has traditionally faced insurgency from militant outfits. Unprecedented security arrangements were in place for this election - 20,000 paramilitary personnel from the Border Security Force, Indo-Tibetan Border Police and Central Reserve Police Force supported by air surveillance.[8]
Voter turnout across the state was 91.86, a record high for any state in India. It beat the previous record of around 86% set in Sikkim during the Assembly Elections in 2002.[9][10]
Results
 |
| This article is part of a series on the politics and government of India |
|
|
| Party | Seats Contested | Seats Won | No. of Votes | % of Votes | % in Seats contested | Seats Forfeited | 2003 Seats |
|---|---|---|---|---|---|---|---|
| Bharatiya Janata Party | 49 | 0 | 28,102 | 1.49% | 1.79% | 49 | 0 |
| Communist Party of India | 2 | 1 | 27,891 | 1.48% | 48.65% | 0 | 1 |
| Communist Party of India (Marxist) | 56 | 46 | 903,009 | 48.01% | 51.21% | 0 | 38 |
| Indian National Congress | 48 | 10 | 684,207 | 36.38% | 44.38% | 1 | 13 |
| Nationalist Congress Party | 5 | 0 | 1,882 | 0.10% | 0.92% | 5 | 0 |
| All India Forward Bloc | 12 | 0 | 2,961 | 0.16% | 0.74% | 12 | 0 |
| All India Trinamool Congress | 22 | 0 | 6,620 | 0.35% | 0.92% | 22 | 0 |
| Communist Party of India (Marxist-Leninist) Liberation | 14 | 0 | 5,261 | 0.28% | 1.11% | 14 | 0 |
| Indigenous Nationalist Party of Twipra | 11 | 1 | 116,761 | 6.21% | 38.23% | 2 | 6 |
| Janata Dal (United) | 2 | 0 | 1,081 | 0.06% | 1.74% | 2 | 0 |
| Lok Janshakti Party | 8 | 0 | 2,738 | 0.15% | 1.07% | 8 | 0 |
| Revolutionary Socialist Party | 2 | 2 | 31,717 | 1.69% | 52.58% | 0 | 2 |
| Amra Bangalee | 19 | 0 | 5,532 | 0.29% | 0.96% | 19 | 0 |
| Party of Democratic Socialism | 1 | 0 | 2,062 | 0.11% | 6.13% | 1 | 0 |
| Independents | 62 | 0 | 61,010 | 3.24% | 4.94% | 58 | 0 |
| Total | 313 | 60 | 1,880,834 | 193 |
References
- ↑ http://www.ndtv.com/convergence/ndtv/Story.aspx?&id=NEWEN20080043281&ch=3/7/2008%2010:30:00%20AM
- ↑ http://ibnlive.in.com/news/red-carpet-welcome-for-cpm-in-tripura/60655-3.html
- ↑ http://www.rediff.com/news/2008/mar/10trip.htm
- ↑ http://www.eci.gov.in/press/current/PN140108.pdf
- ↑ http://www.eci.gov.in/StatisticalReports/SE_Feb_2003/StatReport2003_TP.pdf
- ↑ http://ibnlive.in.com/news/left-front-wants-4th-term-as-tripura-goes-to-polls/59643-3.html
- ↑ http://www.eci.gov.in/StatisticalReports/candidatewise/AE_2008.xls
- ↑ http://www.topnews.in/tripura-cm-says-polling-peaceful-women-voters-coming-out-large-numbers-221869
- ↑ http://www.rediff.com/news/2008/feb/25trip.htm
- ↑ http://www.tripurainfo.com/election/per230208.htm
- ↑ http://www.eci.gov.in/StatisticalReports/SE2008/StatReport_MAR_2008_TRIPURA_after_IC.pdf
- ↑ http://www.eci.gov.in/StatisticalReports/SE_Feb_2003/StatReport2003_TP.pdf