Timeline of the 2004–05 Australian region cyclone season

The 2004–05 Australian region cyclone season was a near-average season with eleven tropical cyclones[A 1] occurring within the Australian region south of the equator and from 90°E to 160°E. The season officially ran from 1 November 2004 to 30 April 2005 with pre-season Tropical Cyclone Phoebe forming on 1 September and an unnamed tropical cyclone dissipating on 15 April.[1] This is the period of the year when most tropical cyclones form within the Australian region.[1]
During the season at least five people were killed from tropical disturbances while overall damage was estimated at $15.4 million (2005 USD; $18.7 million 2016 USD). Severe Tropical Cyclone Harvey caused an estimated $1 million (2005 USD; $1.21 million 2016 USD) in damage in Northern Territory when it made landfall in February.[2] The most damaging storm of the season, Severe Tropical Cyclone Ingrid, killed five people and caused an estimated $14.4 million (2005 USD; $17.5 million 2016 USD) as the first tropical cyclone on record, to bring hurricane force windspeeds to Queensland, Northern Territory, and Western Australia.[3]
Within the Australian region, tropical lows are monitored by the Bureau of Meteorology (BoM), who run Tropical Cyclone Warning Centres (TCWC) in Perth, Darwin and Brisbane. There is also a TCWC in Port Moresby in Papua New Guinea. These TCWCs issue warnings for tropical lows between 90°E and 160°E.[1] The United States Joint Typhoon Warning Center (JTWC) issues unofficial warnings within the Australian region, designating tropical cyclones with the P suffix when they form to the east of 135°E and S when they form to the west of 135°E. The Bureau of Meteorology and TCWC Port Moresby both use the Australian Tropical Cyclone Intensity Scale, and measure windspeeds over a period of ten minutes, while the JTWC measures sustained winds over a period of one minute and uses the Saffir–Simpson Hurricane Scale. This timeline includes information from post-storm reviews by the Bureau of Meteorology, TCWC Port Moresby, and the JTWC. It documents tropical cyclone formations, strengthening, weakening, landfalls, extratropical transitions, and dissipations during the season. Reports among warning centers often differ; as such, information from all three agencies has been included.
Timeline of events
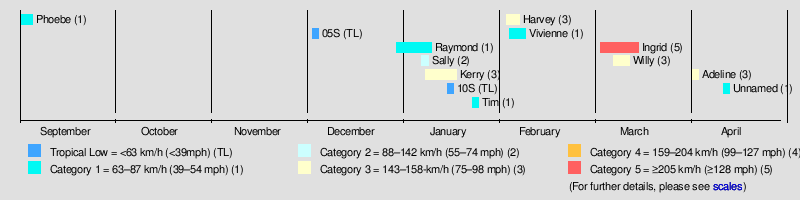
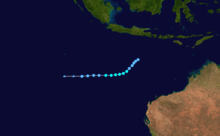
All data for the timeline graphic is taken from the Australian Bureau of Meteorology.
September
- 1 September
- 0000 UTC, (0800 WST) – TCWC Perth and RSMC La Reunion, both report that Tropical Depression/Low 01S, has moved into the Australian region from the South-West Indian Ocean with 10-minute sustained winds of 55 km/h (35 mph).[4][5][A 2]
- 0600 UTC, (1400 WST) – The JTWC reports that Tropical Depression 01S, has moved into the Australian region from the South-West Indian Ocean with 1-minute sustained winds of 55 km/h (35 mph).[6]
- 1800 UTC, (0200 WST, 2 September) – The JTWC reports that Tropical Depression/Low 01S has intensified into a tropical storm.[6]
- 2 September
- 0000 UTC, (0800 WST) – TCWC Perth reports that Tropical Depression/Low 01S, has intensified into a category one tropical cyclone.[5]
- 0400 UTC, (1200 WST) – TCWC Perth names Tropical Cyclone 01S, Phoebe.[4]
- 1200 UTC, (2000 WST) – TCWC Perth reports that Tropical Cyclone Phoebe (01S), has reached its peak 10-minute sustained wind speeds of 85 km/h (50 mph).[5]
- 1800 UTC, (0200 WST, 3 September) – The JTWC reports that Tropical Storm Phoebe (01S), has reached its peak one-minute sustained winds of 100 km/h (65 mph).[6]
- 4 September
- 1200 UTC, (2000 WST) – TCWC Perth reports that Tropical Cyclone Phoebe (01S), has weakened into a tropical low.[5]
- 1200 UTC, (2000 WST) – The JTWC issues its final advisory as Tropical Storm Phoebe (01S), has weakened into a tropical depression.[6]
- 5 September
- 1200 UTC, (2000 WST) – TCWC Perth issues its final advisory on Tropical Low Phoebe (01S).[5]
October and November
- The 2004–05 Australian region cyclone season officially began on 1 November 2004.[7]
- There were no significant tropical lows within the Australian region during October and November 2004.[8][9]
December
- 2 December
- 0600 UTC, (1400 WST) – TCWC Perth reports that a weak tropical low has formed about 460 km (285 mi), to the northeast of Jakarta, Indonesia.[10]
- 3 December
- 1800 UTC, (0200 WST, 4 December) – The JTWC designates the tropical low as Tropical Depression 05S.[10][11]
- 4 December
- 0600 UTC, (1400 WST) – The JTWC reports that Tropical Depression 05S has intensified into a tropical storm.[11]
- 0600 UTC, (1400 WST) – The JTWC reports that Tropical Storm 05S has reached its peak 1-minute sustained windspeeds of 65 kilometres per hour (40 mph).[11]
- 5 December
- 1200 UTC, (2000 WST) – The JTWC reports that Tropical Storm 05S has weakened into a tropical depression.[11]
- 2300 UTC, (0700 WST) – TCWC Perth issues its final advisory on Tropical Depression 05S.[12]
- 6 December
- 0000 UTC, (0800 WST) – The JTWC issues its final advisory on Tropical Depression 05S.[11]
- 30 December
- 0000 UTC, (0800 WST) – TCWC Perth reports that a tropical low has formed about 800 kilometres (495 mi) to the southwest of Dili, East Timor.[13]
- 1800 UTC, (0200 WST, 31 December) – The JTWC designates the tropical low as Tropical Depression 07S.[14]
- 31 December
- 0600 UTC, (1400 WST) – TCWC Perth reports that Tropical Low (07S), has intensified into a Category 1 tropical cyclone and names it Raymond.[13]
- 1800 UTC, (0200 WST, 1 January 2005) – The JTWC reports that Tropical Depression Raymond (07S), has intensified into a tropical storm.[14]
January
- 2 January
- 0000 UTC, (0800 WST) – TCWC Perth reports that Tropical Cyclone Raymond (07S), has reached its peak 10-minute sustained windspeeds of peak 10-minute intensity of 85 km/h (50 mph).[13]
- 0600 UTC, (1400 WST) – The JTWC reports that Tropical Storm Raymond (07S), has reached its peak 1-minute sustained windspeeds of 95 km/h (60 mph).[14]
- 1500 UTC, (2300 WST) – TCWC Perth reports that Tropical Cyclone Raymond (07S), has made landfall near Kalumburu, Western Australia with 10-minute sustained winds of 85 km/h (50 mph).[13]
- 3 January
- 0600 UTC, (1400 WST) – TCWC Perth reports that Tropical Cyclone Raymond (07S), has weakened into a tropical low.[13]
- 0600 UTC, (1400 WST) – The JTWC issues their final advisory on Tropical Cyclone Raymond (07S), as it weakens into a tropical depression.[14]
- 6 January
- 0600 UTC, (1400 WST) – TCWC Perth reports that a tropical low has formed about 820 km (510 mi), to the southwest of Jakarta, Indonesia.[15]
- 7 January
- 0600 UTC, (1400 WST) – The JTWC designates the tropical low as Tropical Depression 09S.[16]
- 1800 UTC, (0200 WST, 8 January) – TCWC Perth reports that Tropical Low 09S, has intensified into a category one tropical cyclone and names it "Sally".[15]
- 8 January
- 0600 UTC, (1400 WST) – The JTWC reports that Tropical Depression Sally (09S), has intensified into a tropical storm.[16]
- 1200 UTC, (2200 EST) – TCWC Brisbane reports that Severe Tropical Cyclone Kerry (08P), has moved into the Australian region from the South Pacific as a Category 3 severe tropical cyclone.[17]
- 1200 UTC, (2200 EST) – The JTWC reports that Tropical Cyclone Kerry (08P), has moved into the Australian region from the South Pacific as a Category 1 tropical cyclone.[18]
- 9 January
- 0000 UTC, (0800 WST) – TCWC Perth reports that Tropical Cyclone Sally (09S), has intensified into a Category 2 tropical cyclone.[15]
- 0000 UTC, (0800 WST) – TCWC Perth reports that Tropical Cyclone Sally (09S), has reached its peak 10-minute sustained winds of 95 km/h (60 mph).[15]
- 0000 UTC, (0800 WST) – The JTWC reports that Tropical Storm Sally (09S), has reached its peak 1-minute sustained winds of 85 km/h (50 mph).[16]
- 0600 UTC, (1600 EST) – The JTWC reports that Tropical Cyclone Kerry (08S), has intensified into a Category 2 tropical cyclone.[18]
- 1200 UTC – TCWC Perth reports that Tropical Cyclone Sally (09S), has weakened into a Category 1 tropical cyclone.[15]
- 1200 UTC – TCWC Brisbane reports that Severe Tropical Cyclone Kerry (08P), has reached its peak intensity of 140 km/h (85 mph).[17]
- 1200 UTC – The JTWC reports that Tropical Cyclone Kerry (08S), has reached its peak one-minute sustained wind speeds of 165 km/h (105 mph).[18]
- 10 January
- 0000 UTC, (0800 WST) – TCWC Perth reports that Tropical Low Ex-Raymond (07S), has dissipated in the Gulf of Carpentaria.[13]
- 0000 UTC, (0800 WST) – The JTWC issues its final advisory as Tropical Storm Sally (09S), weakens into a tropical depression.[16]
- 0300 UTC, (1100 WST) – TCWC Perth reports that Tropical Cyclone Sally (09S), has weakened into a tropical low.[15]
- 0600 UTC, (1400 WST) – TCWC Perth issues its final advisory on Tropical Low Sally (09S), as it dissipates.[15]
- 11 January
- 0600 UTC, (1400 EST) – TCWC Brisbane reports that Severe Tropical Cyclone Kerry (08P), has weakened into a category 2 tropical cyclone.[17]
- 1800 UTC, (0400 EST, 12 January) – TCWC Brisbane reports that Tropical Cyclone Kerry (08P), has moved into the South Pacific from the Australian region, however, TCWC Brisbane retains the primary warning responsibility for Kerry.[17]
- 12 January
- 1200 UTC, (2000 WST) – TCWC Brisbane reports that Tropical Cyclone Kerry (08P), has weakened into a Category 1 tropical cyclone.[17]
- 13 January
- 0600 UTC, (1400 EST) – TCWC Brisbane reports that Tropical Cyclone Kerry (08P), has re-entered the Australian region from the South Pacific.[17]
- 14 January
- 0000 UTC, (0930 CST) – The JTWC reports that Tropical Depression 10S has formed in the Timor Sea.[19]
- 0600 UTC, (1400 EST) – TCWC Brisbane reports that Tropical Cyclone Kerry (08P) has weakened into a tropical depression.[17]
- 0600 UTC, (1400 EST) – The JTWC reports that Tropical Depression Kerry (08P), has weakened into a tropical disturbance.[18]
- 15 January
- 0000 UTC, (0800 WST) – TCWC Perth starts to monitor Tropical Depression 10S as a tropical low.[20]
- 1200 UTC, (2000 WST) – The JTWC reports that Tropical Depression 10S, has intensified into a tropical storm.[19]
- 1200 UTC, (2000 WST) – The JTWC reports that Tropical Storm 10S, has reached its peak 1-minute sustained wind speeds of 65 km/h (40 mph).[19]
- 16 January
- 0600 UTC, (1400 EST) – The JTWC reports that Tropical Storm 10S has weakened into a tropical depression.[19]
- 17 January
- 0000 UTC, (0800 WST) – TCWC Perth reports that Tropical Low 10S has become extratropical.[21]
- 0600 UTC, (1400 EST) – The JTWC reports that Tropical Depression 10S has degenerated into a tropical disturbance.[19]
- 18 January
- 0000 UTC, (1000 EST) – TCWC Brisbane issues its final advisory on Tropical Low Kerry.[17]
- 22 January
- 0000 UTC, (0800 WST) – TCWC Perth reports that a tropical low has formed.[22]
- 1200 UTC, (2000 WST) – The JTWC designates the tropical low as Tropical Depression 13S.[23]
- 23 January
- 1200 UTC, (2000 WST) – TCWC Perth reports that Tropical Low 13S, has intensified into a Category 1 tropical cyclone and names it "Tim".[22]
- 1800 UTC, (0200 WST, 24 January) – TCWC Perth reports that Tropical Cyclone Tim (13S), has reached its peak 10-minute sustained winds of 85 km/h (50 mph).[22]
- 1800 UTC, (0200 WST, 24 January) – The JTWC reports that Tropical Depression Tim (13S), has intensified into a tropical storm.[23]
- 1800 UTC, (0200 WST, 24 January) – The JTWC reports that Tropical Depression Tim (13S), has reached its peak one-minute sustained winds of 65 km/h (40 mph).[23]
- 25 January
- 0000 UTC, (0800 WST) – TCWC Perth reports that Tropical Cyclone Tim (13S) has weakened into a tropical low.[22]
- 1200 UTC, (2000 WST) – TCWC Perth issues its final advisory on Tropical Low Tim (13S).[22]
- 1200 UTC, (2200 EST) – The JTWC reports that Tropical Storm Tim (13S), has weakened into a tropical depression.[23]
- 26 January
- 0600 UTC, (1600 EST) – The JTWC issues its final advisory on Tropical Depression Tim (13S).[23]
February
- 3 February
- 1200 UTC, (2130 CST) – TCWC Darwin and TCWC Brisbane report that a tropical low has formed over land about 60 kilometres (35 mi) to the north of Edward Island.[24][25]
- 4 February
- 0000 UTC, (0800 WST) – TCWC Perth reports that a tropical low has formed.[26]
- 5 February
- 0000 UTC – The JTWC designates TCWC Perth's tropical low as Tropical Depression 17S.[27][28]
- 1200 UTC – The JTWC designates the tropical low monitored by TCWC Darwin as Tropical Depression 16S.[29]
- 6 February
- 0000 UTC, (0930 CST) – TCWC Darwin and TCWC Brisbane report that Tropical Low 16S has intensified into a Category 1 tropical cyclone and name it "Harvey".[25][27]
- 0000 UTC – The JTWC reports that Tropical Depression Harvey (16S) has intensified into a tropical storm.[29]
- 7 February
- 0000 UTC – TCWC Darwin and TCWC Brisbane report that Tropical Cyclone Harvey (16S), has intensified into a Category 2 tropical cyclone.[24][25]
- 0000 UTC – The JTWC reports that Tropical Depression 17S has intensified into a tropical storm.[28]
- 0000 UTC – The JTWC reports that Tropical Depression 17S has reached its peak one-minute sustained winds of 65 kilometres per hour (40 mph).[28]
- 0600 UTC – TCWC Darwin and TCWC Brisbane report that Tropical Cyclone Harvey (16S), has intensified into a Category 3 severe tropical cyclone.[25]
- 0600 UTC – The JTWC reports that Tropical Storm Harvey (16S) has reached its peak one-minute sustained winds of 95 km/h (60 mph).[29]
- 0800 UTC – TCWC Darwin and TCWC Brisbane report that Severe Tropical Cyclone Harvey (16S) has made landfall near the Northern Territory-Queensland border.[24]
- 1200 UTC – TCWC Darwin and TCWC Brisbane report that Severe Tropical Cyclone Harvey (16S) has weakened into a Category 2 tropical cyclone.[25]
- 1500 UTC – TCWC Darwin and TCWC Brisbane report that Tropical Cyclone Harvey (16S) has weakened into a Category 1 tropical cyclone.[25]
- 1800 UTC – TCWC Darwin and TCWC Brisbane issue the final advisory on Tropical Cyclone Harvey (16S), as it weakens into a tropical low.[24][25]
- 1800 UTC – The JTWC issues its final advisory on Tropical Storm Harvey (16S).[29]
- 8 February
- 0000 UTC, (0800 WST) – TCWC Perth reports that Tropical Low 17S, has intensified into a Category 1 tropical cyclone and names it "Vivienne".[26]
- 0000 UTC, (0800 WST) – TCWC Perth reports that Tropical Cyclone Vivienne (17S), has reached its peak 10-minute sustained winds of 65 km/h (40 mph).[26]
- 1200 UTC – TCWC Perth reports that Tropical Cyclone Vivienne (17S), has weakened into a tropical low.[26]
- 1200 UTC – The JTWC reports that Tropical Storm Vivienne (17S), has weakened into a tropical depression and dissipated.[28]
- 9 February
- 1200 UTC, (2000 WST) – TCWC Perth reports that Tropical Low Vivienne (17S), has dissipated.[26]
March
- 4 March
- 0000 UTC, (0930 CST) – TCWC Brisbane reports that a tropical low has formed in the Gulf of Carpentaria about 1,000 kilometres (620 mi)to the west of Darwin, Australia.[3]
- 5 March
- 0600 UTC, (1530 CST) – The JTWC designates the tropical low as Tropical Depression 22P.[30]
- 1200 UTC, (2130 CST) – TCWC Brisbane reports that Tropical Low 22P, has made landfall on the Cape York Peninsula with winds of 55 km/h (35 mph).[3]
- 6 March
- 0000 UTC, (1000 EST) – TCWC Brisbane reports that Tropical Low 22P, has intensified into a Category 1 tropical cyclone as it moves offshore and names it "Ingrid".[3]
- 0600 UTC, (1600 EST) – TCWC Brisbane reports that Tropical Cyclone Ingrid (22P), has intensified into a category two tropical cyclone.[3]
- 0600 UTC, (1530 EST) – The JTWC reports that Tropical Depression Ingrid (22P), has intensified into a tropical storm.[30]
- 1200 UTC, (2130 EST) – TCWC Brisbane reports that Tropical Cyclone Ingrid (22P), has intensified into a Category 3 severe tropical cyclone.[3]
- 1200 UTC, (2130 EST) – The JTWC reports that Tropical Storm Ingrid (22P), has intensified into a Category 1 tropical cyclone.[30]
- 7 March
- 0000 UTC, (1000 EST) – The JTWC reports that Tropical Cyclone Ingrid (22P), has intensified into a Category 2 tropical cyclone.[30]
- 0600 UTC, (1530 EST) – TCWC Brisbane reports that Severe Tropical Cyclone Ingrid (22P) has intensified into a Category 4 severe tropical cyclone.[3]
- 0600 UTC – The JTWC reports that Tropical Cyclone Ingrid (22P) has intensified into a Category 4 tropical cyclone.[30]
- 1800 UTC – TCWC Brisbane reports that Severe Tropical Cyclone Ingrid (22P) has intensified into a Category 5 severe tropical cyclone.[3]
- 8 March
- 0600 UTC – TCWC Perth reports that a tropical low has formed.[31]
- 1800 UTC – The JTWC designates the tropical low as Tropical Depression 23S.[32]
- 1800 UTC – The JTWC reports that Tropical Cyclone Ingrid (22P) has weakened into a category three tropical cyclone.[30]
- 9 March
- 0600 UTC – TCWC Brisbane reports that Severe Tropical Cyclone Ingrid (22P), has weakened into a Category 4 severe tropical cyclone.[3]
- 1800 UTC – TCWC Perth reports that Tropical Low 23S, has intensified into a Category 1 tropical cyclone and names it "Willy".[31]
- 1800 UTC – The JTWC reports that Tropical Depression Willy (23S), has intensified into a tropical storm.[32]
- 2000 UTC – TCWC Brisbane reports that Severe Tropical Cyclone Ingrid (22P) has made landfall on the Cape York Peninsula near Night Island with winds of 175 km/h (110 mph).[3]
- 2100 UTC – TCWC Brisbane reports that Severe Tropical Cyclone Ingrid (22P) has weakened into a category three severe tropical cyclone.[3]
- 10 March
- 0000 UTC – TCWC Brisbane reports that Severe Tropical Cyclone Ingrid (22P) has weakened into a category two tropical cyclone.[3]
- 0000 UTC – The JTWC reports that Tropical Cyclone Ingrid (22P), has weakened into a Category 1 tropical cyclone.[30]
- 0600 UTC – TCWC Perth reports that Tropical Cyclone Willy (23S), has intensified into a Category 2 tropical cyclone.[31]
- 1200 UTC – TCWC Brisbane reports that Tropical Cyclone Ingrid (22P), has weakened into a Category 1 tropical cyclone.[3]
- 1200 UTC – The JTWC reports that Tropical Cyclone Ingrid (22P), has weakened into a tropical storm.[30]
- 1800 UTC – TCWC Perth reports that Tropical Cyclone Willy (23S), has intensified into a Category 3 severe tropical cyclone.[31]
- 1800 UTC – TCWC Brisbane reports that Tropical Cyclone Ingrid (22P), has intensified into a Category 2 tropical cyclone.[3]
- 1800 UTC – TCWC Brisbane passes the primary warning responsibility of Tropical Cyclone Ingrid (22P), to TCWC Darwin as the storm moves west of 141°E.[3]
- 1800 UTC – The JTWC reports that Tropical Storm Willy (23S), has intensified into a Category 1 tropical cyclone.[32]
- 11 March
- 0000 UTC – TCWC Darwin reports that Tropical Cyclone Ingrid (22P), has intensified into a Category 3 severe tropical cyclone.[3]
- 0000 UTC – The JTWC reports that Tropical Storm Ingrid (22P), has intensified into a Category 1 tropical cyclone.[30]
- 0600 UTC – The JTWC reports that Tropical Cyclone Willy (23S), has intensified into a Category 2 tropical cyclone.[32]
- 0900 UTC – TCWC Darwin reports that Severe Tropical Cyclone Ingrid (22P), has intensified into a Category 4 severe tropical cyclone.[3]
- 1200 UTC – TCWC Perth reports that Severe Tropical Cyclone Willy (23S), has reached its peak 10-minute sustained winds of 140 km/h (85 mph).[31]
- 1200 UTC – The JTWC reports that Tropical Cyclone Ingrid (22P), has intensified into a Category 4 tropical cyclone.[30]
- 1200 UTC – The JTWC reports that Tropical Cyclone Willy (23S), has reached its peak one-minute sustained wind speeds of 165 km/h (105 mph).[32]
- 1500 UTC – TCWC Darwin reports that Severe Tropical Cyclone Ingrid (22P), has intensified into a Category 5 severe tropical cyclone.[3]
- 1800 UTC – TCWC Darwin reports that Severe Tropical Cyclone Ingrid (22P), has reached its peak 10-minute sustained wind speeds of 230 km/h (145 mph).[3]
- 12 March
- 0600 UTC – The JTWC reports that Tropical Cyclone Ingrid (22P), has reached its peak 1-minute sustained wind speeds of 250 km/h (155 mph).[30]
- 0600 UTC – The JTWC reports that Tropical Cyclone Willy (23S), has weakened into a Category 1 tropical cyclone.[32]
- 1800 UTC – TCWC Darwin reports that Severe Tropical Cyclone Ingrid (22P), has weakened into a Category 4 severe tropical cyclone.[3]
- 13 March
- 0000 UTC – TCWC Darwin reports that Severe Tropical Cyclone Ingrid (22P), has made landfall on the Cobourg Peninsula with winds of 165 km/h (105 mph).[3]
- 0300 UTC – TCWC Darwin reports that Severe Tropical Cyclone Ingrid (22P), has weakened into a Category 3 severe tropical cyclone.[3]
- 0600 UTC – TCWC Perth reports that Severe Tropical Cyclone Willy (23S), has weakened into a Category 2 tropical cyclone.[31]
- 0600 UTC – The JTWC reports that Tropical Cyclone Ingrid (22P), has weakened into a Category 3 tropical cyclone.[30]
- 0900 UTC – TCWC Darwin reports that Severe Tropical Cyclone Ingrid (22P), has made landfall on Meville Island with winds of 130 km/h (80 mph).[3]
- 1200 UTC – The JTWC reports that Tropical Cyclone Willy (23S), has weakened into a tropical storm.[32]
- 1800 UTC – TCWC Perth reports that Tropical Cyclone Willy (23S), has weakened into a Category 1 tropical cyclone.[31]
- 1800 UTC – TCWC Darwin reports that Severe Tropical Cyclone Ingrid (22P), has weakened into a Category 2 tropical cyclone.[3]
- 14 March
- 0000 UTC – TCWC Darwin reports that Tropical Cyclone Ingrid (22P), has intensified into a Category 3 tropical cyclone.[3]
- 0000 UTC – TCWC Perth reports that Tropical Cyclone Willy (23S), has weakened into a tropical low.[31]
- 0000 UTC – The JTWC issues their final advisory on Tropical Storm Willy (23S).[32]
- 1200 UTC – TCWC Darwin reports that Severe Tropical Cyclone Ingrid (22P), has intensified into a Category 4 severe tropical cyclone.[3]
- 1200 UTC – TCWC Darwin transfers the primary warning responsibility of Severe Tropical Cyclone Ingrid (22P), to TCWC Perth as Ingrid, moves west of 129°E.[3]
- 1200 UTC – The JTWC reports that Tropical Cyclone Ingrid (22P) has intensified into a Category 4 tropical cyclone.[30]
- 1800 UTC – TCWC Perth issues its final advisory on Tropical Low Willy (23S).[31]
- 15 March
- 1200 UTC – TCWC Perth reports that Severe Tropical Cyclone Ingrid (22P), has made landfall in northern Western Australia with winds of 185 km/h (115 mph).[3]
- 1500 UTC – TCWC Perth reports that Severe Tropical Cyclone Ingrid (22P) has weakened into a Category 3 severe tropical cyclone.[3]
- 1800 UTC – TCWC Perth reports that Severe Tropical Cyclone Ingrid (22P) has weakened into a Category 2 tropical cyclone.[3]
- 1800 UTC – TCWC Perth reports that Tropical Cyclone Ingrid (22P), has made landfall near Kalumburu with winds of 110 km/h (70 mph).[3]
- 1800 UTC – The JTWC reports that Tropical Cyclone Ingrid (22P) has weakened into a Category 2 tropical cyclone.[30]
- 16 March
- 0600 UTC – TCWC Perth reports that Tropical Cyclone Ingrid (22P) has weakened into a Category 1 tropical cyclone.[3]
- 0600 UTC – The JTWC reports that Tropical Cyclone Ingrid (22P), has weakened into a Category 1 tropical cyclone.[30]
- 2100 UTC – TCWC Perth issues its final advisory on Tropical Cyclone Ingrid (22P), as it weakens into a tropical low.[3]
- 17 March
- 0600 UTC – The JTWC issues its final warning on Tropical Cyclone Ingrid (22P).[30]
April and May
- 2 April
- 0000 UTC, (0800 WST) – TCWC Perth reports that a tropical low, has formed about 740 kilometres (460 mi), to the southwest of Jakarta, Indonesia.[33]
- 3 April
- 1000 UTC, (1800 WST) – TCWC Perth names the tropical low, "Adeline".[34]
- 1200 UTC, (2000 WST) – TCWC Perth reports that Tropical Low Adeline has intensified into a Category 1 tropical cyclone.[33]
- 1200 UTC, (2000 WST) – The JTWC designates Tropical Cyclone Adeline as Tropical Depression 26S.[34][35]
- 4 April
- 0000 UTC, (0800 WST) – TCWC Perth reports that Tropical Cyclone Adeline (26S), has intensified into a Category 2 tropical Cyclone.[33]
- 1800 UTC, (0200 WST, 5 April) – TCWC Perth reports that Tropical Cyclone Adeline (26S), has intensified into a Category 3 severe tropical cyclone.[33]
- 1800 UTC, (0200 WST, 5 April) – The JTWC reports that Tropical Depression Adeline (26S), has intensified into a tropical storm.[35]
- 5 April
- 0600 UTC, (1400 WST) – The JTWC reports that Tropical Storm Adeline (26S) has intensified into a Category 1 tropical cyclone.[35]
- 1200 UTC, (2000 WST) – The JTWC reports that Tropical Cyclone Adeline (26S) has intensified into a Category 2 tropical cyclone.[35]
- 1300 UTC, (2100 WST) – TCWC Perth passes the primary warning responsibility for Severe Tropical Cyclone Adeline (26S), to RSMC La Réunion as it moves into the South-West Indian ocean.[33]
- 12 April
- Unknown time – TCWC Port Moresby and TCWC Brisbane, report that a tropical low, has developed within the far northern Arafura Sea.[36]
- 13 April
- 0000 UTC (1000 EST) – The tropical low makes landfall on the Indonesian province of Papua.[36]
- 15 April
- 1200 UTC (2200 EST) – The tropical low dissipates.[36]
- 1 May
- 0000 UTC (1000 EST) – The 2004–05 Australian region cyclone season officially ends.[7]
See also
Notes
- ↑ An average tropical cyclone season contains thirteen tropical cyclones.
- ↑ The figures for maximum sustained winds and position estimates are rounded to the nearest 5 units (miles, or kilometres), following the convention used in the of Meteorology's operational products for each storm. All other units are rounded to the nearest digit.
References
- 1 2 3 RA V Tropical Cyclone Committee. "Tropical Cyclone Operational plan for the South Pacific & Southeast Indian Ocean" (PDF). World Meteorological Organization. Retrieved 2 January 2011.
- ↑ "SIGNIFICANT WEATHER – February 2005". Australian Bureau of Meteorology. Retrieved 2 January 2011.
- 1 2 3 4 5 6 7 8 9 10 11 12 13 14 15 16 17 18 19 20 21 22 23 24 25 26 27 28 29 30 31 32 33 Unattributed (7 September 2009). "Severe Tropical Cyclone Ingrid (22P) Report" (PDF). Bureau of Meteorology. Retrieved 2011-01-02.
- 1 2 Padgett, Gary (2005). "Gary Padgett's Monthly Global Tropical Cyclone Summary September 2004". Australian Severe Weather. Retrieved 2011-01-07.
- 1 2 3 4 5 "Tropical Cyclone Phoebe". Tropical Cyclone Warning Center Perth. Bureau of Meteorology. Archived from the original (PDF) on 2011-02-20. Retrieved 2011-01-01.
- 1 2 3 4 Unattributed. "JTWC Best-Track Data for Tropical Storm 01S (Phoebe)". Joint Typhoon Warning Center. United States Navy. Retrieved 2010-11-05.
- 1 2 Unattributed (10 March 2008). "Tropical Cyclone Operational Plan for the South Pacific and South-East Indian Ocean 2008" (PDF). RA V Tropical cyclone Committee. World Meteorological Organization. Retrieved 2011-01-02.
- ↑ Padgett, Gary (2005). "Monthly global tropical cyclone summary October 2004". Australian Severe Weather. Retrieved 2011-02-21.
- ↑ Padgett, Gary (2005). "Monthly global tropical cyclone summary November 2004". Australian Severe Weather. Retrieved 2011-02-21.
- 1 2 Padgett, Gary (2005). "Monthly global tropical cyclone tracks December 2004". Australian Severe Weather. Retrieved 2011-02-20.
- 1 2 3 4 5 Unattributed (2006). "JTWC Best Track Data for Tropical Storm 05S". Joint Typhoon Warning Center. US Navy. Retrieved 2011-01-02.
- ↑ Unattributed (5 December 2004). "Severe Weather Advisories issued on 2004-12-05". MT Archive. Retrieved 2011-01-02.
- 1 2 3 4 5 6 Unattributed (2005). "Tropical Cyclone Raymond" (PDF). TCWC Perth. Bureau of Meteorology. Retrieved 2011-01-01.
- 1 2 3 4 Unattributed (2005). "JTWC Best Track Data for Tropical Storm 07S (Raymond)". Joint Typhoon Warning Center. Retrieved 2010-11-05.
- 1 2 3 4 5 6 7 Unattributed. "Tropical Cyclone Sally" (PDF). Tropical Cyclone Warning Center Perth. Bureau of Meteorology. Retrieved 2011-01-03.
- 1 2 3 4 Unattributed (2005). "JTWC best track data for Tropical Storm 09S (Sally)". Joint Typhoon Warning Center. Retrieved 2010-11-05.
- 1 2 3 4 5 6 7 8 Unattributed (2 May 2009). "RSMC Nadi Best Track Data for the 2004/2005 Season". Fiji Meteorological Service, Meteorological Service of New Zealand Limited, Bureau of Meteorology. National Oceanic and Atmospheric Administration. Retrieved 2011-02-21.
- 1 2 3 4 Unattributed. "JTWC Best Track Data for Tropical Cyclone 08P (Kerry)". Joint Typhoon Warning Center. Retrieved 2011-01-02.
- 1 2 3 4 5 Unattributed (2006). "JTWC Best Tracking Data for Tropical Storm 10S". Joint Typhoon Warning Center. US Navy. Retrieved 2011-01-02.
- ↑ Unattributed (15 January 2005). "Severe Weather Advisories issued on 2005-01-15". MT Archive. Retrieved 2011-01-02.
- ↑ Unattributed (17 January 2005). "Severe Weather Advisories issued on 2005-01-17". MT Archive. Retrieved 2011-01-02.
- 1 2 3 4 5 Unattributed (7 August 2009). "Tropical Cyclone Tim Report" (PDF). Tropical Cyclone Warning Center Perth. Bureau of Meteorology. Retrieved 2011-01-03.
- 1 2 3 4 5 Unattributed (2005). "JTWC Best Track Data for Tropical Storm 13S (Tim)". Joint Typhoon Warning Center. Retrieved 2010-11-05.
- 1 2 3 4 "Tropical Cyclone Harvey". Bureau of Meteorology. 2010. Archived from the original on 2011-02-11. Retrieved 2011-02-21.
- 1 2 3 4 5 6 7 Unattributed (2008). "Severe Tropical Cyclone Harvey best track data". Bureau of Meteorology. Archived from the original on 28 December 2010. Retrieved 2010-11-05.
- 1 2 3 4 5 Unattributed (7 August 2009). "Tropical Cyclone Vivienne Report" (PDF). Tropical Cyclone Warning Center Perth. Bureau of Meteorology. Retrieved 2011-01-03.
- 1 2 Padgett, Gary (2005). "Monthly global tropical cyclone summary February 2005". Australian Severe Weather. Retrieved 2011-02-21.
- 1 2 3 4 Unattributed. "JTWC Best Track Data for Tropical Storm 17S (Vivienne)". Joint Typhoon Warning Center. Retrieved 2010-11-05.
- 1 2 3 4 Unattributed. "JTWC Best Track Data for Tropical Storm 16S (Harvey)". Joint Typhoon Warning Center. Retrieved 2010-11-05.
- 1 2 3 4 5 6 7 8 9 10 11 12 13 14 15 16 Unattributed (2006). "JTWC Best Track Data for Tropical Cyclone 22P (Ingrid)". Joint Typhoon Warning Center. Retrieved 2011-01-02.
- 1 2 3 4 5 6 7 8 9 Unattributed. "Severe Tropical Cyclone Willy" (PDF). TCWC Perth. Bureau of Meteorology. Retrieved 2011-01-03.
- 1 2 3 4 5 6 7 8 Unattributed (2006). "JTWC Best Track Data for Tropical Cyclone 23S (Willy)". Joint Typhoon Warning Center. Retrieved 2011-01-01.
- 1 2 3 4 5 Unattributed. "Tropical Cyclone Adeline". Perth Tropical Cyclone Warning Center. Bureau of Meteorology. Archived from the original (PDF) on 2011-02-20. Retrieved 2011-01-03.
- 1 2 Padgett, Gary (2005). "Monthly Global Tropical Cyclone Summary April 2005". Australian Severe Weather. Retrieved 2011-02-20.
- 1 2 3 4 Unattributed. "JTWC Best Track Data for Tropical Cyclone 26S (Adeline-Juliet)". Joint Typhoon Warning Center. US Navy. Retrieved 2010-12-28.
- 1 2 3 Butler, J.; Callaghan, Jeff. (4 December 2007). "The South Pacific and southeast Indian Ocean tropical cyclone season 2004-05" (PDF). Australian Meteorological Magazine. Bureau of Meteorology (56): 291–398.