Thin-layer chromatography
 Separation of black ink on a TLC plate | |
| Acronym | TLC |
|---|---|
| Classification | Chromatography |
| Other techniques | |
| Related |
Agarose gel electrophoresis SDS-PAGE |

Thin-layer chromatography (TLC) is a chromatography technique used to separate non-volatile mixtures.[1] Thin-layer chromatography is performed on a sheet of glass, plastic, or aluminium foil, which is coated with a thin layer of adsorbent material, usually silica gel, aluminium oxide (alumina), or cellulose. This layer of adsorbent is known as the stationary phase.
After the sample has been applied on the plate, a solvent or solvent mixture (known as the mobile phase) is drawn up the plate via capillary action. Because different analytes ascend the TLC plate at different rates, separation is achieved.[2] The mobile phase has different properties from the stationary phase. For example, with silica gel, a very polar substance, non-polar mobile phases such as heptane are used. The mobile phase may be a mixture, allowing chemists to fine-tune the bulk properties of the mobile phase.
After the experiment, the spots are visualized. Often this can be done simply by projecting ultraviolet light onto the sheet; the sheets are treated with a phosphor, and dark spots appear on the sheet where compounds absorb the light impinging on a certain area. Chemical processes can also be used to visualize spots; anisaldehyde, for example, forms colored adducts with many compounds, and sulfuric acid will char most organic compounds, leaving a dark spot on the sheet.
To quantify the results, the distance traveled by the substance being considered is divided by the total distance traveled by the mobile phase. (The mobile phase must not be allowed to reach the end of the stationary phase.) This ratio is called the retention factor or Rf. In general,a substance whose structure resembles the stationary phase will have low Rf, while one that has a similar structure to the mobile phase will have high retention factor. Retention factors are characteristic, but will change depending on the exact condition of the mobile and stationary phase. For this reason, chemists usually apply a sample of a known compound to the sheet before running the experiment.
Thin-layer chromatography can be used to monitor the progress of a reaction, identify compounds present in a given mixture, and determine the purity of a substance. Specific examples of these applications include: analyzing ceramides and fatty acids, detection of pesticides or insecticides in food and water, analyzing the dye composition of fibers in forensics, assaying the radiochemical purity of radiopharmaceuticals, or identification of medicinal plants and their constituents [3]
A number of enhancements can be made to the original method to automate the different steps, to increase the resolution achieved with TLC and to allow more accurate quantitative analysis. This method is referred to as HPTLC, or "high-performance TLC". HPTLC typically uses thinner layers of stationary phase and smaller sample volumes, thus reducing the loss of resolution due to diffusion.
Plate preparation
TLC plates are usually commercially available, with standard particle size ranges to improve reproducibility. They are prepared by mixing the adsorbent, such as silica gel, with a small amount of inert binder like calcium sulfate (gypsum) and water. This mixture is spread as a thick slurry on an unreactive carrier sheet, usually glass, thick aluminum foil, or plastic. The resultant plate is dried and activated by heating in an oven for thirty minutes at 110 °C. The thickness of the absorbent layer is typically around 0.1 – 0.25 mm for analytical purposes and around 0.5 – 2.0 mm for preparative TLC.[4]
Technique
The process is similar to paper chromatography with the advantage of faster runs, better separations, and the choice between different stationary phases. Because of its simplicity and speed TLC is often used for monitoring chemical reactions and for the qualitative analysis of reaction products. Plates can be labeled before or after the chromatography process using a pencil or other implement that will not interfere or react with the process.
To run a thin layer chromatography plate, the following procedure is carried out:[5]
- Using a capillary, a small spot of solution containing the sample is applied to a plate, about 1.5 centimeters from the bottom edge. The solvent is allowed to completely evaporate off to prevent it from interfering with sample's interactions with the mobile phase in the next step. If a non-volatile solvent was used to apply the sample, the plate needs to be dried in a vacuum chamber. This step is often repeated to ensure there is enough analyte at the starting spot on the plate to obtain a visible result. Different samples can be placed in a row of spots the same distance from the bottom edge, each of which will move in its own adjacent lane from its own starting point.
- A small amount of an appropriate solvent (eluent) is poured into a glass beaker or any other suitable transparent container (separation chamber) to a depth of less than 1 centimeter. A strip of filter paper (aka "wick") is put into the chamber so that its bottom touches the solvent and the paper lies on the chamber wall and reaches almost to the top of the container. The container is closed with a cover glass or any other lid and is left for a few minutes to let the solvent vapors ascend the filter paper and saturate the air in the chamber. (Failure to saturate the chamber will result in poor separation and non-reproducible results).
- The TLC plate is then placed in the chamber so that the spot(s) of the sample do not touch the surface of the eluent in the chamber, and the lid is closed. The solvent moves up the plate by capillary action, meets the sample mixture and carries it up the plate (elutes the sample). The plate should be removed from the chamber before the solvent front reaches the top of the stationary phase (continuation of the elution will give a misleading result) and dried.
- Without delay, the solvent front, the furthest extent of solvent up the plate, is marked.
- The plate is visualized. As some plates are pre-coated with a phosphor such as zinc sulfide, allowing many compounds to be visualized by using ultraviolet light; dark spots appear where the compounds block the UV light from striking the plate. Alternatively, plates can be sprayed or immersed in chemicals after elution. Various visualising agents react with the spots to produce visible results.
Separation Process and Principle
Different compounds in the sample mixture travel at different rates due to the differences in their attraction to the stationary phase and because of differences in solubility in the solvent.[6] By changing the solvent, or perhaps using a mixture, the separation of components (measured by the Rf value) can be adjusted. Also, the separation achieved with a TLC plate can be used to estimate the separation of a flash chromatography column. (A compound elutes from a column when the amount of solvent collected is equal to 1/Rf.)[7] Chemists often use TLC to develop a protocol for separation by chromatography and they use TLC to determine which fractions contain the desired compounds.

Separation of compounds is based on the competition of the solute and the mobile phase for binding places on the stationary phase.[3] For instance, if normal-phase silica gel is used as the stationary phase, it can be considered polar. Given two compounds that differ in polarity, the more polar compound has a stronger interaction with the silica and is, therefore, more capable to dispel the mobile phase from the binding places. As a consequence, the less polar compound moves higher up the plate (resulting in a higher Rf value).[6] If the mobile phase is changed to a more polar solvent or mixture of solvents, it is more capable of dispelling solutes from the silica binding places, and all compounds on the TLC plate will move higher up the plate. It is commonly said that "strong" solvents (eluents) push the analyzed compounds up the plate, whereas "weak" eluents barely move them. The order of strength/weakness depends on the coating (stationary phase) of the TLC plate. For silica gel-coated TLC plates, the eluent strength increases in the following order: perfluoroalkane (weakest), hexane, pentane, carbon tetrachloride, benzene/toluene, dichloromethane, diethyl ether, ethyl acetate, acetonitrile, acetone, 2-propanol/n-butanol, water, methanol, triethylamine, acetic acid, formic acid (strongest). For C18-coated plates the order is reverse. In other words, when the stationary phase is polar and the mobile phase is polar, the method is normal-phase as opposed to reverse-phase. This means that if a mixture of ethyl acetate and hexane as the mobile phase is used, adding more ethyl acetate results in higher Rf values for all compounds on the TLC plate. Changing the polarity of the mobile phase will normally not result in reversed order of running of the compounds on the TLC plate. An eluotropic series can be used as a guide in selecting a mobile phase. If a reversed order of running of the compounds is desired, an apolar stationary phase should be used, such as C18-functionalized silica.
Analysis
As the chemicals being separated may be colorless, several methods exist to visualize the spots:
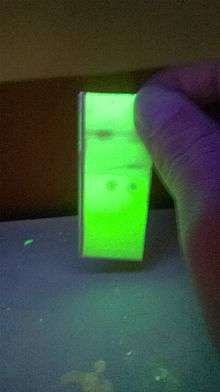
- fluorescent analytes like quinine may be detected under blacklight (366 nm)
- Often a small amount of a fluorescent compound, usually manganese-activated zinc silicate, is added to the adsorbent that allows the visualization of spots under UV-C light (254 nm). The adsorbent layer will thus fluoresce light-green by itself, but spots of analyte quench this fluorescence.
- Iodine vapors are a general unspecific color reagent
- Specific color reagents into which the TLC plate is dipped or which are sprayed onto the plate exist.[8][9][10]
- Potassium permanganate - oxidation
- Bromine
- In the case of lipids, the chromatogram may be transferred to a PVDF membrane and then subjected to further analysis, for example mass spectrometry, a technique known as Far-Eastern blotting.
Once visible, the Rf value, or retardation factor, of each spot can be determined by dividing the distance the product traveled by the distance the solvent front traveled using the initial spotting site as reference. These values depend on the solvent used and the type of TLC plate and are not physical constants.
Applications
Characterization
In organic chemistry, reactions are qualitatively monitored with TLC. Spots sampled with a capillary tube are placed on the plate: a spot of starting material, a spot from the reaction mixture, and a cross-spot with both. A small (3 by 7 cm) TLC plate takes a couple of minutes to run. The analysis is qualitative, and it will show if the starting material has disappeared, i.e. the reaction is complete, if any product has appeared, and how many products are generated (although this might be underestimated due to co-elution). Unfortunately, TLCs from low-temperature reactions may give misleading results, because the sample is warmed to room temperature in the capillary, which can alter the reaction—the warmed sample analyzed by TLC is not the same as what is in the low-temperature flask. One such reaction is the DIBALH reduction of ester to aldehyde.
In one study TLC has been applied in the screening of organic reactions,[11] for example in the fine-tuning of BINAP synthesis from 2-naphthol. In this method, the alcohol and catalyst solution (for instance iron(III) chloride) are placed separately on the base line, then reacted, and then instantly analyzed.
A special application of TLC is in the characterization of radiolabeled compounds, where it is used to determine radiochemical purity. The TLC sheet is visualized using a sheet of photographic film or an instrument capable of measuring radioactivity. It may be visualized using other means as well. This method is much more sensitive than the others and can be used to detect an extremely small amount of a compound, provided that it carries a radioactive atom.
Isolation
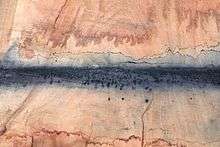
Since different compounds will travel a different distance in the stationary phase, chromatography can in effect be used as an isolation technique. The separated compounds each occupying a specific area on the plate, they can be scraped away, put in another solvent to separate them from the stationary phase and used for further analysis. As an example, in the chromatography of an extract of green leaves (for example spinach) in 7 stages of development, Carotene elutes quickly and is only visible until step 2. Chlorophyll A and B are halfway in the final step and lutein the first compound staining yellow. Once the chromatography is over, the carotene can be removed from the plate, put back into a solvent and ran into a spectrophotometer to characterize its wavelength absorption.
 Step 1
 Step 2
 Step 3
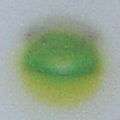 Step 4
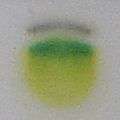 Step 5
 Step 6
 Step 7
References
- ↑ Harry W. Lewis & Christopher J. Moody (13 Jun 1989). Experimental Organic Chemistry: Principles and Practice (Illustrated ed.). WileyBlackwell. pp. 159–173. ISBN 978-0-632-02017-1.
- ↑ A.I. Vogel; A.R. Tatchell; B.S. Furnis; A.J. Hannaford & P.W.G. Smith. Vogel's Textbook of Practical Organic Chemistry (5th ed.). ISBN 0-582-46236-3.
- 1 2 Reich, E.; Schibli A. (2007). High-performance thin-layer chromatography for the analysis of medicinal plants (Illustrated ed.). New York: Thieme. ISBN 3-13-141601-7.
- ↑ Tables showing the thickness value of commercial regular and preparative Thin Layer Chromatography plates
- ↑ Thin Layer Chromatography: How To http://www.reachdevices.com/TLC.html
- 1 2 Thin Layer Chromatography (TLC): Principle with animation
- ↑ Fair, J. D.; Kormos, C. M. J. Chromatogr. A 2008, 1211(1-2), 49-54. (doi:10.1016/j.chroma.2008.09.085)
- ↑ Thin Layer Chromatography stains http://www.reachdevices.com/TLC_stains.html
- ↑ Jork, H., Funk, W., Fischer, W., Wimmer, H. (1990)
- ↑ Jork, H., Funk, W., Fischer, W., Wimmer, H. (1994)
- ↑ TLC plates as a convenient platform for solvent-free reactions Jonathan M. Stoddard, Lien Nguyen, Hector Mata-Chavez and Kelly Nguyen Chem. Commun., 2007, 1240 - 1241, doi:10.1039/b616311d
Bibliography
- F. Geiss (1987): Fundamentals of thin layer chromatography planar chromatography, Heidelberg, Hüthig, ISBN 3-7785-0854-7
- Jork, H., Funk, W., Fischer, W., Wimmer, H. (1990): Thin-Layer Chromatography: Reagents and Detection Methods, Volume 1a, VCH, Weinheim, ISBN 3-527-278834
- Jork, H., Funk, W., Fischer, W., Wimmer, H. (1994): Thin-Layer Chromatography: Reagents and Detection Methods, Volume 1b, VCH, Weinheim
- Justus G. Kirchner (1978): Thin-layer chromatography, 2nd edition, Wiley
- Joseph Sherma, Bernard Fried (1991): Handbook of Thin-Layer Chromatography (= Chromatographic Science. Bd. 55). Marcel Dekker, New York NY, ISBN 0-8247-8335-2.
- Elke Hahn-Deinstorp: Applied Thin-Layer Chromatography. Best Practice and Avoidance of Mistakes. Wiley-VCH, Weinheim u. a. 2000, ISBN 3-527-29839-8