Temperature record
- For extreme records instead of records as a set of data, see List of weather records

The temperature record shows the fluctuations of the temperature of the atmosphere and the oceans through various spans of time. The most detailed information exists since 1850, when methodical thermometer-based records began. There are numerous estimates of temperatures since the end of the Pleistocene glaciation, particularly during the current Holocene epoch. Older time periods are studied by paleoclimatology.
Satellite and balloon (1950s-present)

Weather balloon radiosonde measurements of atmospheric temperature at various altitudes begin to show an approximation of global coverage in the 1950s. Since December 1978, microwave sounding units on satellites have produced data which can be used to infer temperatures in the troposphere.
Several groups have analyzed the satellite data to calculate temperature trends in the troposphere. Both the University of Alabama in Huntsville (UAH) and the private, NASA funded, corporation Remote Sensing Systems RSS (RSS) find an upward trend.
For the lower troposphere (TLT), UAH find a global average trend since 1978 of +0.140 °C/decade, to January 2011.[1] RSS finds +0.148 °C/decade, to January 2011.[2]
In 2004 Fu et al. found trends of +0.19 °C/decade when applied to the RSS dataset.[3] Vinnikov and Grody found +0.20 °C/decade up between 1978 and 2005, since which the dataset has not been updated.[4]
Thermometers (1850-present)
Detailed information exists since 1850, when methodical thermometer-based records began.
Tree rings and ice cores (from 1,000-2,000 years before present)
Proxy measurements can be used to reconstruct the temperature record before the historical period. Quantities such as tree ring widths, coral growth, isotope variations in ice cores, ocean and lake sediments, cave deposits, fossils, ice cores, borehole temperatures, and glacier length records are correlated with climatic fluctuations. From these, proxy temperature reconstructions of the last 2000 years have been performed for the northern hemisphere, and over shorter time scales for the southern hemisphere and tropics.[5][6][7]
Geographic coverage by these proxies is necessarily sparse, and various proxies are more sensitive to faster fluctuations. For example, tree rings, ice cores, and corals generally show variation on an annual time scale, but borehole reconstructions rely on rates of thermal diffusion, and small scale fluctuations are washed out. Even the best proxy records contain far fewer observations than the worst periods of the observational record, and the spatial and temporal resolution of the resulting reconstructions is correspondingly coarse. Connecting the measured proxies to the variable of interest, such as temperature or rainfall, is highly non-trivial. Data sets from multiple complementary proxies covering overlapping time periods and areas are reconciled to produce the final reconstructions.[8][9]
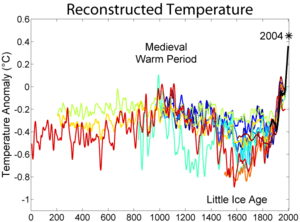
Proxy reconstructions extending back 2,000 years have been performed, but reconstructions for the last 1,000 years are supported by more and higher quality independent data sets. These reconstructions indicate:[10]
- global mean surface temperatures over the last 25 years have been higher than any comparable period since AD 1600, and probably since AD 900
- there was a Little Ice Age centered on AD 1700
- there was a Medieval Warm Period centered on AD 1000, though the exact timing and magnitude are uncertain and may have shown regional variation.
Indirect historical proxies
As well as natural, numerical proxies (tree-ring widths, for example) there exist records from the human historical period that can be used to infer climate variations, including: reports of frost fairs on the Thames; records of good and bad harvests; dates of spring blossom or lambing; extraordinary falls of rain and snow; and unusual floods or droughts.[11] Such records can be used to infer historical temperatures, but generally in a more qualitative manner than natural proxies.
Recent evidence suggests that a sudden and short-lived climatic shift between 2200 and 2100 BCE occurred in the region between Tibet and Iceland, with some evidence suggesting a global change. The result was a cooling and reduction in precipitation. This is believed to be a primary cause of the collapse of the Old Kingdom of Egypt.[12]
Paleoclimate (from 12,000 years before present)

Many estimates of past temperatures have been made over Earth's history. The field of paleoclimatology includes ancient temperature records. As the present article is oriented toward recent temperatures, there is a focus here on events since the retreat of the Pleistocene glaciers. The 10,000 years of the Holocene epoch covers most of this period, since the end of the Northern Hemisphere's Younger Dryas millennium-long cooling. The Holocene Climatic Optimum was generally warmer than the 20th century, but numerous regional variations have been noted since the start of the Younger Dryas.
Ice cores (from 800,000 years before present)

Even longer term records exist for few sites: the recent Antarctic EPICA core reaches 800 kyr; many others reach more than 100,000 years. The EPICA core covers eight glacial/interglacial cycles. The NGRIP core from Greenland stretchs back more than 100 kyr, with 5 kyr in the Eemian interglacial. Whilst the large-scale signals from the cores are clear, there are problems interpreting the detail, and connecting the isotopic variation to the temperature signal.
Geologic evidence (millions of years)
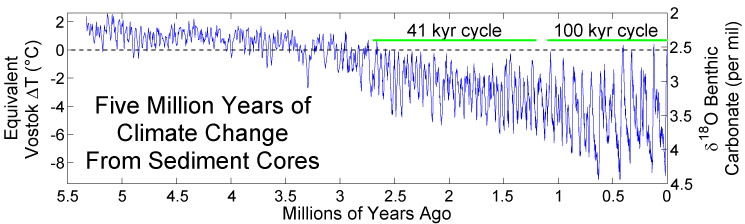
On longer time scales, sediment cores show that the cycles of glacials and interglacials are part of a deepening phase within a prolonged ice age that began with the glaciation of Antarctica approximately 40 million years ago. This deepening phase, and the accompanying cycles, largely began approximately 3 million years ago with the growth of continental ice sheets in the Northern Hemisphere. Gradual changes in Earth's climate of this kind have been frequent during the Earth's 4500 million year existence and most often are attributed to changes in the configuration of continents and ocean sea ways.
See also
- CLIWOC (climatological database for the world's oceans)
- Dendroclimatology
References
- ↑ "MONTHLY MEANS OF LOWER TROPOSPHERE LT5.4". UAH. Retrieved 26 February 2011.
- ↑ "RSS / MSU and AMSU Data / Description". Retrieved 26 February 2011.
- ↑ http://www.ncdc.noaa.gov/temp-and-precip/msu/nature02524-UW-MSU.pdf
- ↑ http://www.atmos.umd.edu/~kostya/CCSP/
- ↑ J.T. Houghton; et al., eds. (2001). "Figure 1: Variations of the Earth's surface temperature over the last 140 years and the last millennium.". Summary for policy makers. IPCC Third Assessment Report - Climate Change 2001 Contribution of Working Group I. Intergovernmental Panel on Climate Change. Retrieved May 12, 2011.
- ↑ J.T. Houghton; et al., eds. (2001). Chapter 2. Observed climate variability and change. Climate Change 2001: Working Group I The Scientific Basis. Intergovernmental Panel on Climate Change. Retrieved May 12, 2011.
- ↑ National Research Council (U.S.). Committee on Surface Temperature Reconstructions for the Last 2,000 Years Surface temperature reconstructions for the last 2,000 years (2006), National Academies Press ISBN 978-0-309-10225-4
- ↑ National Research Council (U.S.). Committee on Surface Temperature Reconstructions for the Last 2,000 Years Surface temperature reconstructions for the last 2,000 years (2006), National Academies Press ISBN 978-0-309-10225-4
- ↑ Michael E. Mann, Zhihua Zhang, Malcolm K. Hughes, Raymond S. Bradley, Sonya K. Miller, Scott Rutherford, and Fenbiao Ni Proxy-based reconstructions of hemispheric and global surface temperature variations over the past two millennia (2008) Proceedings of the National Academy of Sciences doi:10.1073/pnas.0805721105
- ↑ National Research Council (U.S.). Committee on Surface Temperature Reconstructions for the Last 2,000 Years Surface temperature reconstructions for the last 2,000 years (2006), National Academies Press ISBN 978-0-309-10225-4
- ↑ O.Muszkat, The outline of the problems and methods used for research of the history of the climate in the Middle Ages, (in polish), Przemyśl 2014, ISSN 1232-7263
- ↑ The Fall of the Egyptian Old Kingdom Hassan, Fekri BBC June 2001
- ↑ Lisiecki, Lorraine E.; Raymo, Maureen E. (January 2005). "A Pliocene-Pleistocene stack of 57 globally distributed benthic d18O records" (PDF). Paleoceanography. 20: PA1003. doi:10.1029/2004PA001071. Cite uses deprecated parameter
|coauthors=(help)- Supplement: Lisiecki, L. E.; Raymo, M. E. (2005). "Pliocene-Pleistocene stack of globally distributed benthic stable oxygen isotope records". Pangaea. doi:10.1594/PANGAEA.704257. Cite uses deprecated parameter
|coauthors=(help)
- Supplement: Lisiecki, L. E.; Raymo, M. E. (2005). "Pliocene-Pleistocene stack of globally distributed benthic stable oxygen isotope records". Pangaea. doi:10.1594/PANGAEA.704257. Cite uses deprecated parameter
- ↑ Petit, J. R.; Jouzel, J.; Raynaud, D.; Barkov, N. I.; Barnola, J. M.; Basile, I.; Bender, M.; Chappellaz, J.; Davis, J.; Delaygue, G.; Delmotte, M.; Kotlyakov, V. M.; Legrand, M.; Lipenkov, V.; Lorius, C.; Pépin, L.; Ritz, C.; Saltzman, E.; Stievenard, M. (1999). "Climate and Atmospheric History of the Past 420,000 years from the Vostok Ice Core, Antarctica". Nature. 399: 429–436. doi:10.1038/20859. Cite uses deprecated parameter
|coauthors=(help)
- Global average temperature for the last 150 years and discussion of trends
- Preliminary data from the last 2000 years
- Temperature data Climatic Research Unit, University of East Anglia, Norwich, UK. Philip D. Jones and other.
- Hadley Centre: Global temperature data
- NASA's Goddard Institute for Space Studies (GISS) — Global Temperature Trends.
- Surface Temperature Reconstructions for the last 2,000 Years