Sutton and Cheam (UK Parliament constituency)
| Sutton and Cheam | |
|---|---|
|
Borough constituency for the House of Commons | |
|
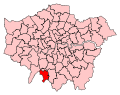
Boundary of Sutton and Cheam in Greater London. | |
| County | Greater London |
| Electorate | 66,147 (December 2010)[1] |
| Current constituency | |
| Created | 1945 |
| Member of parliament | Paul Scully (Conservative) |
| Created from |
Surrey North-Eastern or 'Wimbledon' Mid Surrey or 'Epsom' |
| Overlaps | |
| European Parliament constituency | London |
Sutton and Cheam is a constituency[n 1] represented in the House of Commons of the UK Parliament by Paul Scully, a Conservative.[n 2]
History
Political history
In the media, the constituency has to date been most widely reported on a 1972 gain, with a huge 32.6% swing to the Liberal Party in the by-election of that year.[2]
This seat is a marginal seat taking its history together, which has seen three changes, alternating between its two main parties since 1945, although sometimes in this period its member has enjoyed a formidable majority, sufficient to suggest a safe seat. This seat has not been held by a Labour Party MP – the last finish in second place for the party in this seat was in 1970.
Prominent members
Richard Sharples, the second member since 1945, was a former major in the army, served as Minister of State at the Home Office, before resigning his seat in 1972 to take up the position of Governor of Bermuda.
The present member, Paul Scully, was elected in the 2015 election, the Conservatives' first win since 1997 (held by the Liberal Democrats from 1997-2015).
Boundaries
1945–1950: The Municipal Boroughs of Sutton and Cheam.
1950–1974: The Municipal Borough of Sutton and Cheam.
1974–1983: The London Borough of Sutton wards of Belmont, Cheam North, Cheam South, Cheam West, Sutton Central, Sutton East, Sutton North, Sutton North East, Sutton South, Sutton South East, Worcester Park North, and Worcester Park South.
1983–2010: The London Borough of Sutton wards of Belmont, Cheam South, Cheam West, North Cheam, Rosehill, Sutton Central, Sutton Common, Sutton East, Sutton South, Sutton West, Worcester Park North, and Worcester Park South.
2010–present: The London Borough of Sutton wards of Belmont, Cheam, Nonsuch, Stonecot, Sutton Central, Sutton North, Sutton South, Sutton West, and Worcester Park.
Constituency profile
The area still maintains separate schooling systems, with grammar schools and comprehensive schools, similar to Kingston upon Thames and features more semi-detached, terraced and detached properties than the Greater London average.[3] Workless claimants, registered jobseekers, were in November 2012 significantly lower than the national average of 3.8%, at 2.1% of the population based on a statistical compilation by The Guardian.[4]
Members of Parliament
Elections
Elections in the 2010s
| Party | Candidate | Votes | % | ± | |
|---|---|---|---|---|---|
| Conservative | Paul Scully | 20,732 | 41.5 | -0.8 | |
| Liberal Democrat | Paul Burstow | 16,811 | 33.7 | -12.0 | |
| Labour | Emily Brothers[8] | 5,546 | 11.1 | +4.2 | |
| UKIP | Angus Dalgleish | 5,341 | 10.7 | +8.7 | |
| Green | Maeve Tomlinson | 1,051 | 2.1 | +1.6 | |
| National Health Action | Dave Ash[9] | 345 | 0.7 | n/a | |
| TUSC | Pauline Gorman | 79 | 0.2 | n/a | |
| Majority | 3,921 | 7.9 | |||
| Turnout | 49,905 | 72.1 | -0.7 | ||
| Conservative gain from Liberal Democrat | Swing | +5.6 | |||
| Party | Candidate | Votes | % | ± | |
|---|---|---|---|---|---|
| Liberal Democrat | Paul Burstow | 22,156 | 45.7 | −1.2 | |
| Conservative | Philippa Stroud | 20,548 | 42.4 | +1.7 | |
| Labour | Kathy Allen | 3,376 | 7.0 | −4.9 | |
| BNP | John Clarke | 1,014 | 2.1 | N/A | |
| UKIP | David Pickles | 950 | 2.0 | N/A | |
| Green | Peter Hickson | 246 | 0.5 | N/A | |
| English Democrat | John Dodds | 106 | 0.2 | N/A | |
| Christian Peoples | Matthew Connolly | 52 | 0.1 | N/A | |
| Libertarian | Martin Cullip | 41 | 0.1 | N/A | |
| Independents Federation UK | Brian Hammond | 19 | 0.0 | N/A | |
| Majority | 1,608 | 3.3 | −2.9 | ||
| Turnout | 48,508 | 72.8 | +5.5 | ||
| Liberal Democrat hold | Swing | −1.5 | |||
Elections in the 2000s
| Party | Candidate | Votes | % | ± | |
|---|---|---|---|---|---|
| Liberal Democrat | Paul Burstow | 19,768 | 47.1 | -1.7 | |
| Conservative | Richard Willis | 16,922 | 40.4 | +2.4 | |
| Labour | Anand Shukla | 4,954 | 11.8 | -1.4 | |
| Rainbow Dream Ticket | Rainbow George Weiss | 288 | 0.7 | +0.7 | |
| Majority | 2,846 | 6.8 | |||
| Turnout | 41,932 | 66.2 | +3.8 | ||
| Liberal Democrat hold | Swing | -2.0 | |||
| Party | Candidate | Votes | % | ± | |
|---|---|---|---|---|---|
| Liberal Democrat | Paul Burstow | 19,382 | 48.8 | +6.5 | |
| Conservative | Lady Olga Maitland | 15,078 | 38.0 | +0.1 | |
| Labour | Lisa Homan | 5,263 | 13.2 | -2.2 | |
| Majority | 4,304 | 10.8 | |||
| Turnout | 39,723 | 62.4 | -12.5 | ||
| Liberal Democrat hold | Swing | +3.2 | |||
Elections in the 1990s
| Party | Candidate | Votes | % | ± | |
|---|---|---|---|---|---|
| Liberal Democrat | Paul Burstow | 19,919 | 42.30 | ||
| Conservative | Lady Olga Maitland | 17,822 | 37.85 | ||
| Labour | Mark Allison | 7,280 | 15.5 | ||
| Referendum | Peter Atkinson | 1,784 | 3.8 | ||
| UKIP | Simon Mckie | 191 | 0.4 | ||
| Natural Law | Deborah Wright | 96 | 0.20 | ||
| Majority | 2,097 | 4.45 | |||
| Turnout | 47,092 | ||||
| Liberal Democrat gain from Conservative | Swing | 12.90 | |||
| Party | Candidate | Votes | % | ± | |
|---|---|---|---|---|---|
| Conservative | Lady Olga Maitland | 27,710 | 55.18 | ||
| Liberal Democrat | Paul Burstow | 16,954 | 33.76 | ||
| Labour | G. C. Martin | 4,980 | 9.92 | ||
| Green | J. Duffy | 444 | 0.88 | ||
| Natural Law | A. Hatchard | 133 | 0.26 | ||
| Majority | 10,756 | 21.42 | |||
| Turnout | 82.40 | ||||
| Conservative hold | Swing | ||||
Elections in the 1980s
| Party | Candidate | Votes | % | ± | |
|---|---|---|---|---|---|
| Conservative | Sir Neil Macfarlane | 29,710 | 60.75 | ||
| Liberal | Robert Douglas Greig | 13,992 | 28.61 | ||
| Labour | Loraine Monk | 5,202 | 10.64 | ||
| Majority | 15,718 | 32.14 | |||
| Turnout | 48,904 | 76.6 | |||
| Conservative hold | Swing | ||||
| Party | Candidate | Votes | % | ± | |
|---|---|---|---|---|---|
| Conservative | Sir Neil Macfarlane | 26,782 | 57.1 | ||
| Liberal | C. Caswill | 16,518 | 35.2 | ||
| Labour | G.S. Dixon | 3,568 | 7.6 | ||
| Majority | 10,264 | 21.9 | |||
| Turnout | 46,868 | 74.3 | |||
| Conservative hold | Swing | ||||
Elections in the 1970s
| Party | Candidate | Votes | % | ± | |
|---|---|---|---|---|---|
| Conservative | Sir David Neil Macfarlane | 28,842 | 58.0 | ||
| Liberal | Christopher Caswill | 13,136 | 26.4 | ||
| Labour | N. Irwin | 7,126 | 14.3 | ||
| National Front | J. Hunt | 465 | 0.9 | ||
| Independent | J. Smoker | 128 | 0.2 | ||
| Majority | 15,706 | 31.9 | |||
| Turnout | 49,277 | 78.8 | |||
| Conservative hold | Swing | ||||
| Party | Candidate | Votes | % | ± | |
|---|---|---|---|---|---|
| Conservative | Sir David Neil Macfarlane | 22,156 | 47.6 | ||
| Liberal | Graham Norman Tope | 16,995 | 36.5 | ||
| Labour | James Kenneth Rhodes | 7,118 | 15.3 | ||
| Women's Rights | Dr. Una Margaret Patricia Kroll | 298 | 0.6 | ||
| Majority | 5,161 | 11.1 | |||
| Turnout | 46,567 | 76.9 | |||
| Conservative hold | Swing | ||||
| Party | Candidate | Votes | % | ± | |
|---|---|---|---|---|---|
| Conservative | Sir David Neil Macfarlane | 22,555 | 45.4 | ||
| Liberal | Graham Norman Tope | 20,836 | 42.0 | ||
| Labour | James Kenneth Rhodes | 6,270 | 12.6 | ||
| Majority | 1,719 | 3.5 | |||
| Turnout | 49,661 | 82.6 | |||
| Conservative gain from Liberal | Swing | ||||
| Party | Candidate | Votes | % | ± | |
|---|---|---|---|---|---|
| Liberal | Graham Norman Tope | 18,328 | 53.6 | +39.0 | |
| Conservative | David Neil Macfarlane | 10,911 | 31.9 | -26.2 | |
| Labour | David Miller | 2,937 | 8.6 | -18.7 | |
| Anti-Common Market | Chris Frere-Smith | 1,332 | 3.9 | ||
| National Independence | Edgar Scruby | 660 | 1.9 | ||
| Majority | 7,417 | 21.7 | |||
| Turnout | 34,204 | ||||
| Liberal gain from Conservative | Swing | ||||
| Party | Candidate | Votes | % | ± | |
|---|---|---|---|---|---|
| Conservative | Richard Sharples | 23,957 | 58.1 | ||
| Labour | J. Dowsett | 11,261 | 27.3 | ||
| Liberal | N. D. M. McGeorge | 6,023 | 14.6 | ||
| Majority | 12,696 | 30.8 | |||
| Turnout | 41,241 | 67.6 | |||
| Conservative hold | Swing | ||||
Elections in the 1960s
| Party | Candidate | Votes | % | ± | |
|---|---|---|---|---|---|
| Conservative | Richard C Sharples | 22,331 | 51.10 | ||
| Labour | Frank J Ward | 13,235 | 30.29 | ||
| Liberal | Nicholas DM McGeorge | 8,134 | 18.61 | ||
| Majority | 9,096 | 20.81 | |||
| Turnout | 76.36 | ||||
| Conservative hold | Swing | ||||
| Party | Candidate | Votes | % | ± | |
|---|---|---|---|---|---|
| Conservative | Richard C Sharples | 22,975 | 52.65 | ||
| Labour | P. Derrick | 11,839 | 27.13 | ||
| Liberal | J. Montgomerie | 8,827 | 20.23 | ||
| Majority | 11,136 | 25.52 | |||
| Turnout | 74.27 | ||||
| Conservative hold | Swing | ||||
Elections in the 1950s
| Party | Candidate | Votes | % | ± | |
|---|---|---|---|---|---|
| Conservative | Richard Sharples | 27,344 | 58.32 | ||
| Labour | Frank Judd | 11,946 | 25.48 | ||
| Liberal | John Montgomerie | 7,600 | 16.21 | ||
| Majority | 15,398 | 32.84 | |||
| Turnout | 79.61 | ||||
| Conservative hold | Swing | ||||
| Party | Candidate | Votes | % | ± | |
|---|---|---|---|---|---|
| Conservative | Richard Sharples | 29,538 | 66.02 | ||
| Labour | R. M. Lewis | 15,205 | 33.98 | ||
| Majority | 14,333 | 32.03 | |||
| Turnout | 76.45 | ||||
| Conservative hold | Swing | ||||
| Party | Candidate | Votes | % | ± | |
|---|---|---|---|---|---|
| Conservative | Richard Sharples | 21,930 | |||
| Labour | N. T. Poulter | 11,023 | |||
| Majority | 10,907 | ||||
| Turnout | |||||
| Conservative hold | Swing | ||||
| Party | Candidate | Votes | % | ± | |
|---|---|---|---|---|---|
| Conservative | Sidney Marshall | 30,684 | 62.77 | ||
| Labour | E. K. I. Hurst | 18,202 | 37.23 | ||
| Majority | 12,482 | 25.53 | |||
| Turnout | 81.68 | ||||
| Conservative hold | Swing | ||||
| Party | Candidate | Votes | % | ± | |
|---|---|---|---|---|---|
| Conservative | Sidney Marshall | 29,200 | 56.93 | ||
| Labour | Helen O. Judd | 17,706 | 34.52 | ||
| Liberal | H. J. Wheeler | 4,389 | 8.56 | ||
| Majority | 11,494 | 22.41 | |||
| Turnout | 86.73 | ||||
| Conservative hold | Swing | ||||
Election in the 1940s
| Party | Candidate | Votes | % | ± | |
|---|---|---|---|---|---|
| Conservative | Sidney Marshall | 19,431 | 46.04 | N/A | |
| Labour | Helen O. Judd | 17,293 | 40.97 | N/A | |
| Liberal | J. P. Hughes | 5,483 | 12.99 | N/A | |
| Majority | 2,138 | 5.07 | N/A | ||
| Turnout | 75.72 | N/A | |||
| Conservative win (new seat) | |||||
See also
Notes and references
- Notes
- ↑ A borough constituency (for the purposes of election expenses and type of returning officer)
- ↑ As with all constituencies, the constituency elects one Member of Parliament (MP) by the first past the post system of election at least every five years.
- References
- ↑ "Electorate Figures – Boundary Commission for England". 2011 Electorate Figures. Boundary Commission for England. 4 March 2011. Retrieved 13 March 2011.
- ↑ "BBC NEWS – UK – UK Politics – Memorable by-election results". bbc.co.uk.
- ↑ "2011 Census Interactive – ONS". ons.gov.uk.
- ↑ Unemployment claimants by constituency The Guardian
- ↑ Leigh Rayment's Historical List of MPs – Constituencies beginning with "S" (part 6)
- ↑ "Election Data 2015". Electoral Calculus. Archived from the original on 17 October 2015. Retrieved 17 October 2015.
- ↑ https://www.sutton.gov.uk/news/article/202/election_results
- ↑ "Ed Miliband hails transgender Labour candidate Emily Brothers". BBC News.
- ↑ Giselle Green. "Dave Ash". NHA Party.
- ↑ "Election Data 2010". Electoral Calculus. Archived from the original on 26 July 2013. Retrieved 17 October 2015.
- ↑ http://www.sutton.gov.uk/CHttpHandler.ashx?id=9781&p=0
- ↑ "Election Data 2005". Electoral Calculus. Archived from the original on 15 October 2011. Retrieved 18 October 2015.
- ↑ "Election Data 2001". Electoral Calculus. Archived from the original on 15 October 2011. Retrieved 18 October 2015.
- ↑ "Election Data 1997". Electoral Calculus. Archived from the original on 15 October 2011. Retrieved 18 October 2015.
- ↑ "Election Data 1992". Electoral Calculus. Archived from the original on 15 October 2011. Retrieved 18 October 2015.
- ↑ "Election Data 1987". Electoral Calculus. Archived from the original on 15 October 2011. Retrieved 18 October 2015.
- ↑ "Election Data 1983". Electoral Calculus. Archived from the original on 15 October 2011. Retrieved 18 October 2015.
Coordinates: 51°21′43″N 0°12′32″W / 51.362°N 0.209°W