Summit County, Utah
| Summit County, Utah | |
|---|---|
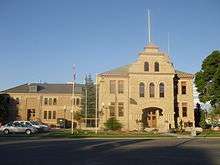 Summit County Courthouse in Coalville | |
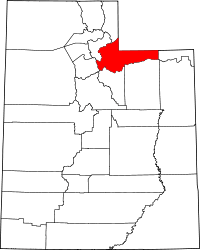 Location in the U.S. state of Utah | |
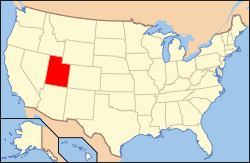 Utah's location in the U.S. | |
| Founded | 1861 |
| Named for | The summits of the mountains |
| Seat | Coalville |
| Largest city | Park City |
| Area | |
| • Total | 1,882 sq mi (4,874 km2) |
| • Land | 1,872 sq mi (4,848 km2) |
| • Water | 10 sq mi (26 km2), 0.5% |
| Population | |
| • (2010) | 36,324 |
| • Density | 19/sq mi (7/km²) |
| Congressional district | 1st |
| Time zone | Mountain: UTC-7/-6 |
| Website |
www |
Summit County is a county located in the U.S. state of Utah, occupying a rugged and mountainous area. As of the 2010 census, the population was 36,324.[1] Its county seat is Coalville,[2] and the largest city is Park City. The county was created in 1854 and later organized in 1861.[3] It is so named because it includes 39 of the highest mountain peaks in Utah.
The county's mean elevation is 8,388 feet (2,557 m) above sea level, which is the second-highest of any county outside Colorado.[4] Owing to its proximity to Salt Lake City, Park City has acquired a reputation as an upscale getaway, bringing new development to the area.
Summit County comprises the Summit Park, UT Micropolitan Statistical Area, which is also included in the Salt Lake City-Provo-Orem, UT Combined Statistical Area.
Geography
According to the U.S. Census Bureau, the county has a total area of 1,882 square miles (4,870 km2), of which 1,872 square miles (4,850 km2) is land and 10 square miles (26 km2) (0.5%) is water.[5]
Adjacent counties
- Rich County (north)
- Morgan County (northwest)
- Salt Lake County (west)
- Wasatch County (south)
- Duchesne County (south)
- Daggett County (east)
- Sweetwater County, Wyoming (northeast)
- Uinta County, Wyoming (north)
National protected areas
- Ashley National Forest (part)
- Wasatch National Forest (part)
Demographics
| Historical population | |||
|---|---|---|---|
| Census | Pop. | %± | |
| 1860 | 198 | — | |
| 1870 | 2,512 | 1,168.7% | |
| 1880 | 4,921 | 95.9% | |
| 1890 | 7,733 | 57.1% | |
| 1900 | 9,439 | 22.1% | |
| 1910 | 8,200 | −13.1% | |
| 1920 | 7,862 | −4.1% | |
| 1930 | 9,527 | 21.2% | |
| 1940 | 8,714 | −8.5% | |
| 1950 | 6,745 | −22.6% | |
| 1960 | 5,673 | −15.9% | |
| 1970 | 5,879 | 3.6% | |
| 1980 | 10,198 | 73.5% | |
| 1990 | 15,518 | 52.2% | |
| 2000 | 29,736 | 91.6% | |
| 2010 | 36,324 | 22.2% | |
| Est. 2015 | 39,633 | [6] | 9.1% |
| U.S. Decennial Census[7] 1790–1960[8] 1900–1990[9] 1990–2000[10] 2010–2014[1] | |||
As of the census[11] of 2000, there were 29,736 people, 10,332 households, and 7,501 families residing in the county. The population density was 16 people per square mile (6.2/km2). There were 17,489 housing units at an average density of 9 per square mile (3.5/km2). The racial makeup of the county was 91.80% White, 0.24% Black or African American, 0.31% Native American, 0.96% Asian, 0.04% Pacific Islander, 5.43% from other races, and 1.21% from two or more races. 8.09% of the population were Hispanic or Latino of any race.
There were 10,332 households out of which 40.80% had children under the age of 18 living with them, 63.50% were married couples living together, 6.20% had a female householder with no husband present, and 27.40% were non-families. 18.40% of all households were made up of individuals and 3.20% had someone living alone who was 65 years of age or older. The average household size was 2.87 and the average family size was 3.30.
The median income for a household in the county was $64,962, and the median income for a family was $72,510. Males had a median income of $47,236 versus $28,621 for females. The per capita income for the county was $33,767. Only 42.9% are natives of Utah. 5.40% of the population and 3.00% of families were below the poverty line.
According to a 2000 survey by the Association of Statisticians of American Religious Bodies, Summit County is much more diverse in religious belief than Utah as a whole. Fully two in five people (44.2%) of the population claim no religion at all while among those that do, The Church of Jesus Christ of Latter-day Saints (LDS Church) make up the largest group at 36.8% (compared with some 66% statewide), followed by Roman Catholics at 10.6%.
Politics
| Year | GOP | DEM | Others |
|---|---|---|---|
| 2016 | 35.6% 7,160 | 50.9% 10,251 | 13.5% 2,722 |
| 2012 | 50.5% 8,884 | 45.8% 8,072 | 2.9% 496 |
| 2008 | 41.2% 6,956 | 56.3% 9,532 | 2.5% 432 |
| 2004 | 51.8% 7,936 | 45.5% 6,977 | 2.7% 399 |
| 2000 | 50.8% 6,168 | 37.9% 4,601 | 11.3% 1,352 |
| 1996 | 41.5% 3,867 | 44.8% 4,177 | 13.7% 1,275 |
| 1992 | 34.7% 3,133 | 32.1% 3,013 | 37.2% 3,253 |
| 1988 | 59.7% 3,881 | 39.0% 2,536 | 1.3% 86 |
| 1984 | 71.8% 4,093 | 27.0% 1,539 | 1.2% 69 |
| 1980 | 65.4% 3,330 | 23.2% 1,184 | 1.9% 99 |
| 1976 | 61.5% 2,316 | 34.1% 1,282 | 4.4% 165 |
| 1972 | 69.9% 2,209 | 26.5% 836 | 3.6% 113 |
| 1968 | 62.4% 1,782 | 33.6% 961 | 4.0% 114 |
| 1964 | 47.1% 1,335 | 52.9% 1,497 | 0.0% 0 |
Summit County has traditionally been a Republican stronghold. In recent years, however, it has become more competitive, and Democrats have at times won a plurality or even a majority of the votes. Although George W. Bush carried the county in 2000 and 2004, his performance there was his worst in the state. In a 2006 U.S. Senate race, Summit County was the only county carried by Democrat Pete Ashdown even as the Republican incumbent Orrin Hatch carried the state as a whole by a 2 to 1 margin. Likewise, in the 2008 U.S. Presidential election, Barack Obama carried the county by a 15.3% margin over John McCain, while McCain carried Utah by 28.1% over Obama.[12] However, in the 2012 presidential election, Republican Mitt Romney defeated Obama in the county, 51% to 46%.[13] In 2016, Democrat Hillary Clinton defeated Republican Donald Trump, 51% to 36%.[12]
In the 2016 Senate race, Summit County was the only county in Utah where a plurality voted for Democratic nominee Misty Snow, who was the first major-party transgender Senate candidate in United States history, thereby making the county the first in the nation to vote for a transgender candidate for the Senate.
On the county level, most of the elected offices are held by Democrats; including four of the five seats on the newly created Summit County Council.[14] -John Hanrahan, D; Claudia McMullin, D; Sally Elliott, D; Chris Robinson, D; David Ure, R
Summit County was one of only two counties (along with Grand County) to vote against Utah's same-sex marriage ban in 2004. In June 2010, Summit County became the sixth local government of Utah to prohibit discrimination in employment or housing based on a person's sexual orientation or gender identity.[15]
Communities
Cities
Towns
Census-designated places
See also
- National Register of Historic Places listings in Summit County, Utah
- Utah Transfer of Public Lands Act
References
- 1 2 "State & County QuickFacts". United States Census Bureau. Retrieved December 29, 2013.
- ↑ "Find a County". National Association of Counties. Retrieved 2011-06-07.
- ↑ "Utah: Individual County Chronologies". Utah Atlas of Historical County Boundaries. The Newberry Library. 2008. Retrieved June 26, 2015.
- ↑ Mean County Elevation Lists
- ↑ "2010 Census Gazetteer Files". United States Census Bureau. August 22, 2012. Retrieved June 25, 2015.
- ↑ "County Totals Dataset: Population, Population Change and Estimated Components of Population Change: April 1, 2010 to July 1, 2015". Retrieved July 2, 2016.
- ↑ "U.S. Decennial Census". United States Census Bureau. Retrieved June 25, 2015.
- ↑ "Historical Census Browser". University of Virginia Library. Retrieved June 25, 2015.
- ↑ Forstall, Richard L., ed. (June 25, 1995). "Population of Counties by Decennial Census: 1900 to 1990". United States Census Bureau. Retrieved March 27, 2015.
- ↑ "Census 2000 PHC-T-4. Ranking Tables for Counties: 1990 and 2000" (PDF). United States Census Bureau. April 2, 2001. Retrieved June 25, 2015.
- ↑ "American FactFinder". United States Census Bureau. Retrieved 2011-05-14.
- 1 2 U.S. Election Atlas
- ↑
- ↑ Summit County Democrats
- ↑ Winters, Rosemary (2010-06-17), "Summit County bans anti-gay discrimination", Salt Lake Tribune, retrieved 2010-06-18
 |
Morgan County | |
|
|
| Salt Lake County | |
Daggett County | ||
| ||||
| | ||||
| Wasatch County, Duchesne County |
Municipalities and communities of Summit County, Utah, United States | ||
|---|---|---|
| Cities | | |
| Towns | ||
| CDPs | ||
| Ghost towns | ||
| Footnotes | ‡This populated place also has portions in an adjacent county or counties | |
Coordinates: 40°53′N 110°58′W / 40.88°N 110.97°W