Suffolk Coastal (UK Parliament constituency)
| Suffolk Coastal | |
|---|---|
|
County constituency for the House of Commons | |
|
Boundary of Suffolk Coastal in Suffolk. | |
|
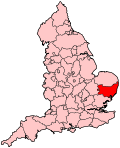
Location of Suffolk within England. | |
| County | Suffolk |
| Electorate | 76,932 (December 2010)[1] |
| Major settlements | Felixstowe |
| Current constituency | |
| Created | 1983 |
| Member of parliament | Therese Coffey (Conservative) |
| Number of members | One |
| Created from | Sudbury & Woodbridge, and Eye[2] |
| Overlaps | |
| European Parliament constituency | East of England |

Suffolk Coastal is a constituency[n 1] represented in the House of Commons of the UK Parliament since 2010 by Therese Coffey, a Conservative.[n 2]
History
This East Anglian constituency was created in 1983.
This seat was held from its creation until the 2010 election by the Conservative John Gummer who had previously represented the former seat of Eye from 1979. The current MP is the Conservative Therese Coffey.[3]
- Prominent members
Lord Deben (as John Gummer) was the Secretary of State for the Environment for four years during the Second Major ministry and before that was for four years the Minister of State for Agriculture, Fisheries and Food. He was the only member for this seat to have achieved the front bench, until Therese Coffey was made Deputy Leader of the House of Commons in May 2015.
Boundaries
1983-1997: The District of Suffolk Coastal.
1997-2010: The District of Suffolk Coastal wards of Aldeburgh, Alderton and Sutton, Bramfield and Cratfield, Buxlow, Felixstowe Central, Felixstowe East, Felixstowe North, Felixstowe South, Felixstowe South East, Felixstowe West, Hollesley, Kelsale, Kirton, Leiston, Martlesham, Melton, Nacton, Orford, Saxmundham, Snape, Trimleys, Tunstall, Ufford, Walberswick, Westleton, Woodbridge Centre, Woodbridge Farlingaye, Woodbridge Kyson, Woodbridge Riverside, and Woodbridge Seckford and Yoxford, and the District of Waveney wards of Blything, Halesworth, and Southwold.
2010-present: The District of Suffolk Coastal wards of Aldeburgh, Farlingaye, Felixstowe East, Felixstowe North, Felixstowe South, Felixstowe South East, Felixstowe West, Hollesley with Eyke, Kyson, Leiston, Martlesham, Melton and Ufford, Nacton, Orford and Tunstall, Peasenhall, Rendlesham, Riverside, Saxmundham, Seckford, Snape, Sutton, Trimleys with Kirton, Walberswick and Wenhaston, and Yoxford, and the District of Waveney wards of Blything, Halesworth, Southwold and Reydon, and Wrentham.
Suffolk Coastal was created from parts of the earlier Sudbury and Woodbridge and Lowestoft constituencies. The main town of the constituency is Felixstowe. Woodbridge is considered part of the extended Ipswich urban area.
The current constituency area includes three former borough constituencies which sent their own MPs to Parliament until abolished as 'rotten boroughs' by the Great Reform Act, 1832 - Aldeburgh, Dunwich and Orford.
Constituency profile
The seat includes the seaside and folk music destination of Aldeburgh, also noted for artwork and the work of Benjamin Britten. Felixstowe is a commercial port for imports and exports. Workless claimants, registered jobseekers, were in November 2012 significantly lower than the national average of 3.8%, at 2.0% of the population based on a statistical compilation by The Guardian.[4] Since its inception Suffolk Coastal has been a safe seat for the Conservative Party typical of more rural districts of East Anglia. In the 1997 Labour national landslide the Conservative candidate held on by a margin of a few thousand votes.
Members of Parliament
| Election | Member[5] | Party | |
|---|---|---|---|
| 1983 | John Gummer | Conservative | |
| 2010 | Therese Coffey | Conservative | |
Elections
Elections in the 2010s
| Party | Candidate | Votes | % | ± | |
|---|---|---|---|---|---|
| Conservative | Therese Coffey | 28,855 | 51.9 | +5.5 | |
| Labour | Russell Whiting | 10,013 | 18.0 | +2.0 | |
| UKIP | Daryll Pitcher | 8,655 | 15.6 | +9.8 | |
| Liberal Democrat | James Sandbach | 4,777 | 8.6 | −21.2 | |
| Green | Rachel Smith-Lyte | 3,294 | 5.9 | +3.9 | |
| Majority | 18,842 | 33.9 | +17.3 | ||
| Turnout | 55,594 | 70.6 | −0.6 | ||
| Conservative hold | Swing | +1.8 | |||
| Party | Candidate | Votes | % | ± | |
|---|---|---|---|---|---|
| Conservative | Therese Coffey | 25,475 | 46.4 | +1.8 | |
| Liberal Democrat | Daisy Cooper | 16,347 | 29.8 | +7.7 | |
| Labour | Adam Leeder | 8,812 | 16.1 | −10.1 | |
| UKIP | Stephen Bush | 3,156 | 5.7 | +1.9 | |
| Green | Rachel Fulcher | 1,103 | 2.0 | −1.3 | |
| Majority | 9,128 | 16.6 | −1.8 | ||
| Turnout | 54,893 | 71.2 | +3.9 | ||
| Conservative hold | Swing | −2.9 | |||
Elections in the 2000s
| Party | Candidate | Votes | % | ± | |
|---|---|---|---|---|---|
| Conservative | John Gummer | 23,415 | 44.6 | +1.3 | |
| Labour | David John Rowe | 13,730 | 26.1 | −8.7 | |
| Liberal Democrat | David Andrew Young | 11,637 | 22.1 | +3.9 | |
| UKIP | Richard John Curtis | 2,020 | 3.8 | +0.1 | |
| Green | Paul Michael Whitlow | 1,755 | 3.3 | N/A | |
| Majority | 9,685 | 18.4 | +9.9 | ||
| Turnout | 52,557 | 67.9 | +2.3 | ||
| Conservative hold | Swing | +5.0 | |||
| Party | Candidate | Votes | % | ± | |
|---|---|---|---|---|---|
| Conservative | John Gummer | 21,847 | 43.3 | +4.8 | |
| Labour | Nigel Robert Gardner | 17,521 | 34.8 | +2.0 | |
| Liberal Democrat | Tony Schur | 9,192 | 18.2 | −3.2 | |
| UKIP | Michael Burn | 1,847 | 3.7 | N/A | |
| Majority | 4,326 | 8.5 | +2.7 | ||
| Turnout | 50,407 | 65.6 | −10.2 | ||
| Conservative hold | Swing | +1.4 | |||
Elections in the 1990s
| Party | Candidate | Votes | % | ± | |
|---|---|---|---|---|---|
| Conservative | John Gummer | 21,696 | 38.6 | −15.0 | |
| Labour | Mark Campbell | 18,442 | 32.8 | +9.0 | |
| Liberal Democrat | Miss Alexandra Jones | 12,036 | 21.4 | −2.4 | |
| Referendum | Stephen Brian Caulfield | 3,416 | 6.1 | N/A | |
| Green | Anthony Charles Slade | 514 | 0.9 | −0.6 | |
| Natural Law | Mrs. Felicity Brigid Kaplan | 152 | 0.3 | −0.1 | |
| Majority | 3,254 | 5.8 | −24.0 | ||
| Turnout | 56,256 | 75.8 | −5.8 | ||
| Conservative hold | Swing | −12.0 | |||
| Party | Candidate | Votes | % | ± | |
|---|---|---|---|---|---|
| Conservative | John Gummer | 34,680 | 53.6 | −2.1 | |
| Liberal Democrat | Peter David Monk | 15,395 | 23.8 | −6.0 | |
| Labour | Terence Edward Hodgson | 13,508 | 20.9 | +8.1 | |
| Green | Anthony Charles Slade | 943 | 1.5 | −0.3 | |
| Natural Law | Mrs. Felicity Brigid Kaplan | 232 | 0.4 | N/A | |
| Majority | 19,285 | 29.8 | +3.9 | ||
| Turnout | 64,758 | 81.6 | +3.7 | ||
| Conservative hold | Swing | +1.9 | |||
Elections in the 1980s
| Party | Candidate | Votes | % | ± | |
|---|---|---|---|---|---|
| Conservative | John Gummer | 32,834 | 55.7 | −2.5 | |
| Social Democratic | Mrs. Joan Margaret Miller | 17,554 | 29.8 | +0.7 | |
| Labour | Mrs. Susan Ann Reeves | 7,534 | 12.8 | +0.2 | |
| Green | James William Holloway | 1,049 | 1.8 | N/A | |
| Majority | 15,280 | 25.9 | |||
| Turnout | 58,971 | 77.9 | |||
| Conservative hold | Swing | ||||
| Party | Candidate | Votes | % | ± | |
|---|---|---|---|---|---|
| Conservative | John Gummer | 31,240 | 58.2 | N/A | |
| Social Democratic | David Houseley | 15,618 | 29.1 | N/A | |
| Labour | Denis William George Ballantyne | 6,780 | 12.6 | N/A | |
| Majority | 15,622 | 29.1 | N/A | ||
| Turnout | 53,638 | 75.0 | N/A | ||
| Conservative win (new seat) | |||||
See also
Notes and references
- Notes
- ↑ A county constituency (for the purposes of election expenses and type of returning officer)
- ↑ As with all constituencies, the constituency elects one Member of Parliament (MP) by the first past the post system of election at least every five years.
- References
- ↑ "Electorate Figures - Boundary Commission for England". 2011 Electorate Figures. Boundary Commission for England. 4 March 2011. Retrieved 13 March 2011.
- ↑ "'Suffolk Coastal', June 1983 up to May 1997". ElectionWeb Project. Cognitive Computing Limited. Retrieved 14 March 2016.
- ↑ "Therese Coffey". United Kingdom Parliament. Retrieved 30 December 2012.
- ↑ Unemployment claimants by constituency The Guardian
- ↑ Leigh Rayment's Historical List of MPs – Constituencies beginning with "S" (part 6)
- ↑ "Election Data 2015". Electoral Calculus. Archived from the original on 17 October 2015. Retrieved 17 October 2015.
- ↑ "2015 Election Results". BBC News. Retrieved 8 May 2015.
- ↑ "Election Data 2010". Electoral Calculus. Archived from the original on 26 July 2013. Retrieved 17 October 2015.
- ↑ "Election Data 2005". Electoral Calculus. Archived from the original on 15 October 2011. Retrieved 18 October 2015.
- ↑ "Election Data 2001". Electoral Calculus. Archived from the original on 15 October 2011. Retrieved 18 October 2015.
- ↑ "Election Data 1997". Electoral Calculus. Archived from the original on 15 October 2011. Retrieved 18 October 2015.
- ↑ "Election Data 1992". Electoral Calculus. Archived from the original on 15 October 2011. Retrieved 18 October 2015.
- ↑ "Politics Resources". Election 1992. Politics Resources. 9 April 1992. Retrieved 6 Dec 2010.
- ↑ "Election Data 1987". Electoral Calculus. Archived from the original on 15 October 2011. Retrieved 18 October 2015.
- ↑ "Election Data 1983". Electoral Calculus. Archived from the original on 15 October 2011. Retrieved 18 October 2015.
Coordinates: 52°09′N 1°30′E / 52.15°N 1.50°E