Spanish general election, 1979
.svg.png)
|
|
|
|
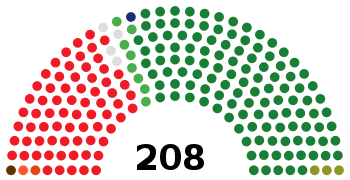
All 350 seats in the Congress of Deputies and 208 (of 218) seats in the Senate
176 seats needed for a majority in the Congress of Deputies |
| Registered |
26,836,490  13.8% 13.8% |
| Turnout |
18,259,192 (68.0%)
 10.8 pp 10.8 pp |
| |
First party |
Second party |
Third party |
| |
.jpg) |
.jpg) |
.jpg) |
| Leader |
Adolfo Suárez |
Felipe González |
Santiago Carrillo |
| Party |
UCD |
PSOE |
PCE |
| Leader since |
3 May 1977 |
13 October 1974 |
3 July 1960 |
| Leader's seat |
Madrid |
Madrid |
Madrid |
| Last election |
165 seats, 34.4% |
124 seats, 33.8%[lower-alpha 1] |
20 seats, 9.3% |
| Seats won |
168 |
121 |
23 |
| Seat change |
3 |
3 |
3 |
| Popular vote |
6,268,593 |
5,469,813 |
1,938,487 |
| Percentage |
34.8% |
30.4% |
10.8% |
| Swing |
0.4 pp |
3.4 pp |
1.5 pp |
|
| |
Fourth party |
Fifth party |
Sixth party |
| |
.jpg) |
.jpg) |
.jpg) |
| Leader |
Manuel Fraga |
Jordi Pujol |
Blas Piñar |
| Party |
CD |
CiU |
UN |
| Leader since |
9 October 1976 |
17 November 1974 |
1979 |
| Leader's seat |
Madrid |
Barcelona |
Madrid |
| Last election |
16 seats, 8.4%[lower-alpha 2] |
13 seats, 3.8%[lower-alpha 3] |
0 seats, 0.4% |
| Seats won |
9 |
8 |
1 |
| Seat change |
7 |
5 |
1 |
| Popular vote |
1,094,438 |
483,353 |
378,964 |
| Percentage |
6.1% |
2.7% |
2.1% |
| Swing |
2.3 pp |
1.1 pp |
1.7 pp |
|

|
| Most voted party by autonomous community and province.
|
|
|
The 1979 Spanish general election was held on Thursday, 1 March 1979, to elect the 1st Cortes Generales of the Kingdom of Spain. All 350 seats in the Congress of Deputies were up for election, as well as 208 of 218 seats in the Senate.[1]
The Union of the Democratic Centre remained the largest party, winning 168 of the 350 seats in the Congress of Deputies and 119 of the 218 seats in the Senate, as such they continued in minority government.
Overview
Electoral system
- Congress of Deputies
The 350 members of the Congress of Deputies were elected in 50 multi-member districts using the D'Hondt method and a closed-list proportional representation. Ceuta and Melilla elected 1 member each using plurality voting. Each district was entitled to an initial minimum of 2 seats, with the remaining 248 seats being allocated among the 50 provinces in proportion to their populations. Only lists polling above 3% of the total vote in each district (which includes blank ballots—for none of the above) were entitled to enter the seat distribution.
- Senate
For the Senate, each of the 47 peninsular provinces was assigned 4 seats. For insular provinces, such as Baleares and Canaries, districts are the islands themselves, with the larger — Mallorca, Gran Canaria, and Tenerife — being assigned 3 seats each, and the smaller — Menorca, Ibiza-Formentera, Fuerteventura, Gomera, Hierro, Lanzarote and La Palma — 1 each. Ceuta and Melilla were assigned 2 seats each, for a total of 208 directly elected seats. In districts electing 4 seats, electors could vote for up to 3 candidates; in those with 2 or 3 seats, for up to 2 candidates; and for 1 candidate in single member constituencies. Electors would vote for individual candidates: those attaining the largest number of votes in each district would be elected for a 4-year term of office.
In addition, the legislative assemblies of the autonomous communities are entitled to appoint at least 1 senator each, as well as 1 senator for every million inhabitants, adding up a variable number of appointed seats to the directly-elected 208 senators.[2] This appointment usually did not take place at the same time that the general election, but when the autonomous communities held their elections.
Eligibility
Dual membership of both chambers of the Cortes or of the Cortes and regional assemblies was prohibited. Active judges, magistrates, public defenders, serving military personnel, active police officers and members of constitutional and electoral tribunals were also ineligible.[3][4]
Parties and coalitions of different parties which had registered with the Electoral Commission could present lists of candidates.[4]
Opinion polls
Poll results are listed in the tables below in reverse chronological order, showing the most recent first, and using the date the survey's fieldwork was done, as opposed to the date of publication. If such date is unknown, the date of publication is given instead. The highest percentage figure in each polling survey is displayed in bold, and the background shaded in the leading party's colour. In the instance that there is a tie, then no figure is shaded. The lead column on the right shows the percentage-point difference between the two parties with the highest figures. When a specific poll does not show a data figure for a party, the party's cell corresponding to that poll is shown empty.
| Polling firm/Link |
Last date
of polling |
 |
.svg.png) |
 |
 |
 |
 |
UN |
Margin
of error |
Sample
size |
Lead |
|
|
|
|
|
|
|
|
| General Election |
March 1, 1979 |
34.8 |
30.4 |
10.7 |
5.9 |
2.7 |
1.6 |
2.1 |
|
|
4.4 |
|
| Sofemasa |
February 21, 1979 |
32.9 |
35.0 |
11.0 |
6.3 |
1.8 |
1.7 |
2.3 |
|
|
2.1 |
| RNC |
February 6, 1979 |
34 |
36 |
14 |
13 |
|
|
|
|
|
2 |
| Gallup |
February 6, 1979 |
30 |
46 |
10 |
13 |
|
|
|
|
|
16 |
| El Imparcial |
February 5, 1979 |
25.6 |
26.1 |
17.5 |
11.6 |
|
|
|
|
|
0.5 |
| Cambio 16 |
February 1, 1979 |
31.0 |
39.5 |
8.3 |
3.4 |
|
|
|
|
|
8.5 |
| Sofemasa |
January 31, 1979 |
32.2 |
35.4 |
9.9 |
3.9 |
|
|
|
|
|
3.2 |
|
| General Election |
June 15, 1977 |
34.4 |
29.3 |
9.3 |
8.2 |
2.8 |
1.6 |
0.4 |
|
|
5.1 |
|
Results
Congress of Deputies
Overall
|
Spanish Socialist Workers' Party (historical) (PSOEh)[lower-alpha 10] |
133,869 | 0.74 | +0.05 |
0 | ±0 |
|
Republican Left of Catalonia–National Front (ERC–FN) |
123,452 | 0.69 | –0.10 |
1 | ±0 |
|
Basque Country Left (EE) |
85,677 | 0.48 | +0.14 |
1 | ±0 |
|
Communist Movement–Communist Left Organization (MC–OIC) |
84,856 | 0.47 | New |
0 | ±0 |
|
Galician National-Popular Bloc (BNPG) |
60,889 | 0.34 | +0.22 |
0 | ±0 |
|
Canarian People's Union (UPC) |
58,953 | 0.33 | New |
1 | +1 |
|
Left Bloc for National Liberation (BEAN) |
56,582 | 0.31 | New |
0 | ±0 |
|
Galician Unity (PG–POG–PSG)[lower-alpha 11] |
55,555 | 0.31 | +0.16 |
0 | ±0 |
|
Republican Left (IR) |
55,384 | 0.31 | New |
0 | ±0 |
|
Carlist Party (PC) |
50,552 | 0.28 | +0.23 |
0 | ±0 |
|
Communist Organization–Communist Unification (OCEBR–UCE) |
47,937 | 0.27 | New |
0 | ±0 |
|
Workers' Communist Party (PCT) |
47,896 | 0.27 | New |
0 | ±0 |
|
Regionalist Aragonese Party (PAR) |
38,042 | 0.21 | +0.01 |
1 | ±0 |
|
Revolutionary Communist League (LCR) |
36,662 | 0.20 | –0.02 |
0 | ±0 |
|
Authentic Spanish Falange of the JONS (FE–JONS(A)) |
30,252 | 0.17 | –0.08 |
0 | ±0 |
|
Navarrese People's Union (UPN) |
28,248 | 0.16 | New |
1 | +1 |
|
Coalition for Aragon (PSAr–PSDA) |
19,220 | 0.11 | New |
0 | ±0 |
| Parties with less than 0.1% of the vote |
160,140 |
0.89 |
— |
0 |
±0 |
|
Nationalist Party of Castile and León (PANCAL) |
16,016 | 0.09 | New |
0 | ±0 |
|
Liberal Party (PL) |
15,774 | 0.09 | New |
0 | ±0 |
|
Valencian Regional Union (URV) |
15,694 | 0.09 | New |
0 | ±0 |
|
Nationalist Party of the Valencian Country (PNPV) |
13,828 | 0.08 | New |
0 | ±0 |
|
Spanish Ruralist Party (PRE) |
10,324 | 0.06 | New |
0 | ±0 |
|
Party of the Canarian Country (PDPCan) |
10,099 | 0.06 | New |
0 | ±0 |
|
Socialists of Mallorca and Menorca (SMiM) |
10,022 | 0.06 | New |
0 | ±0 |
|
Syndicalist Party (PSIN) |
9,777 | 0.05 | New |
0 | ±0 |
|
Union for the Freedom of Speech (ULE) |
7,126 | 0.04 | New |
0 | ±0 |
|
Catalan State (EC) |
6,328 | 0.04 | New |
0 | ±0 |
|
Cantonal Party (PCAN) |
6,290 | 0.03 | New |
0 | ±0 |
|
Independent Candidacy of the Countryside (CIC) |
6,115 | 0.03 | New |
0 | ±0 |
|
Social Christian Democracy of Catalonia (DSCC) |
4,976 | 0.03 | –0.02 |
0 | ±0 |
|
Proverist Party (PPR) |
4,939 | 0.03 | ±0.00 |
0 | ±0 |
|
Spanish Democratic Republican Action (ARDE) |
4,826 | 0.03 | New |
0 | ±0 |
|
Communist League (LC) |
3,614 | 0.02 | New |
0 | ±0 |
|
Asturian Nationalist Council (CNA) |
3,049 | 0.02 | New |
0 | ±0 |
|
Authentic Spanish Falange (FEA) |
2,736 | 0.02 | New |
0 | ±0 |
|
Pro-Austerity Policy Political Party (PIPPA) |
2,409 | 0.01 | New |
0 | ±0 |
|
Workers' Peasant Party (POC) |
2,314 | 0.01 | New |
0 | ±0 |
|
Independent Candidates (CIME) |
1,820 | 0.01 | New |
0 | ±0 |
|
Falangist Unity–Independent Spanish Falange (UF–FI–AT) |
1,188 | 0.01 | New |
0 | ±0 |
|
Spanish Falange–Falangist Unity (FE–UF) |
876 | 0.00 | New |
0 | ±0 |
|
Blank ballots |
57,267 | 0.32 | +0.07 |
|
|
| Total |
17,990,915 | 100.00 | |
350 | ±0 |
|
| Valid votes |
17,990,915 | 98.53 | –0.04 |
|
| Invalid votes |
268,277 | 1.47 | +0.04 |
| Votes cast / turnout |
18,259,192 | 68.04 | –10.79 |
| Abstentions |
8,577,298 | 31.96 | +10.79 |
| Registered voters |
26,836,490 | |
|
| Source: Ministry of the Interior |
- 1 2 Spanish Socialist Workers' Party results are compared to the combined totals of the PSOE and PSP–US in the 1977 election.
- 1 2 Democratic Coalition results are compared to the combined totals of AP and DIV in the 1977 election.
- 1 2 Convergence and Union results are compared to the combined totals of PDC and UC–DCC in the 1977 election.
- ↑ Democratic Coalition results are compared to People's Alliance totals in the 1977 election, excluding Basque Country results.
- ↑ Basque Country Foral Union results are compared to the combined totals of AP in the Basque Country and DIV in the 1977 election.
- ↑ National Union results are compared to National Alliance July 18 totals in the 1977 election.
- ↑ Party of Labour of Spain results are compared to Democratic Left Front totals in the 1977 election.
- ↑ Herri Batasuna results are compared to the combined totals of the ESB/PSV and EAE/ANV in the 1977 election.
- ↑ Workers' Revolutionary Organization results are compared to the combined totals of AET and UNAI in the 1977 election.
- ↑ Spanish Socialist Workers' Party (historical) results are compared to Democratic Socialist Alliance totals in the 1977 election.
- ↑ Galician Unity results are compared to Galician Socialist Party totals in the 1977 election.
|
District summary
Senate
References
|
|---|
|
| General elections | |
|---|
|
| European elections | |
|---|
|
| Local elections | |
|---|
|
| Regional elections | |
|---|
|
| Referendums | |
|---|
|
- See also: Elections and referendums in Andalusia
- Aragon
- Asturias
- Balearic Islands
- Basque Country
- Canary Islands
- Cantabria
- Castile and León
- Castile-La Mancha
- Catalonia
- Extremadura
- Galicia
- Madrid
- Murcia
- Navarre
- La Rioja
- Valencian Community
|