South Suffolk (UK Parliament constituency)
| South Suffolk | |
|---|---|
|
County constituency for the House of Commons | |
|
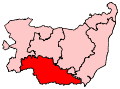
Boundary of South Suffolk in Suffolk. | |
|
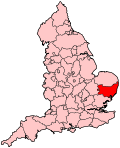
Location of Suffolk within England. | |
| County | Suffolk |
| Electorate | 72,965 (December 2010)[1] |
| Major settlements | Sudbury, Hadleigh and Great Cornard |
| Current constituency | |
| Created | 1983 |
| Member of parliament | James Cartlidge (Conservative) |
| Number of members | One |
| Created from | Sudbury and Woodbridge and Bury St Edmunds[2] |
| Overlaps | |
| European Parliament constituency | East of England |
South Suffolk is a constituency[n 1] represented in the House of Commons of the UK Parliament since 2015 by James Cartlidge, a Conservative.[n 2]
Boundaries
1983-1997: The District of Babergh, and the Borough of St Edmundsbury wards of Cangle, Castle, Cavendish, Chalkstone, Clare, Clements, Hundon, Kedington, St Mary's and Helions, Wickhambrook, and Withersfield.
1997-present: The District of Babergh, and the Borough of St Edmundsbury wards of Cavendish and Clare.
History
South Suffolk is one of seven constituencies in the county of Suffolk and was created by boundary changes during the early 1980s. It has been a constituency in the general election since 1983. In every election the Conservative candidate has been elected or re-elected; until 2015 said candidate was Tim Yeo, who was deselected prior to the 2015 general election; he was succeeded as Conservative candidate, and subsequently MP, by James Cartlidge. Prior to 1983, at least some of the constituency was represented as Sudbury and Woodbridge. Between 1559 and 1844 the constituency of Sudbury represented the town on the southwestern border with Essex, but this constituency was disenfranchised for corruption in 1844.
Constituency profile
South Suffolk is a large and predominantly rural seat, sharing a long border with the county of Essex but retaining a rather different identity and character - distinctly East Anglian rather than Home Counties.
The largest settlements, Sudbury and Hadleigh, are small, quiet towns, somewhat off the beaten track, and the only other significantly built-up area in the seat is the suburb of Pinewood, just outside the limits of the Ipswich, where there are lots of new developments. There is still some industry in Brantham, close to the Essex border, but most of the seat is traditional agriculture, sitting alongside remote commuter bases for those working in London, Ipswich or Colchester.
In common with many seats of this type, it is fairly safe for the Conservatives, with the opponents being significantly lower in terms of the vote share.
Workless claimants were in November 2012 significantly lower than the national average of 3.8%, at 2.5% of the population based on a statistical compilation by The Guardian.[3]
Members of Parliament
| Election | Member[4] | Party | |
|---|---|---|---|
| 1983 | Tim Yeo | Conservative | |
| 2015 | James Cartlidge | Conservative | |
Elections
Elections in the 2010s
| Party | Candidate | Votes | % | ± | |
|---|---|---|---|---|---|
| Conservative | James Cartlidge | 27,546 | 53.1 | +5.4 | |
| Labour | Jane Basham | 10,001 | 19.3 | +5.0 | |
| UKIP | Steven Whalley[6] | 7,897 | 15.2 | +8.1 | |
| Liberal Democrat | Grace Weaver | 4,044 | 7.8 | −23.0 | |
| Green | Robert Lindsay | 2,253 | 4.3 | N/A | |
| Christian Peoples | Stephen Todd[7] | 166 | 0.3 | N/A | |
| Majority | 17,545 | 33.8 | 16.9 | ||
| Turnout | 51,907 | 71.0 | +0.1 | ||
| Conservative hold | Swing | +0.2 | |||
| Party | Candidate | Votes | % | ± | |
|---|---|---|---|---|---|
| Conservative | Tim Yeo | 24,550 | 47.7 | +5.7 | |
| Liberal Democrat | Nigel Bennett | 15,861 | 30.8 | +2.4 | |
| Labour | Emma Bishton | 7,368 | 14.3 | −10.1 | |
| UKIP | David Campbell Bannerman | 3,637 | 7.1 | +2.0 | |
| Majority | 8,689 | 16.9 | +3.3 | ||
| Turnout | 51,416 | 70.9 | +2.1 | ||
| Conservative hold | Swing | +1.6 | |||
Elections in the 2000s
| Party | Candidate | Votes | % | ± | |
|---|---|---|---|---|---|
| Conservative | Tim Yeo | 20,471 | 42.0 | +0.6 | |
| Liberal Democrat | Mrs. Kathy Pollard | 13,865 | 28.5 | +3.6 | |
| Labour | Kevin Craig | 11,917 | 24.5 | −5.7 | |
| UKIP | James Carver | 2,454 | 5.0 | +1.5 | |
| Majority | 6,606 | 13.6 | +2.4 | ||
| Turnout | 48,707 | 71.8 | +5.6 | ||
| Conservative hold | Swing | −4.7 | |||
| Party | Candidate | Votes | % | ± | |
|---|---|---|---|---|---|
| Conservative | Tim Yeo | 18,748 | 41.4 | +4.1 | |
| Labour | Marc ChristopherYoung | 13,667 | 30.2 | +0.9 | |
| Liberal Democrat | Tessa Munt | 11,296 | 24.9 | −2.8 | |
| UKIP | Derek Clifford Allen | 1,582 | 3.5 | N/A | |
| Majority | 5,081 | 11.2 | 3.2 | ||
| Turnout | 45,293 | 66.2 | −11.0 | ||
| Conservative hold | Swing | +3.5 | |||
Elections in the 1990s
| Party | Candidate | Votes | % | ± | |
|---|---|---|---|---|---|
| Conservative | Tim Yeo | 19,402 | 37.3 | −14.0 | |
| Labour | Paul A. Bishop | 15,227 | 29.3 | +7.5 | |
| Liberal Democrat | Mrs. Kathy Pollard | 14,395 | 27.7 | +2.5 | |
| Referendum | Somerset Carlo de Chair | 2,740 | 3.5 | N/A | |
| Natural Law | Angela Holland | 211 | 0.4 | −0.2 | |
| Majority | 4,175 | 8.0 | −25.0 | ||
| Turnout | 51,976 | 77.2 | −4.5 | ||
| Conservative hold | Swing | −9.1 | |||
| Party | Candidate | Votes | % | ± | |
|---|---|---|---|---|---|
| Conservative | Tim Yeo | 34,793 | 50.2 | −3.2 | |
| Liberal Democrat | Mrs. Kathy Pollard | 17,504 | 25.2 | −2.7 | |
| Labour | Stephen Hesford | 16,623 | 24.0 | +5.3 | |
| Natural Law | James Carver | 420 | 0.6 | +0.6 | |
| Majority | 17,289 | 25.0 | −0.5 | ||
| Turnout | 69,340 | 81.7 | +4.1 | ||
| Conservative hold | Swing | −4.3 | |||
Elections in the 1980s
| Party | Candidate | Votes | % | ± | |
|---|---|---|---|---|---|
| Conservative | Tim Yeo | 33,972 | 53.4 | +2.8 | |
| Liberal | Christopher Mark Newens Bradford | 17,729 | 27.9 | −3.4 | |
| Labour | Anthony Colin Bavington | 11,876 | 18.7 | −0.6 | |
| Majority | 16,243 | 25.5 | +6.2 | ||
| Turnout | 81,954 | 77.6 | +1.3 | ||
| Conservative hold | Swing | +3.1 | |||
| Party | Candidate | Votes | % | ± | |
|---|---|---|---|---|---|
| Conservative | Tim Yeo | 29,469 | 50.6 | N/A | |
| Liberal | Richard Edward Kemp | 18,200 | 31.3 | N/A | |
| Labour | Stephen Billcliffe | 10,516 | 18.1 | N/A | |
| Majority | 11,269 | 19.3 | N/A | ||
| Turnout | 76,209 | 76.3 | N/A | ||
| Conservative win (new seat) | |||||
See also
Notes and references
- Notes
- ↑ A county constituency (for the purposes of election expenses and type of returning officer)
- ↑ As with all constituencies, the constituency elects one Member of Parliament (MP) by the first past the post system of election at least every five years.
- References
- ↑ "Electorate Figures - Boundary Commission for England". 2011 Electorate Figures. Boundary Commission for England. 4 March 2011. Retrieved 13 March 2011.
- ↑ "'Suffolk South', June 1983 up to May 1997". ElectionWeb Project. Cognitive Computing Limited. Retrieved 14 March 2016.
- ↑ Unemployment claimants by constituency The Guardian
- ↑ Leigh Rayment's Historical List of MPs – Constituencies beginning with "S" (part 6)
- ↑ "Election Data 2015". Electoral Calculus. Archived from the original on 17 October 2015. Retrieved 17 October 2015.
- ↑ http://ukpollingreport.co.uk/2015guide/suffolksouth/
- ↑ "CPA Candidates for the General Election". Christian Peoples Alliance. Retrieved 1 March 2015.
- ↑ "Election Data 2010". Electoral Calculus. Archived from the original on 17 October 2015. Retrieved 17 October 2015.
- ↑ "Election Data 2005". Electoral Calculus. Archived from the original on 15 October 2011. Retrieved 18 October 2015.
- ↑ "Election Data 2001". Electoral Calculus. Archived from the original on 15 October 2011. Retrieved 18 October 2015.
- ↑ "Election Data 1997". Electoral Calculus. Archived from the original on 15 October 2011. Retrieved 18 October 2015.
- ↑ "Election Data 1992". Electoral Calculus. Archived from the original on 15 October 2011. Retrieved 18 October 2015.
- ↑ "Politics Resources". Election 1992. Politics Resources. 9 April 1992. Retrieved 2010-12-06.
- ↑ "Election Data 1987". Electoral Calculus. Archived from the original on 15 October 2011. Retrieved 18 October 2015.
- ↑ "Election Data 1983". Electoral Calculus. Archived from the original on 15 October 2011. Retrieved 18 October 2015.
Coordinates: 52°00′N 0°54′E / 52.0°N 0.9°E