South East Essex (UK Parliament constituency)
| South East Essex | |
|---|---|
|
Former Borough constituency for the House of Commons | |
| 1955–1983 | |
| Number of members | one |
| Replaced by | Castle Point and Rochford |
| 1885–1950 | |
| Number of members | one |
| Replaced by | Billericay |
| Created from | South Essex |
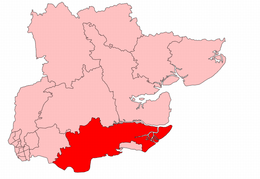
South East Essex (in its first incarnation formally the South Eastern division of Essex) was a parliamentary constituency in Essex in the East of England. It returned one Member of Parliament to the House of Commons of the Parliament of the United Kingdom.
The constituency was created for the 1885 general election, and abolished for the 1950 general election.
The constituency was re-established for the 1955 general election, and abolished again for the 1983 general election.
Boundaries

1918-1945: The Urban Districts of Grays Thurrock, Shoeburyness, and Tilbury, the Rural Districts of Orsett and Rochford, and part of the Rural District of Billericay.
1945-1950: The Urban Districts of Benfleet, Billericay, Canvey Island, and Rayleigh, and part of the County Borough of Southend-on-Sea.
1955-1974: The Urban Districts of Benfleet, Canvey Island, and Rayleigh, and the Rural District of Rochford.
1974-1983: The Urban Districts of Benfleet, Canvey Island, and Rayleigh.
South East Essex originally comprised a large area including modern day Thurrock district, Castle Point district, Rochford, Southend-on-Sea and the Winstree hundred. However, as the population of the area grew, so did its parliamentary representation.
In 1918, the redrawn constituency lost the Winstree hundred and Southend-on-Sea (except Shoeburyness), and gained Billericay.
In 1945, Shoeburyness was transferred to the redrawn Southend constituency, while Thurrock gained its own seat.
Members of Parliament
MPs 1885–1950
| Election | Member | Party | |
|---|---|---|---|
| 1885 | constituency created (South Essex divided) | ||
| 1885 | William Makins | Conservative | |
| 1886 | Carne Rasch | Conservative | |
| 1900 | Edward Tufnell | Conservative | |
| 1906 | Rowland Whitehead | Liberal | |
| Jan. 1910 | John Kirkwood | Conservative | |
| 1912 | Rupert Guinness | Unionist | |
| 1918 | Frank Hilder | Unionist | |
| 1923 | Philip Hoffman | Labour | |
| 1924 | Herbert William Looker | Unionist | |
| 1929 | John Oldfield | Labour | |
| 1931 | Victor Raikes | Conservative | |
| 1945 | Ray Gunter | Labour | |
| 1950 | constituency abolished | ||
MPs 1955–1983
| Election | Member | Party | |
|---|---|---|---|
| 1955 | constituency re-established | ||
| 1955 | Bernard Braine | Conservative | |
| 1983 | constituency abolished | ||
Elections
Elections in the 1880s

| Party | Candidate | Votes | % | ± | |
|---|---|---|---|---|---|
| Conservative | William Thomas Makins | 3,707 | 51.4 | n/a | |
| Liberal | William Henry Wills | 3,500 | 48.6 | n/a | |
| Majority | 207 | 2.8 | n/a | ||
| Turnout | 76.9 | n/a | |||
| Conservative win (new seat) | |||||
| Party | Candidate | Votes | % | ± | |
|---|---|---|---|---|---|
| Conservative | Frederic Carne Rasch | 3,758 | 56.3 | ||
| Liberal | William Henry Wills | 2,916 | 43.7 | ||
| Majority | 842 | 12.6 | |||
| Turnout | 71.3 | ||||
| Conservative hold | Swing | ||||
Elections in the 1890s
| Party | Candidate | Votes | % | ± | |
|---|---|---|---|---|---|
| Conservative | Frederic Carne Rasch | 4,901 | 82.9 | ||
| Liberal | E W Brooks | 4,359 | 47.1 | ||
| Majority | 542 | 5.8 | |||
| Turnout | 77.4 | ||||
| Conservative hold | Swing | ||||
| Party | Candidate | Votes | % | ± | |
|---|---|---|---|---|---|
| Conservative | Frederic Carne Rasch | 5,460 | 60.8 | ||
| Liberal | D. Milne Watson | 3,520 | 39.2 | ||
| Majority | 1,940 | 21.6 | |||
| Turnout | 65.8 | ||||
| Conservative hold | Swing | ||||
Elections in the 1900s
| Party | Candidate | Votes | % | ± | |
|---|---|---|---|---|---|
| Conservative | Edward Tufnell | 5,815 | 56.6 | ||
| Liberal | Rowland Edward Whitehead | 4,461 | 43.4 | ||
| Majority | 1,354 | 13.2 | |||
| Turnout | 67.7 | ||||
| Conservative hold | Swing | ||||

| Party | Candidate | Votes | % | ± | |
|---|---|---|---|---|---|
| Liberal | Rowland Edward Whitehead | 9,230 | 56.3 | +12.9 | |
| Conservative | John Robert Pretyman Newman | 7,170 | 43.7 | -12.9 | |
| Majority | 2,060 | 12.6 | 25.8 | ||
| Turnout | 79.6 | +11.9 | |||
| Liberal gain from Conservative | Swing | +12.9 | |||
Elections in the 1910s
| Party | Candidate | Votes | % | ± | |
|---|---|---|---|---|---|
| Conservative | John Hendley Morrison Kirkwood | 11,199 | 54.7 | ||
| Liberal | Rowland Edward Whitehead | 9,288 | 45.3 | ||
| Majority | 1,911 | 9.4 | |||
| Turnout | 83.1 | ||||
| Conservative gain from Liberal | Swing | ||||
| Party | Candidate | Votes | % | ± | |
|---|---|---|---|---|---|
| Conservative | John Hendley Morrison Kirkwood | 10,108 | 53.2 | ||
| Liberal | John Henry Burrows | 8,891 | 46.8 | ||
| Majority | 1,217 | 6.4 | |||
| Turnout | 77.1 | ||||
| Conservative hold | Swing | ||||
| Party | Candidate | Votes | % | ± | |
|---|---|---|---|---|---|
| Unionist | Rupert Edward Cecil Lee Guinness | unopposed | n/a | n/a | |
| Unionist hold | Swing | n/a | |||
General Election 1914/15:
Another General Election was required to take place before the end of 1915. The political parties had been making preparations for an election to take place and by the July 1914, the following candidates had been selected;
- Unionist: Rupert Guinness
- Liberal:
Elections in the 1920s
| Party | Candidate | Votes | % | ± | |
|---|---|---|---|---|---|
| Labour | Philip Christopher Hoffman | 13,979 | 53.0 | ||
| Unionist | Frank Hilder | 12,379 | 47.0 | ||
| Majority | 1,600 | 6.0 | |||
| Turnout | 58.1 | ||||
| Labour gain from Unionist | Swing | ||||
| Party | Candidate | Votes | % | ± | |
|---|---|---|---|---|---|
| Labour | John Richard Anthony Oldfield | 18,756 | 37.6 | ||
| Unionist | Herbert William Looker | 18,130 | 36.3 | ||
| Liberal | George Thomas Veness | 13,030 | 26.1 | n/a | |
| Majority | 626 | 1.3 | |||
| Turnout | |||||
| Labour gain from Unionist | Swing | ||||
Elections in the 1930s
| Party | Candidate | Votes | % | ± | |
|---|---|---|---|---|---|
| Conservative | Henry Victor Alpin MacKinnon Raikes | 30,436 | 53.4 | ||
| Labour | John Richard Anthony Oldfield | 20,066 | 35.2 | ||
| National Labour | Felix Greene | 6,539 | 11.5 | n/a | |
| Majority | 10,370 | 18.2 | |||
| Turnout | 66.78 | ||||
| Conservative gain from Labour | Swing | ||||
| Party | Candidate | Votes | % | ± | |
|---|---|---|---|---|---|
| Conservative | Henry Victor Alpin MacKinnon Raikes | 25,912 | 44.2 | ||
| Labour | John Richard Anthony Oldfield | 24,942 | 42.5 | ||
| Liberal | Arthur Musgrove Mathews | 7,797 | 13.3 | n/a | |
| Majority | 970 | 1.7 | |||
| Turnout | 59.5 | ||||
| Conservative hold | Swing | ||||
Elections in the 1940s
| Party | Candidate | Votes | % | ± | |
|---|---|---|---|---|---|
| Labour | Raymond Jones Gunter | 25,581 | 53.8 | ||
| Conservative | Aubrey Jones | 21,990 | 46.2 | ||
| Majority | 3,591 | 7.55 | |||
| Turnout | 65.8 | ||||
| Labour gain from Conservative | Swing | ||||
Elections in the 1950s
| Party | Candidate | Votes | % | ± | |
|---|---|---|---|---|---|
| Conservative | Bernard Richard Braine | 20,531 | 59.73 | N/A | |
| Labour | Edward W Harby | 13,841 | 40.27 | N/A | |
| Majority | 6,690 | 19.46 | N/A | ||
| Turnout | 34,372 | 72.93 | N/A | ||
| Registered electors | 47,132 | ||||
| Conservative win (new seat) | |||||
| Party | Candidate | Votes | % | ± | |
|---|---|---|---|---|---|
| Conservative | Bernard Richard Braine | 28,124 | 60.99 | +1.26 | |
| Labour | Reginald M Fryer | 17,991 | 39.01 | -1.26 | |
| Majority | 10,133 | 21.97 | +2.51 | ||
| Turnout | 46,115 | 76.46 | +3.53 | ||
| Registered electors | 60,315 | ||||
| Conservative hold | Swing | +1.26 | |||
Elections in the 1960s
| Party | Candidate | Votes | % | ± | |
|---|---|---|---|---|---|
| Conservative | Bernard Richard Braine | 33,494 | 56.98 | -4.01 | |
| Labour | Anthony Pearson-Clarke | 25,293 | 43.02 | +4.01 | |
| Majority | 8,201 | 13.95 | -8.02 | ||
| Turnout | 58,787 | 75.02 | -1.44 | ||
| Registered electors | 78,364 | ||||
| Conservative hold | Swing | -4.01 | |||
| Party | Candidate | Votes | % | ± | |
|---|---|---|---|---|---|
| Conservative | Bernard Richard Braine | 31,942 | 48.50 | -8.48 | |
| Labour | Derek W Edwards | 26,208 | 39.80 | -3.22 | |
| Liberal | Joyce Arram | 7,706 | 11.70 | N/A | |
| Majority | 5,734 | 8.71 | -5.24 | ||
| Turnout | 65,856 | 77.34 | +2.32 | ||
| Registered electors | 85.151 | ||||
| Conservative hold | Swing | -2.63 | |||
Elections in the 1970s
| Party | Candidate | Votes | % | ± | |
|---|---|---|---|---|---|
| Conservative | Bernard Richard Braine | 41,589 | 57.70 | +9.20 | |
| Labour | Derek W Edwards | 23,684 | 32.86 | -6.94 | |
| Liberal | Christopher H Bohling | 6,811 | 9.45 | -2.25 | |
| Majority | 17,905 | 24.84 | +16.13 | ||
| Turnout | 72,084 | 71.86 | -5.48 | ||
| Registered electors | 85,151 | ||||
| Conservative hold | Swing | +8.07 | |||
| Party | Candidate | Votes | % | ± | |
|---|---|---|---|---|---|
| Conservative | Bernard Richard Braine | 28,644 | 46.26 | -11.44 | |
| Labour | David Bryn Jones | 19,379 | 31.30 | -1.56 | |
| Liberal | Frances Winifred Alexander | 13,891 | 22.44 | +12.99 | |
| Majority | 9,265 | 14.96 | -13.88 | ||
| Turnout | 61,914 | 82.09 | +10.23 | ||
| Registered electors | 75,394 | ||||
| Conservative hold | Swing | -4.94 | |||
| Party | Candidate | Votes | % | ± | |
|---|---|---|---|---|---|
| Conservative | Bernard Richard Braine | 27,348 | 48.81 | +2.54 | |
| Labour | David Bryn Jones | 18,638 | 33.26 | +1.96 | |
| Liberal | Anthony Frankland Crowley Morris | 10,049 | 17.93 | -4.50 | |
| Majority | 8,710 | 15.54 | +0.58 | ||
| Turnout | 56,035 | 73.74 | -8.35 | ||
| Registered electors | 76,013 | ||||
| Conservative hold | Swing | +0.29 | |||
| Party | Candidate | Votes | % | ± | |
|---|---|---|---|---|---|
| Conservative | Bernard Richard Braine | 40,497 | 63.96 | +15.15 | |
| Labour | Nigel John Murray Smith | 15,965 | 25.21 | -8.05 | |
| Liberal | Francis Winifred Alexander | 6,858 | 10.83 | -7.10 | |
| Majority | 24,532 | 38.74 | +23.20 | ||
| Turnout | 63,320 | 76.89 | +3.15 | ||
| Registered electors | 82,350 | ||||
| Conservative hold | Swing | +11.60 | |||
References
- ↑ British parliamentary election results, 1885-1918 (Craig)
- ↑ British parliamentary election results, 1885-1918 (Craig)
- ↑ British parliamentary election results, 1885-1918 (Craig)
- ↑ British parliamentary election results, 1885-1918 (Craig)
- ↑ British parliamentary election results, 1885-1918 (Craig)
- ↑ British parliamentary election results, 1885-1918 (Craig)
- ↑ British parliamentary election results, 1885-1918 (Craig)
- ↑ British parliamentary election results, 1885-1918 (Craig)
- ↑ British parliamentary election results, 1885-1918 (Craig)
- ↑ British Parliamentary Election Results 1918-1949, FWS Craig
- ↑ British Parliamentary Election Results 1918-1949, FWS Craig
- ↑ Kimber, Richard. "UK General Election results 1955". Political Science Resources. Retrieved 22 March 2016.
- ↑
- ↑ Kimber, Richard. "UK General Election results 1959". Political Science Resources. Retrieved 22 March 2016.
- ↑
- ↑ Kimber, Richard. "UK General Election results 1964". Political Science Resources. Retrieved 22 March 2016.
- ↑
- ↑ Kimber, Richard. "UK General Election results 1966". Political Science Resources. Retrieved 22 March 2016.
- ↑
- ↑ Kimber, Richard. "UK General Election results 1970". Political Science Resources. Retrieved 22 March 2016.
- ↑
- ↑ Kimber, Richard. "UK General Election results February 1974". Political Science Resources. Retrieved 22 March 2016.
- 1 2 3 "'Essex South East', Feb 1974 - May 1983". ElectionWeb Project. Cognitive Computing Limited. Retrieved 22 March 2016.
- ↑ Kimber, Richard. "UK General Election results October 1974". Political Science Resources. Retrieved 22 March 2016.
- ↑ Kimber, Richard. "UK General Election results 1979". Political Science Resources. Retrieved 22 March 2016.