Size-exclusion chromatography
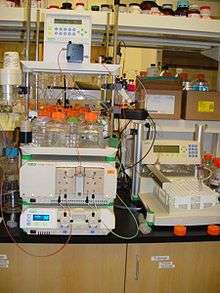 Equipment for running size-exclusion chromatography. The buffer is pumped through the column (right) by a computer-controlled device | |
| Acronym | SEC |
|---|---|
| Classification | Chromatography |
| Analytes |
macromolecules synthetic polymers biomolecules |
| Manufacturers | Knauer |
| Other techniques | |
| Related |
High performance liquid chromatography Aqueous Normal Phase Chromatography Ion exchange chromatography Micellar liquid chromatography |
Size-exclusion chromatography (SEC), also known as molecular sieve chromatography,[1] is a chromatographic method in which molecules in solution are separated by their size, and in some cases molecular weight.[2] It is usually applied to large molecules or macromolecular complexes such as proteins and industrial polymers. Typically, when an aqueous solution is used to transport the sample through the column, the technique is known as gel-filtration chromatography, versus the name gel permeation chromatography, which is used when an organic solvent is used as a mobile phase. SEC is a widely used polymer characterization method because of its ability to provide good molar mass distribution (Mw) results for polymers.
Applications
The main application of gel-filtration chromatography is the fractionation of proteins and other water-soluble polymers, while gel permeation chromatography is used to analyze the molecular weight distribution of organic-soluble polymers. Either technique should not be confused with gel electrophoresis, where an electric field is used to "pull" or "push" molecules through the gel depending on their electrical charges.
Advantages
The advantages of this method include good separation of large molecules from the small molecules with a minimal volume of eluate,[3] and that various solutions can be applied without interfering with the filtration process, all while preserving the biological activity of the particles to be separated. The technique is generally combined with others that further separate molecules by other characteristics, such as acidity, basicity, charge, and affinity for certain compounds. With size exclusion chromatography, there are short and well-defined separation times and narrow bands, which lead to good sensitivity. There is also no sample loss because solutes do not interact with the stationary phase.
The other advantage to this experimental method is that in certain cases it is feasible to determine the approximate molecular weight of a compound. The shape and size of the compound (eluent) determine how the compound interacts with the gel (stationary phase). In order to determine the approximate molecular weight, the elution volumes of compounds with their corresponding molecular weights are obtained and then a plot of “Kav” vs “log(Mw)” is made, where Kav = (Ve-Vo)/(Vt-Vo) and Mw is the molecular mass. This plot acts as a calibration curve, which is used to approximate the desired compound’s molecular weight. The Ve component represents the volume at which the intermediate molecules elute such as molecules that have partial access to the beads of the column. In addition, Vt is the sum of the total volume between the beads and the volume within the beads. The Vo component represents the volume at which the larger molecules elute, which elute in the beginning.[4][5] Disadvantages are, for example, that only a limited number of bands can be accommodated because the time scale of the chromatogram is short, and, in general, there has to be a 10% difference in molecular mass to have a good resolution[3]
Discovery
The technique was invented by Grant Henry Lathe and Colin R Ruthven, working at Queen Charlotte’s Hospital, London.[6][7] They later received the John Scott Award for this invention.[8] While Lathe and Ruthven used starch gels as the matrix, Jerker Porath and Per Flodin later introduced dextran gels;[9] other gels with size fractionation properties include agarose and polyacrylamide. A short review of these developments has appeared.[10]
There were also attempts to fractionate synthetic high polymers; however, it was not until 1964, when J. C. Moore of the Dow Chemical Company published his work on the preparation of gel permeation chromatography (GPC) columns based on cross-linked polystyrene with controlled pore size,[11] that a rapid increase of research activity in this field began. It was recognized almost immediately that with proper calibration, GPC was capable to provide molar mass and molar mass distribution information for synthetic polymers. Because the latter information was difficult to obtain by other methods, GPC came rapidly into extensive use.[12]
Theory and method
SEC is used primarily for the analysis of large molecules such as proteins or polymers. SEC works by trapping smaller molecules in the pores of the adsorbent materials adsorption ("stationary phases"). The larger molecules simply pass by the pores because those molecules are too large to enter the pores. Larger molecules therefore flow through the column more quickly than smaller molecules, that is, the smaller the molecule, the longer the retention time.
One requirement for SEC is that the analyte does not interact with the surface of the stationary phases, with differences in elution time between analytes ideally being based solely on the solute volume the analytes can enter, rather than chemical or electrostatic interactions with the stationary phases. Thus, a small molecule that can penetrate every region of the stationary phase pore system can enter a total volume equal to the sum of the entire pore volume and the interparticle volume. This small molecule will elute late (after the molecule has penetrated all of the pore- and interparticle volume—approximately 80% of the column volume). At the other extreme, a very large molecule that cannot penetrate any the smaller pores can enter only the interparticle volume (~35% of the column volume) and will elute earlier when this volume of mobile phase has passed through the column. The underlying principle of SEC is that particles of different sizes will elute (filter) through a stationary phase at different rates. This results in the separation of a solution of particles based on size. Provided that all the particles are loaded simultaneously or near-simultaneously, particles of the same size should elute together.
However, as there are various measures of the size of a macromolecule (for instance, the radius of gyration and the hydrodynamic radius), a fundamental problem in the theory of SEC has been the choice of a proper molecular size parameter by which molecules of different kinds are separated. Experimentally, Benoit and co-workers found an excellent correlation between elution volume and a dynamically based molecular size, the hydrodynamic volume, for several different chain architecture and chemical compositions.[13] The observed correlation based on the hydrodynamic volume became accepted as the basis of universal SEC calibration.
Still, the use of the hydrodynamic volume, a size based on dynamical properties, in the interpretation of SEC data is not fully understood.[14] This is because SEC is typically run under low flow rate conditions where hydrodynamic factor should have little effect on the separation. In fact, both theory and computer simulations assume a thermodynamic separation principle: the separation process is determined by the equilibrium distribution (partitioning) of solute macromolecules between two phases --- a dilute bulk solution phase located at the interstitial space and confined solution phases within the pores of column packing material. Based on this theory, it has been shown that the relevant size parameter to the partitioning of polymers in pores is the mean span dimension (mean maximal projection onto a line).[15] Although this issue has not been fully resolved, it is likely that the mean span dimension and the hydrodynamic volume are strongly correlated.
Each size exclusion column has a range of molecular weights that can be separated. The exclusion limit defines the molecular weight at the upper end of the column 'working' range and is where molecules are too large to be trapped in the stationary phase. The lower end of the range is defined by the permeation limit, which defines the molecular weight of a molecules that is small to penetrate all pores of the stationary phase. All molecules below this molecular mass are so small that they elute as a single band[3]

This is usually achieved with an apparatus called a column, which consists of a hollow tube tightly packed with extremely small porous polymer beads designed to have pores of different sizes. These pores may be depressions on the surface or channels through the bead. As the solution travels down the column some particles enter into the pores. Larger particles cannot enter into as many pores. The larger the particles, the faster the elution.
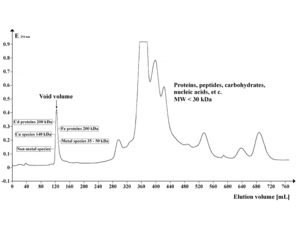
The filtered solution that is collected at the end is known as the eluate. The void volume includes any particles too large to enter the medium, and the solvent volume is known as the column volume.
Factors affecting filtration

In real-life situations, particles in solution do not have a fixed size, resulting in the probability that a particle that would otherwise be hampered by a pore passing right by it. Also, the stationary-phase particles are not ideally defined; both particles and pores may vary in size. Elution curves, therefore, resemble Gaussian distributions. The stationary phase may also interact in undesirable ways with a particle and influence retention times, though great care is taken by column manufacturers to use stationary phases that are inert and minimize this issue.
Like other forms of chromatography, increasing the column length will enhance the resolution, and increasing the column diameter increases the capacity of the column. Proper column packing is important to maximize resolution: An overpacked column can collapse the pores in the beads, resulting in a loss of resolution. An underpacked column can reduce the relative surface area of the stationary phase accessible to smaller species, resulting in those species spending less time trapped in pores. Unlike affinity chromatography techniques, a solvent head at the top of the column can drastically diminish resolution as the sample diffuses prior to loading, broadening the downstream elution.
Analysis
In simple manual columns, the eluent is collected in constant volumes, known as fractions. The more similar the particles are in size the more likely they will be in the same fraction and not detected separately. More advanced columns overcome this problem by constantly monitoring the eluent.

The collected fractions are often examined by spectroscopic techniques to determine the concentration of the particles eluted. Common spectroscopy detection techniques are refractive index (RI) and ultraviolet (UV). When eluting spectroscopically similar species (such as during biological purification), other techniques may be necessary to identify the contents of each fraction. It is also possible to analyse the eluent flow continuously with RI, LALLS, Multi-Angle Laser Light Scattering MALS, UV, and/or viscosity measurements.
The elution volume (Ve) decreases roughly linear with the logarithm of the molecular hydrodynamic volume. Columns are often calibrated using 4-5 standard samples (e.g., folded proteins of known molecular weight), and a sample containing a very large molecule such as thyroglobulin to determine the void volume. (Blue dextran is not recommended for Vo determination because it is heterogeneous and may give variable results) The elution volumes of the standards are divided by the elution volume of the thyroglobulin (Ve/Vo) and plotted against the log of the standards' molecular weights.
Applications
Biochemical applications
In general, SEC is considered a low resolution chromatography as it does not discern similar species very well, and is therefore often reserved for the final "polishing" step of a purification. The technique can determine the quaternary structure of purified proteins that have slow exchange times, since it can be carried out under native solution conditions, preserving macromolecular interactions. SEC can also assay protein tertiary structure, as it measures the hydrodynamic volume (not molecular weight), allowing folded and unfolded versions of the same protein to be distinguished. For example, the apparent hydrodynamic radius of a typical protein domain might be 14 Å and 36 Å for the folded and unfolded forms, respectively. SEC allows the separation of these two forms, as the folded form will elute much later due to its smaller size.
Polymer synthesis
SEC can be used as a measure of both the size and the polydispersity of a synthesised polymer, that is, the ability to be able to find the distribution of the sizes of polymer molecules. If standards of a known size are run previously, then a calibration curve can be created to determine the sizes of polymer molecules of interest in the solvent chosen for analysis (often THF). In alternative fashion, techniques such as light scattering and/or viscometry can be used online with SEC to yield absolute molecular weights that do not rely on calibration with standards of known molecular weight. Due to the difference in size of two polymers with identical molecular weights, the absolute determination methods are, in general, more desirable. A typical SEC system can quickly (in about half an hour) give polymer chemists information on the size and polydispersity of the sample. The preparative SEC can be used for polymer fractionation on an analytical scale.
Drawback
In SEC, mass is not measured so much as the hydrodynamic volume of the polymer molecules, that is, how much space a particular polymer molecule takes up when it is in solution. However, the approximate molecular weight can be calculated from SEC data because the exact relationship between molecular weight and hydrodynamic volume for polystyrene can be found. For this, polystyrene is used as a standard. But the relationship between hydrodynamic volume and molecular weight is not the same for all polymers, so only an approximate measurement can be obtained.[16] Another drawback is the possibility of interaction between the stationary phase and the analyte. Any interaction leads to a later elution time and thus mimics a smaller analyte size.
When performing this method, the bands of the eluting molecules may be broadened. This can occur by turbulence caused by the flow of the mobile phase molecules passing through the molecules of the stationary phase. In addition, molecular thermal diffusion and friction between the molecules of the glass walls and the molecules of the eluent contribute to the broadening of the bands. Besides broadening, the bands also overlap with each other. As a result, the eluent usually gets considerably diluted. A few precautions can be taken to prevent the likelihood of the bands broadening. For instance, one can apply the sample in a narrow, highly concentrated band on the top of the column. The more concentrated the eluent is, the more efficient the procedure would be. However, it is not always possible to concentrate the eluent, which can be considered as one more disadvantage.[17]
Absolute size-exclusion chromatography
Absolute size-exclusion chromatography (ASEC) is a technique that couples a dynamic light scattering (DLS) instrument to a size exclusion chromatography system for absolute size measurements of proteins and macromolecules as they elute from the chromatography system.
The definition of absolute used here is that it does not require calibration to obtain hydrodynamic size, often referred to as hydrodynamic diameter (DH in units of nm). The sizes of the macromolecules are measured as they elute into the flow cell of the DLS instrument from the size exclusion column set. It should be noted that the hydrodynamic size of the molecules or particles are measured and not their molecular weights. For proteins a Mark-Houwink type of calculation can be used to estimate the molecular weight from the hydrodynamic size.
A big advantage of DLS coupled with SEC is the ability to obtain enhanced DLS resolution . Batch DLS is quick and simple and provides a direct measure of the average size but the baseline resolution of DLS is 3 to 1 in diameter. Using SEC, the proteins and protein oligomers are separated, allowing oligomeric resolution. Aggregation studies can also be done using ASEC although the aggregate concentration may not be calculated, the size of the aggregate will be measured only to be limited by the maximum size eluting from the SEC columns.
Limitations of ASEC include flow-rate, concentration, and precision. Because a correlation function requires anywhere from 3–7 seconds to properly build, a limited number of data points can be collected across the peak.
See also
References
- ↑ Garrett, Reginald H.; Grisham, Charles M. (2013). Biochemistry (5th ed.). Belmont, CA: Brooks/Cole, Cengage Learning. p. 108. ISBN 9781133106296.
- ↑ Paul-Dauphin, Stephanie; Morgan, Millan-Agorio; Herod, Kandiyoti (6 October 2007). "Probing Size Exclusion Mechanisms of Complex Hydrocarbon Mixtures: The Effect of Altering Eluent Compositions". Energy & Fuels. 6. 21 (6): 3484–3489. doi:10.1021/ef700410e. Retrieved October 6, 2007.
- 1 2 3 Skoog, D. A.; Principles of Instrumental Analysis, 6th ed.; Thompson Brooks/Cole: Belmont, CA, 2006, Chapter 28.
- ↑ Rouessac, Annick; Rouessac, Francis (2000). Chemical analysis : modern instrumental methods and techniques (Engl. ed.). Chichester [u.a.]: Wiley. pp. 101–103. ISBN 0471972614.
- ↑ Ballou, David P.; Benore, Marilee; Ninfa, Alexander J. (2008). Fundamental laboratory approaches for biochemistry and biotechnology. (2nd ed.). Hoboken, N.J.: Wiley. p. 129. ISBN 9780470087664.
- ↑ Lathe, GH and Ruthven, CR (1955) The separation of substances on the basis of their molecular weights, using columns of starch and water. Biochem J. 60(4):xxxiv.
- ↑ Lathe, GH and Ruthven, CR (1956) The separation of substances and estimation of their relative molecular sizes by the use of columns of starch in water. Biochem. J. 62(4): 665-674. article
- ↑ John Scott Award
- ↑ Porath, J and Flodin, P (1959) Gel filtration: A method for desalting and group separation. Nature 183(4676): 1657-1659.
- ↑ Eisenstein, M (2006) A look back, adventures in the matrix. Nature Methods 3(5): 410 article
- ↑ Moore, J. C. (1964) Gel Permeation Chromatography. 1. A New Method for Molecular Weight Distribution of High Polymers. Journal of Polymer Science: Part A 2: 835-843
- ↑ Striegel, A. M.; Kirkland, J. J.; Yau, W. W.; Bly, D. D.; Modern Size Exclusion Chromatography, Practice of Gel Permeation and Gel Filtration Chromatography, 2nd ed.; Wiley: NY, 2009.
- ↑ Grubisic, Z.; Rempp, P.; Benoit, H. (1967) A universal calibration for Gel Permeation Chromatography. Journal of Polymer Science: Polym. Lett. 5: 753-759
- ↑ Sun, T.; Chance, R. R.; Graessley, W. W.; and Lohse, D. J. (2004) A study of the separation principle in Size Exclusion Chromatography. Macromolecules 37: 4304-4312.
- ↑ Wang, Y.; Teraoka, I.; Hansen, F. Y.; Peters, G. H.; and Hassager, O. (2010) A theoretical study of the separation principle in Size Exclusion Chromatography. Macromolecule 43: 1651-1659.
- ↑ Polymer Science Learning Center (PSLC) - Size Exclusion Chromatography
- ↑ Ballou, David P.; Benore, Marilee; Ninfa, Alexander J. (2008). Fundamental laboratory approaches for biochemistry and biotechnology. (2nd ed.). Hoboken, N.J.: Wiley. p. 127. ISBN 9780470087664.
External links
| Library resources about Gel permeation chromatography |