Sissach District
| Sissach District Bezirk Sissach | |
|---|---|
| District | |
 | |
| Country |
|
| Canton |
|
| Capital | Sissach |
| Area | |
| • Total | 138.29 km2 (53.39 sq mi) |
| Population (2016) | |
| • Total | 35,529 |
| • Density | 260/km2 (670/sq mi) |
| Time zone | CET (UTC+1) |
| • Summer (DST) | CEST (UTC+2) |
| Municipalities | 29 |
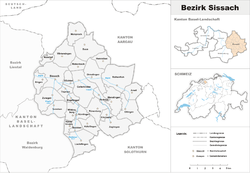
Sissach District is one of the five districts of the largely German-speaking canton of Basel-Country in Switzerland. It has a population of 35,529 (as of 31 March 2016). The district occupies the western portion of Basel-Country, bordering the neighbouring cantons of canton of Aargau and Solothurn. Its capital is the town of Sissach.
Geography
Sissach district has an area, as of 2009, of 141 square kilometers (54 sq mi). Of this area, 69.56 km2 (26.86 sq mi) or 49.3% is used for agricultural purposes, while 55.98 km2 (21.61 sq mi) or 39.7% is forested. Of the rest of the land, 15.06 km2 (5.81 sq mi) or 10.7% is settled (buildings or roads), 0.25 km2 (0.097 sq mi) or 0.2% is either rivers or lakes and 0.13 km2 (32 acres) or 0.1% is unproductive land.[1]
Of the built up area, housing and buildings made up 5.6% and transportation infrastructure made up 3.4%. Out of the forested land, 38.0% of the total land area is heavily forested and 1.7% is covered with orchards or small clusters of trees. Of the agricultural land, 19.7% is used for growing crops and 23.8% is pastures, while 5.8% is used for orchards or vine crops. All the water in the municipality is flowing water.[1]
Municipalities
Sissach contains a total of twenty-nine municipalities:
| Municipality | Population (31 March 2016)[2] |
Area, km² |
|---|---|---|
| Anwil | 588 | 3.96 |
| Böckten | 810 | 2.28 |
| Buckten | 705 | 1.99 |
| Buus | 1,022 | 8.85 |
| Diepflingen | 724 | 1.44 |
| Gelterkinden | 6,017 | 9.79 |
| Häfelfingen | 258 | 3.96 |
| Hemmiken | 274 | 3.39 |
| Itingen | 2,067 | 3.14 |
| Känerkinden | 526 | 1.48 |
| Kilchberg | 157 | 1.59 |
| Läufelfingen | 1,313 | 8.15 |
| Maisprach | 952 | 5.06 |
| Nusshof | 259 | 1.72 |
| Oltingen | 489 | 7.18 |
| Ormalingen | 2,129 | 4.23 |
| Rickenbach | 593 | 2.90 |
| Rothenfluh | 776 | 10.93 |
| Rümlingen | 386 | 2.28 |
| Rünenberg | 784 | 4.98 |
| Sissach | 6,741 | 8.87 |
| Tecknau | 862 | 2.35 |
| Tenniken | 909 | 4.67 |
| Thürnen | 1,409 | 2.25 |
| Wenslingen | 737 | 5.91 |
| Wintersingen | 618 | 6.95 |
| Wittinsburg | 433 | 3.21 |
| Zeglingen | 487 | 7.91 |
| Zunzgen | 2,504 | 6.87 |
| Total | 35,529 | 138.29 |
Demographics
Sissach district has a population (as of March 2016) of 35,529.[2] As of 2008, 12.9% of the population are resident foreign nationals.[3]
Most of the population (as of 2000) speaks German (28,263 or 91.1%), with Italian language being second most common (730 or 2.4%) and Albanian being third (396 or 1.3%). There are 210 people who speak French and 18 people who speak Romansh.[4]
As of 2008, the gender distribution of the population was 49.7% male and 50.3% female. The population was made up of 28,998 Swiss citizens (86.4% of the population), and 4,582 non-Swiss residents (13.6%)[5] Of the population in the district 9,510 or about 30.6% were born in the district and lived there in 2000. There were 8,730 or 28.1% who were born in the same canton, while 7,721 or 24.9% were born somewhere else in Switzerland, and 4,367 or 14.1% were born outside of Switzerland.[4]
In 2008 there were 249 live births to Swiss citizens and 47 births to non-Swiss citizens, and in same time span there were 227 deaths of Swiss citizens and 10 non-Swiss citizen deaths. Ignoring immigration and emigration, the population of Swiss citizens increased by 22 while the foreign population increased by 37. There were 2 Swiss men and 5 Swiss women who emigrated from Switzerland. At the same time, there were 103 non-Swiss men and 86 non-Swiss women who immigrated from another country to Switzerland. The total Swiss population change in 2008 (from all sources, including moves across municipal borders) was an increase of 337 and the non-Swiss population change was an increase of 141 people. This represents a population growth rate of 1.5%.[3]
The age distribution, as of 2010, in the district is; 2,215 children or 6.6% of the population are between 0 and 6 years old and 4,948 teenagers or 14.7% are between 7 and 19. Of the adult population, 4,102 people or 12.2% of the population are between 20 and 29 years old. 4,220 people or 12.6% are between 30 and 39, 5,700 people or 17.0% are between 40 and 49, and 7,013 people or 20.9% are between 50 and 64. The senior population distribution is 3,927 people or 11.7% of the population are between 65 and 79 years old and there are 1,455 people or 4.3% who are over 80.[5]
As of 2000, there were 12,547 people who were single and never married in the municipality. There were 15,484 married individuals, 1,672 widows or widowers and 1,326 individuals who are divorced.[4]
There were 3,400 households that consist of only one person and 923 households with five or more people. Out of a total of 12,581 households that answered this question, 27.0% were households made up of just one person and 99 were adults who lived with their parents. Of the rest of the households, there are 3,885 married couples without children, 4,236 married couples with children There were 594 single parents with a child or children. There were 182 households that were made up unrelated people and 185 households that were made some sort of institution or another collective housing.[4]
As of 2000 the average price to rent a two room apartment was about 786.00 CHF (US$630, £350, €500), a three room apartment was about 983.00 CHF (US$790, £440, €630) and a four room apartment cost an average of 1240.00 CHF (US$990, £560, €790).[6]
The historical population is given in the following chart:[7]

Politics
In the 2007 federal election the most popular party was the SVP which received 33.96% of the vote. The next three most popular parties were the SP (22.4%), the Green Party (18.02%) and the FDP (15.94%). In the federal election, a total of 11,808 votes were cast, and the voter turnout was 51.0%.[8]
Religion
From the 2000 census, 5,874 or 18.9% were Roman Catholic, while 18,685 or 60.2% belonged to the Swiss Reformed Church. Of the rest of the population, there were 202 members of an Orthodox church (or about 0.65% of the population), there were 97 individuals (or about 0.31% of the population) who belonged to the Christian Catholic Church, and there were 756 individuals (or about 2.44% of the population) who belonged to another Christian church. There were 10 individuals (or about 0.03% of the population) who were Jewish, and 1,375 (or about 4.43% of the population) who were Islamic. There were 43 individuals who were Buddhist, 46 individuals who were Hindu and 21 individuals who belonged to another church. 3,299 (or about 10.63% of the population) belonged to no church, are agnostic or atheist, and 621 individuals (or about 2.00% of the population) did not answer the question.[4]
Education
In the district about 12,790 or (41.2%) of the population have completed non-mandatory upper secondary education, and 3,676 or (11.8%) have completed additional higher education (either University or a Fachhochschule). Of the 3,676 who completed tertiary schooling, 67.4% were Swiss men, 21.9% were Swiss women, 6.7% were non-Swiss men and 4.1% were non-Swiss women.[4]
References
- 1 2 Swiss Federal Statistical Office-Land Use Statistics 2009 data (German) accessed 25 March 2010
- 1 2 Canton of Basel-Land Statistics, Wohnbevölkerung nach Nationalität und Konfession per 31. März 2016 (German) accessed 30 August 201
- 1 2 Swiss Federal Statistical Office - Superweb database - Gemeinde Statistics 1981-2008 (German) accessed 19 June 2010
- 1 2 3 4 5 6 STAT-TAB Datenwürfel für Thema 40.3 - 2000 (German) accessed 2 February 2011
- 1 2 Canton of Basel-Land Statistics, Wohnbevölkerung nach Nationalität und Konfession per 30. September 2010 (German) accessed 16 February 2011
- ↑ Canton of Basel-Land Statistics, Mieter- und Genossenschafterwohnungen1 nach Zimmerzahl und Mietpreis 2000 (German) accessed 20 February 2011
- ↑ Swiss Federal Statistical Office STAT-TAB Bevölkerungsentwicklung nach Region, 1850-2000 (German) accessed 29 January 2011
- ↑ Swiss Federal Statistical Office, Nationalratswahlen 2007: Stärke der Parteien und Wahlbeteiligung, nach Gemeinden/Bezirk/Canton (German) accessed 28 May 2010
Coordinates: 46°4′N 7°3′E / 46.067°N 7.050°E