Significance analysis of microarrays

Significance analysis of microarrays (SAM) is a statistical technique, established in 2001 by Virginia Tusher, Robert Tibshirani and Gilbert Chu, for determining whether changes in gene expression are statistically significant. With the advent of DNA microarrays, it is now possible to measure the expression of thousands of genes in a single hybridization experiment. The data generated is considerable, and a method for sorting out what is significant and what isn't is essential. SAM is distributed by Stanford University in an R-package.
SAM identifies statistically significant genes by carrying out gene specific t-tests and computes a statistic dj for each gene j, which measures the strength of the relationship between gene expression and a response variable.[1][2][3] This analysis uses non-parametric statistics, since the data may not follow a normal distribution. The response variable describes and groups the data based on experimental conditions. In this method, repeated permutations of the data are used to determine if the expression of any gene is significant related to the response. The use of permutation-based analysis accounts for correlations in genes and avoids parametric assumptions about the distribution of individual genes. This is an advantage over other techniques (e.g., ANOVA and Bonferroni), which assume equal variance and/or independence of genes.[4]
Basic protocol
- Perform microarray experiments — DNA microarray with oligo and cDNA primers, SNP arrays, protein arrays, etc.
- Input Expression Analysis in Microsoft Excel — see below
- Run SAM as a Microsoft Excel Add-Ins
- Adjust the Delta tuning parameter to get a significant # of genes along with an acceptable false discovery rate (FDR)) and Assess Sample Size by calculating the mean difference in expression in the SAM Plot Controller
- List Differentially Expressed Genes (Positively and Negatively Expressed Genes)
Running SAM
- SAM is available for download online at http://www-stat.stanford.edu/~tibs/SAM/ for academic and non-academic users after completion of a registration step.
- SAM is run as an Excel Add-In, and the SAM Plot Controller allows Customization of the False Discovery Rate and Delta, while the SAM Plot and SAM Output functionality generate a List of Significant Genes, Delta Table, and Assessment of Sample Sizes
- Permutations are calculated based on the number of samples
- Block Permutations
the number of permutations is set by the user when imputing correct values for the data set to run SAM
Response formats[1]
Types
- Quantitative — real-valued (such as heart rate)
- One class — tests whether the mean gene expression differs from zero
- Two class — two sets of measurements
- Unpaired — measurement units are different in the two groups; e.g. control and treatment groups with samples from different patients
- Paired — same experimental units are measured in the two groups; e.g. samples before and after treatment from the same patients
- Multiclass — more than two groups with each containing different experimental units; generalization of two class unpaired type
- Survival — data of a time until an event (for example death or relapse)
- Time course — each experimental units is measured at more than one time point; experimental units fall into a one or two class design
- Pattern discovery — no explicit response parameter is specified; the user specifies eigengene (principal component) of the expression data and treats it as a quantitative response
Algorithm
SAM calculates a test statistic for relative difference in gene expression based on permutation analysis of expression data and calculates a false discovery rate. The principal calculations of the program are illustrated below.[1][2][3]
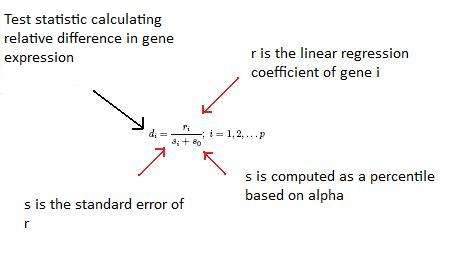
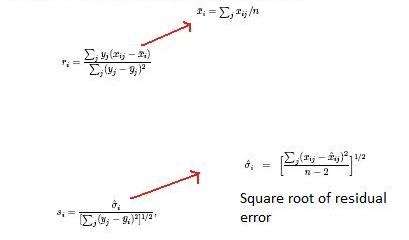
The so constant is chosen to minimize the coefficient of variation of di. ri is equal to the expression levels (x) for gene i under y experimental conditions.

Fold changes (t) are specified to guarantee genes called significant change at least a pre-specified amount. This means that the absolute value of the average expression levels of a gene under each of two conditions must be greater than the fold change (t) to be called positive and less than the inverse of the fold change (t) to be called negative.
The SAM algorithm can be stated as:
- Order test statistics according to magnitude [2][3]
- For each permutation compute the ordered null (unaffected) scores [2][3]
- Plot the ordered test statistic against the expected null scores [2][3]
- Call each gene significant if the absolute value of the test statistic for that gene minus the mean test statistic for that gene is greater than a stated threshold [3]
- Estimate the false discovery rate based on expected versus observed values [2][3]
Output
- Significant gene sets
- Positive gene set — higher expression of most genes in the gene set correlates with higher values of the phenotype y
- Negative gene set — lower expression of most genes in the gene set correlates with higher values of the phenotype y
SAM features
- Data from Oligo or cDNA arrays, SNP array, protein arrays,etc. can be utilized in SAM[2][3]
- Correlates expression data to clinical parameters[4]
- Correlates expression data with time[1]
- Uses data permutation to estimates False Discovery Rate for multiple testing[2][3][4][7]
- Reports local false discovery rate (the FDR for genes having a similar di as that gene)[1] and miss rates [1][2]
- Can work with blocked design for when treatments are applied within different batches of arrays[1]
- Can adjust threshold determining number of gene called significant[1]
References
- 1 2 3 4 5 6 7 8 9 Chu, G., Narasimhan, B, Tibshirani, R, Tusher, V. "SAM "Significance Analysis of Microarrays" Users Guide and technical document."
- 1 2 3 4 5 6 7 8 9 Zang, S., R. Guo, et al. (2007). "Integration of statistical inference methods and a novel control measure to improve sensitivity and specificity of data analysis in expression profiling studies." Journal of Biomedical Informatics 40(5): 552–560
- 1 2 3 4 5 6 7 8 9 Zhang, S. (2007). "A comprehensive evaluation of SAM, the SAM R-package and a simple modification to improve its performance." BMC Bioinformatics 8: 230.
- 1 2 3 Tusher, V. G., R. Tibshirani, et al. (2001). "Significance analysis of microarrays applied to the ionizing radiation response." Proceedings of the National Academy of Sciences 98(9): 5116–5121.
- ↑ Dinu, I. P., JD; Mueller, T; Liu, Q; Adewale, AJ; Jhangri, GS; Einecke, G; Famulski, KS; Halloran, P; Yasui, Y. (2007). "Improving gene set analysis of microarray data by SAM-GS." BMC Bioinformatics 8: 242.
- ↑ Jeffery, I. H., DG; Culhane, AC. (2006). "Comparison and evaluation of methods for generating differentially expressed gene lists from microarray data." BMC Bioinformatics 7: 359.
- ↑ Larsson, O. W., C; Timmons, JA. (2005). "Considerations when using the significance analysis of microarrays (SAM) algorithm." BMC Bioinformatics 6: 129.
- Kooperberg, C., S. Sipione, et al. (2002). "Evaluating test statistics to select interesting genes in microarray experiments." Hum. Mol. Genet. 11(19): 2223–2232.