Scanning ion-conductance microscopy

Scanning ion-conductance microscopy (SICM) is a scanning probe microscopy technique that uses an electrode as the probe tip.[1] SICM allows for the determination of the surface topography of micrometer and even nanometer-range [2] structures in aqueous media conducting electrolytes. The samples can be hard or soft, are generally non-conducting, and the non-destructive nature of the measurement allows for the observation of living tissues and cells, and biological samples in general.
It is able to detect steep profile changes in samples [3] and can be used to map a living cell's stiffness [4] in tandem with its detailed topography, or to determine the mobility of cells during their migrations. [5]
Working principle
Scanning ion conductance microscopy is a technique using the increase of access resistance in a micro-pipette in an electrolyte-containing aqueous medium when it approaches a poorly conducting surface. It monitors the ionic current flowing in and out of the micro/nano-pipette, which is hindered if the tip is very close to the sample surface since the gap through which ions can flow is reduced in size.
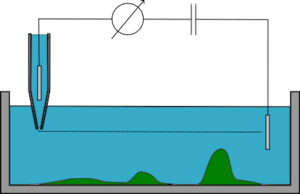
The SICM setup is generally as follows: A voltage is applied between the two Ag/AgCl electrodes, one of which is in the glass micro-pipette, and the other in the bulk solution. The voltage will generate an ionic current between the two electrodes, flowing in and out of the micro-pipette. The conductance between the two electrodes is measured, and depends on the flux of ions.
Movements of the pipette are regulated through piezoelectrics.
The micro-pipette is lowered closer and closer to the sample until the ionic flux starts to be restricted. The conductance of the system will then decrease (and the resistance will increase). When this resistance reaches a certain threshold the tip is stopped and the position recorded. The tip is then moved (in different ways depending on the mode used, see below) and another measurement is made in a different location, and so on. In the end, comparing the positions of all the measurements provides a detailed height profile of the sample.
It is important to note that the tip is stopped before contacting the sample, thus it does not bend nor damage the surface observed, which is one of the major advantage of the SICM.
Equivalent circuit

The total resistance of the setup (Rtot) is the sum of the three resistances: Rb, Rm, and Rt. Rb the resistance of the electrolyte solution between the tip of the micro-pipette and the electrode in the bulk of the solution. Rm is the resistance of the electrolyte solution between the electrode in the micro-pipette and the tip. Rt is the resistance of the current flowing through the tip
Rb and Rm depend on the electrolyte conductivity, and the position and shape of the Ag/AgCl electrodes. Rt depends on the size and shape of the aperture, and on the distance between the tip and the sample.
All the parameters except the distance between tip and sample are constant within a given SICM setup, thus it is the variation of Rt with the distance to the sample that will be used to determine the topography of the sample.
Usual approximations are: 1) the voltage drop at the surfaces of the Ag/AgCl electrodes is neglected, it is assumed that it is negligible compared to the voltage drop at the tip, and constant, 2) the fact that the bulk resistance is a function of d is neglected since it depends on the distance between the tip and the electrode in the bulk.
Comparison with other scanning probe microscopy techniques
SICM has a worse resolution than AFM or STM, which can routinely reach resolutions of about 0.1 nm. The resolution of SICM measurement is limited to 1.5 times the diameter of the tip opening[7] in theory, but measurements taken with a 13 nm opening-diameter managed a resolution of around 3-6 nm.[8]
SICM can be used to image poorly or non-conducting surfaces,[6] which is impossible with STM.
In SICM measurements, the tip of the micro-pipette does not touch the surface of the sample; which allows the imaging of soft samples (cells, biological samples, cell villi)[9] · [10] · [11] without deformation.
SICM is used in an electrolyte-containing solution, so can be used in physiological media and image living cells and tissues, and monitor biological processes while they are taking place.[11]
In hopping mode, it is able to correctly determine profiles with steep slopes and grooves.
Imaging modes
There are four main imaging modes in SICM: constant-z mode, Direct current (constant distance) mode, alternating current mode, and hopping/backstep/standing approach mode.
Constant-z mode
In constant-z mode, the micro-pipette is maintained at a constant z (height) while it is moved laterally and the resistance is monitored, its variations allowing for the reconstitution of the topography of the sample. This mode is fast but is barely used since it only works on very flat samples. If the sample has rugged surfaces, the pipette will either crash into it, or be too far for imaging most of the sample.
Direct current mode

In direct current (DC) mode (constant distance mode), the micro-pipette is lowered toward the sample until a predefined resistance is reached. The pipette is then moved laterally and a feedback loop maintains the distance to the sample (through the resistance value). The z-position of the pipette determines the topography of the sample. This mode does not detect steep slopes in sample, may contact the sample in such cases and is prone to electrode drift.
Alternating current mode

In alternating current (AC) mode, the micro-pipette oscillates vertically in addition to its usual movement. While the pipette is still far from the surface the ionic current, and the resistance is steady, so the pipette is lowered. Once the resistance starts oscillating, the amplitude serves as feedback to modulate the position until a predefined amplitude is reached[9][10]
The response of the AC component increases much steeper than the DC, and allows for the recording of more complex samples.
Hopping mode

In hopping (/backstep/standing approach) mode, the micro-pipette is lowered to the sample until a given resistance is reached, and the height is recorded. Then the pipette is dragged back, laterally moved and another measurement is made, and the process repeats. The topography of the sample can then be reconstituted.
Hopping mode is slower than the others, but is able to image complex topography and even entire cells, without distorting the sample surface[12] · .[13]
Combinations with other techniques, and alternative uses
SICM was used to image a living neural cell from rat brain,[5] determine the life cycle of microvilli,[9] observe the movement of protein complexes in spermatozoa.[2]
SICM has been combined with fluorescence microscopy[2] and förster resonance energy transfer.[14]
SICM has been used in a "smart patch-clamp" technique, clamping the pipette by suction to the surface of a cell and then monitoring the activity of the sodium channels in the cell membrane.[15]
A combination of AFM and SICM was able to obtain high resolution images of synthetic membranes in ionic solutions.[16]
Scanning near-field optical microscopy has been used with SICM; the SICM measurement allowed for the tip of the pipette to be placed very close to the surface of the sample. Fluorescent particles, coming from the inside of the micro-pipette, provide a light source for the SNOM that is being continuously renewed and prevent photobleaching.[17] · [18]
FSICM[19] (Fast SICM), improving notably the speed of hopping mode has recently been developed.
References
- ↑ P.K. Hansma, B. Drake, O. Marti, S.A. Gould and C.B. Prater, Science 243, 641 (1989)
- 1 2 3 Shevchuk, A.I.; Frolenkov, G.I.; Sánchez, D.; James, P.S.; Freedman, N.; Lab, M.J.; Jones, R.; Klenerman, D.; Korchev, Y.E. Imaging proteins in membranes of living cells by high-resolution scanning ion conductance microscopy. Angew. Chem. Int. Ed. Engl. 2006, 45, 2212–2216.
- ↑ Rheinlaender, J.; Geisse, N.A.; Proksch, R.; Schäffer, T.E. Comparison of scanning ion conductance microscopy with atomic force microscopy for cell imaging. Langmuir 2011, 27, 697–704.
- ↑ Clarke RW, Novak P, Zhukov A, Tyler EJ, Cano-Jaimez M, Drews A, Richards O, Volynski K, Bishop C, Klenerman D (2016). "Low Stress Ion Conductance Microscopy of Sub-Cellular Stiffness". Soft Matter. doi:10.1039/c6sm01106c.
- 1 2 Happel, P.; Wehner, F.; Dietzel, I.D. Scanning ion conductance microscopy–a tool to investigate electrolyte-nonconductor interfaces. In Modern Research and Educational Topics in Microscopy; FORMATEX: Badajoz, Spain, 2007; pp. 968–975.
- 1 2 Chen, C. C., Zhou, Y., & Baker, L. A. (2012). Scanning ion conductance microscopy. Annual Review of Analytical Chemistry, 5, 207-228.
- ↑ Rheinlaender, J.; Schäffer, T.E. Image formation, resolution, and height measurement in scanning ion conductance microscopy. J. Appl. Phys. 2009, 105, 094905.
- ↑ Shevchuk, A.I.; Frolenkov, G.I.; Sánchez, D.; James, P.S.; Freedman, N.; Lab, M.J.; Jones, R.; Klenerman, D.; Korchev, Y.E. Imaging proteins in membranes of living cells by high-resolution scanning ion conductance microscopy. Angew. Chem. Int. Ed. Engl. 2006, 45, 2212–2216.
- 1 2 3 Gorelik, J.; Shevchuk, A.I.; Frolenkov, G.I.; Diakonov, I.A.; Lab, M.J.; Kros, C.J.; Richardson, G.P.; Vodyanoy, I.; Edwards, C.R.W.; Klenerman, D.; et al. Dynamic assembly of surface structures in living cells. Proc. Natl. Acad. Sci. USA 2003, 100, 5819–5822.
- 1 2 Gorelik, J.; Zhang, Y.; Shevchuk, A.I.; Frolenkov, G.I.; Sánchez, D.; Lab, M.J.; Vodyanoy, I.; Edwards, C.R.W.; Klenerman, D.; Korchev, Y.E. The use of scanning ion conductance microscopy to image A6 cells. Mol. Cell Endocrinol. 2004, 217, 101–108.
- 1 2 Zhang, Y.; Gorelik, J.; Sanchez, D.; Shevchuk, A.; Lab, M.; Vodyanoy, I.; Klenerman, D.; Edwards, C.; Korchev, Y. Scanning ion conductance microscopy reveals how a functional renal epithelial monolayer maintains its integrity. Kidney Int. 2005, 68, 1071–1077.
- ↑ Mann, S.A.; Hoffmann, G.; Hengstenberg, A.; Schuhmann, W.; Dietzel, I.D. Pulse-mode scanning ion conductance microscopy—A method to investigate cultured hippocampal cells. J. Neurosci. Methods 2002, 116, 113–117.
- ↑ Novak, P.; Li, C.; Shevchuk, A.I.; Stepanyan, R.; Caldwell, M.; Hughes, S.; Smart, T.G.; Gorelik, J.; Ostanin, V.P.; Lab, M.J.; et al. Nanoscale live-cell imaging using hopping probe ion conductance microscopy. Nat. Methods 2009, 6, 279–281.
- ↑ Nikolaev, V.O.; Moshkov, A.; Lyon, A.R.; Miragoli, M.; Novak, P.; Paur, H.; Lohse, M.J.; Korchev, Y.E.; Harding, S.E.; Gorelik, J. Beta2-adrenergic receptor redistribution in heart failure changes cAMP compartmentation. Science 2010, 327, 1653–1657.
- ↑ Duclohier, H. Neuronal sodium channels in ventricular heart cells are localized near T-tubules openings. Biochem. Biophys. Res. Commun. 2005, 334, 1135–1140.
- ↑ R. Proksch, R. Lal, P.K. Hansma, D. Morse and G. Stucky, Biophysical Journal 71, 2155 (1996)
- ↑ A. Bruckbauer, L. Ying, A.M. Rothery, Y.E. Korchev and D. Klenerman, Analytical Chemistry 74, 2612 (2002)
- ↑ A.M. Rothery, J. Gorelik, A. Bruckbauer, W.Yu, Y.E. Korchev and D. Klenermann, Journal of Microscopy 209, 94
- ↑ Zhukov, A.; Richards, O.; Ostanin, V.; Korchev, Y.; Klenerman, D. A hybrid scanning mode for fast scanning ion conductance microscopy (SICM) imaging. Ultramicroscopy 2012, 121C, 1–7.
