Salisbury Township School District
| Salisbury Township School District | |
|---|---|
 | |
| Address | |
|
1140 Salisbury Road Allentown, Pennsylvania, Lehigh County 18103 United States | |
| Information | |
| Type | Public |
| School board | 9 locally elected members serve 4 year terms |
| Superintendent | Mr Michael Q Roth, contract November 2012 through June 30, 2017[1] starting salary $135,000 |
| Administrator |
Dr Randy M Ziegenfuss, Asst Superintendent $92,365 92012) |
| Principal | Barbara Samide, HTES $108,090 (2012) |
| Principal | Grace Hartman, WSES $96,568 (2012) |
| Principal | Robert Cassidy, SMS salary $108,090 (2012) |
| Principal | Heather Morningstar, SHS $95,369 (2012) |
| Staff | 142 non teaching staff members |
| Faculty | 114 teachers 2 010[2] |
| Grades | K-12 (adding preK 2014) |
| Age | 5 years old to 21 years old special education |
| Enrollment | 1,592 pupils (2012-13),[3] 1,608 pupils (2009-10) [4] 1,807 pupils (2006-07) [5] |
| • Kindergarten | 90 (2012) 104 (2010) |
| • Grade 1 | 103 (2012) 99 (2010) |
| • Grade 2 | 102 (2012) 100 (2010) |
| • Grade 3 | 109 (2012) 117 (2010) |
| • Grade 4 | 118 (2012) 113 (2010) |
| • Grade 5 | 119 (2012) 114 (2010) |
| • Grade 6 | 110 (2012) 128 (2010) |
| • Grade 7 | 133 (2012) 132 (2010) |
| • Grade 8 | 129 (2012) 144 (2010) |
| • Grade 9 | 158 (2012) 140 (2010) |
| • Grade 10 | 144 (2012) 150 (2010) |
| • Grade 11 | 133 (2012) 137 (2010) |
| • Grade 12 | 142 (2012) 123 (2010) |
| • Other | Enrollment projected to continue to decline to 1,540 pupils in 2020[6] |
| Budget |
$31,548,872 (2013-14)[7] |
| per pupil spending | $14,753 (2008) ranked 68th in PA |
| per pupil spending | $17,507.21 (2010) 49th in PA |
| Website | http://www.stsd.org/ |
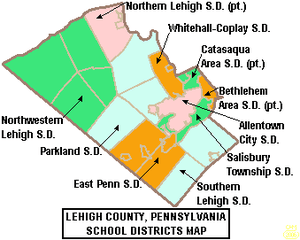
Salisbury Township School District is a small, suburban, public school district located in Lehigh County, Pennsylvania, in the United States. It serves Salisbury Township. The District is one of the 500 public school districts of Pennsylvania. The district encompasses approximately 11 square miles (28 km2). According to 2000 federal census data, it serves a resident population of 13,498. By 2010, The US Census Bureau reported that Salisbury Township School District's resident population was 13,505 people.[10] In 2009, the district residents’ per capita income was $28,073, while the median family income was $62,534.[11] In the Commonwealth, the median family income was $49,501[12] and the United States median family income was $49,445, in 2010.[13] By 2013, the median household income in the United States rose to $52,100.[14] The educational attainment levels for the Salisbury Township School District population (25 years old and over) were 91.0% high school graduates and 28.9% college graduates.[15]
According to District officials, in 2010, the District provided basic educational services to 1,660 pupils. It employed: 153 teachers, 110 full-time and part-time support personnel, and 18 administrators. The District received $5 million in state funding in the 2009-10 school year. In school year 2007-08, Salisbury Township School District provided basic educational services to 1,743 pupils. It employed: 147 teachers, 124 full-time and part-time support personnel, and 14 administrators. STSD received more than $4.8 million in state funding in school year 2007-08.
Salisbury High School students may choose to attend Lehigh Career & Technical Institute for training in the trades. The Carbon-Lehigh Intermediate Unit IU21 provides the District with a wide variety of services like specialized education for disabled students and hearing, speech and visual disability services and professional development for staff and faculty.
Governance
The Salisbury Township School District is governed by 9 individually elected board members (serve without compensation for a term of four years), the Pennsylvania State Board of Education, the Pennsylvania Department of Education and the Pennsylvania General Assembly.[16] The federal government controls programs it funds like: Title I funding for low income children in the Elementary and Secondary Education Act and the federal No Child Left Behind Act, which mandates the District focus resources on student success in acquiring reading and math skills. The Superintendent and Business Manager are appointed by the school board. The Superintendent is the chief administrative officer with overall responsibility for all aspects of operations, including education and finance. The Business Manager is responsible for budget and financial operations. Neither of these officials are voting members of the School Board. The School Board enters into individual employment contracts for these positions. In Pennsylvania, public school districts are required to give 150 days notice to the Superintendent regarding renewal of the employment contract.
Schools
- Salisbury High School
- Salisbury Middle School
- Harry S Truman Elementary School
- Western Salisbury Elementary School
The Salisbury Township School Board also oversees the Arts Academy Charter School. (grades 5-8)
Academic achievement
Salisbury Township School District was ranked 89th out of 498 Pennsylvania school districts by the Pittsburgh Business Times in 2013.[17] The ranking was based on student academic achievement as demonstrated on the last three years of the PSSAs for: reading, writing, math and science.[18] The PSSAs are given to all children in grades 3rd through 8th and the 11th grade in high school. Adapted examinations are given to children in the special education programs. Writing exams were given to children in 5th, 8th and 11th grades.
- Overachiever statewide ranking
In 2013, the Pittsburgh Business Times also reported an Overachievers Ranking for 498 Pennsylvania school districts. Salisbury Township School District ranked 269th. In 2012, the District was ranked 353rd. [21] The editor describes the ranking as: "a ranking answers the question - which school districts do better than expectations based upon economics? This rank takes the Honor Roll rank and adds the percentage of students in the district eligible for free and reduced-price lunch into the formula. A district finishing high on this rank is smashing expectations, and any district above the median point is exceeding expectations."[22]
District AYP
In 2011 and 2012, Salisbury Township School District achieved Adequate Yearly Progress (AYP) status.[23] From 2003 through 2010, Salisbury Township School District achieved AYP each school year.[24]
Graduation rate
In 2013, the Salisbury Township School District’s graduation rate was 96%.[25] In 2012, the District’s graduation rate was 93.94%.[26] In 2011, the graduation rate was 92.86%.[27] In 2010, the Pennsylvania Department of Education issued a new, 4-year cohort graduation rate. Salisbury High School's rate was 92.35% for 2010.[28]
- According to traditional graduation rate calculations
Harry S Truman Elementary School
Harry S Truman Elementary School is located at 1400 Gaskill Avenue, Allentown. In 2013, the School's enrollment was 425 pupils with 37% of pupils receiving a federal free or reduced price meals due to family poverty. According to a report by the Pennsylvania Department of Education, 100% of the teachers were rated highly qualified under the federal No Child Left Behind Act. The school provides half day kindergarten.[32] In 2011, enrollment was 422 pupils K-5th, with 144 pupils from a low income home.
The school is a federally designated Title I school. The school employed 26 teachers yielding a student-teacher ratio of 16:1.[33] According to a report by the Pennsylvania Department of Education, 100% of its teachers were rated "Highly Qualified" under the federal No Child Left Behind Act.[34] The school provides half day kindergarten to all its pupils.[35] For the 2014-15 school year, the school will offer taxpayer funded preschool for all children residing in Salisbury Township School District to children 3 or 4 years old. Enrollees will also receive health and family services.[36]
- 2013 School Performance Profile
Harry S Truman Elementary School achieved a score of 75.2 out of 100. The score reflects on grade level: reading, science, writing and mathematics achievement. In 2012-13, only 63% of the students were reading on grade level in grades 3rd through 5th. In 3rd grade, 71% of the pupils were reading on grade level. In math, just 63% were on grade level (3rd-5th grades). In 4th grade science, only 91% of the pupils demonstrated on grade level understanding. In writing only 53.9% of 5th grade pupils demonstrated on grade level skills.[37] According to the Pennsylvania Department of Education, 2,181 public schools (less than 73 percent of Pennsylvania public schools), achieved an academic score of 70 or higher.
AYP history
In both 2011 and 2012, Harry S. Truman Elementary School achieved Adequate Yearly Progress (AYP) status, even though they did not meet any of the reading and math academic metrics measured.[38] Harry S. Truman Elementary School achieved AYP status each school year from 2003, except in 2008 when the School declined to Warning AYP status due to lagging student achievement in reading and mathematics.[39]
- PSSA History
Each year, in the Spring, the 3rd graders take the PSSAs in math and reading. The fourth grade is tested in reading, mathematics and science. The fifth grade is evaluated in reading, mathematics and writing.
|
5th Grade Reading:
|
5th Grade Math:
|
|
|
- 4th Grade Science
- 2012 - 79%, (4% below basic). State - 82%
- 2011 - 94%, (2% below basic). State - 82.9%
- 2010 - 95%, (1% below basic). State - 81%
- 2009 - 92%, (3% below basic). State - 83%[46]
- 2008 - 90%, (0% below basic). State - 81%
|
|
Western Salisbury Elementary School
Western Salisbury Elementary School is located at 3201 Devonshire Road, Allentown. In 2013, Western Salisbury Elementary School's enrollment declined to 216 pupils with 14% of pupils receiving a federal free or reduced price meals due to family poverty. According to a report by the Pennsylvania Department of Education, 100% of the teachers were rated highly qualified under No Child Left Behind. The school provides half day kindergarten.[48] Additionally, 10.65% of the pupils were identified as gifted, while 14% received special education services.
The school is not a federally designated Title I school. In 2010, enrollment was 229 pupils. The school employed 17 teachers yielding a student-teacher ratio of 13:1.[49] According to a report by the Pennsylvania Department of Education, 100% of its teachers were rated "Highly Qualified" under the federal No Child Left Behind Act.[50] The school provided full day kindergarten to all its pupils.[51]
- 2013 School Performance Profile
Western Salisbury Elementary School achieved a score of 76.9 out of 100. The score reflects on grade level: reading, science, writing and mathematics achievement. In 2012-13, only 77% of the students were reading on grade level in grades 3rd through 5th. In 3rd grade, 83% of the pupils were reading on grade level. In math, 81% were on grade level (3rd-5th grades). In 4th grade science, 96% of the pupils demonstrated on grade level understanding, with 68% reaching advanced achievement. In writing, only 61% of 5th grade pupils demonstrated on grade level writing skills.[52]
AYP history
In 2011 and 2012, Western Salisbury Elementary School achieved AYP status.[53] From 2003 through 2010, Western Salisbury Elementary School achieved AYP status each school year.[54]
- PSSA History
|
|
|
|
- 4th Grade Science
- 2012 - 97%, 67% advanced. State - 82%
- 2011 - 100%, 74% advanced. State - 82.9%
- 2010 - 95%, 74% advanced. State - 81%
- 2009 - 98%, 76% advanced. State - 83%
- 2008 - 97%, 71% advanced. State - 81%
|
|
Salisbury Middle school
Salisbury Middle School is located at 3301 Devonshire Road, Allentown. In 2013, the school's enrollment declined to 372 pupils in grade 6th through 8th, with 27% of the children coming from low income homes. Additionally, 16% of students received special education services, while 12% were identified as gifted.[60] According to a report by the Pennsylvania Department of Education, 100% of its teachers were rated "Highly Qualified" under No Child Left Behind.[61]
According to the National Center for Education Statistics, in 2011, the school reported an enrollment of 404 pupils in grades 6th through 8th, with 97 pupils receiving a federal free or reduced price lunch due to family poverty. The school employed 32 teachers yielding a student-teacher ratio of 12:1.[62] According to a report by the Pennsylvania Department of Education, 100% of teachers were rated "Highly Qualified" under No Child Left Behind.[63]
- 2013 School Performance Profile
Salisbury Middle School achieved 89.4 out of 100. Reflects on grade level reading, writing, mathematics and science achievement. In reading, 78% of the students were on grade level. In Mathematics/Algebra I, 82% of the students showed on grade level skills. In Science, 74% of the 8th graders demonstrated n grade level understanding. In writing, 94% of the 8th grade students were writing on grade level.[64]
AYP History
In 2011 and 2012, Salisbury Middle School achieved AYP status.[65] In 2003 through 2010, Salisbury Middle School achieved AYP status each school year.
- PSSA history
Pennsylvania System of School Assessments, commonly called PSSAs are NCLB related examinations given in the spring of each school year. Sixth and seventh grades are tested in reading and mathematics since 2006. Eighth graders are tested in: reading, writing, mathematics and Science. Beginning in the Spring of 2013, eighth graders, who are enrolled in Algebra I take the Keystone Exam for Algebra I at the end of the course. The testing of 8th grade in reading and mathematics began in 1999. Testing in science began in 2007. The goal is for 100% of students to be on grade level or better in reading and mathematics, by the Spring of 2014. The tests focus on the state's Academic Standards for reading, writing, mathematics and science. The standards were first published in 1998 and are mandated by the Pennsylvania State Board of Education.[66]
|
8th Grade Reading:
|
8th Grade Math: |
8th Grade Science:
- 2012 - 68% on grade level (13% below basic). State - 59%
- 2011 - 74% (9% below basic). State – 58.3%
- 2010 - 70% (11% below basic). State – 57% [73]
- 2009 - 76% (9% below basic). State - 55% [74]
- 2008 - 69%, (5% below basic). State - 52% [75]
- 2007 - tested, but results not made public.
|
7th Grade Reading: |
7th Grade Math:
|
|
6th Grade Reading:
|
6th Grade Math:
|
Special education
In December 2011, the Salisbury Township School District administration reported that 275 pupils or 16.9% of the District's pupils received Special Education services, with 48.4% of the identified students having a specific learning disability.[79] In December 2009, the District administration reported that 305 pupils or 17% of the district's pupils received Special Education services, with 56% of the identified students having a specific learning disability. Special education services in the Commonwealth are provided to students from ages three years to 21 years old. In the 2010-11 school year, the total student enrollment was more than 1.78 million students with approximately 275,000 students eligible for special education services. Among these students 18,959 were identified with mental retardation and 21,245 students with autism.[80] The largest group of students are identified as Specific Learning Disabilities 126,026 students (46.9 percent) and Speech or Language Impairments with 43,542 students (16.2 percent).
In order to comply with state and federal Individuals with Disabilities Education Act rules and regulations, the school district engages in identification procedures to ensure that eligible students receive an appropriate educational program consisting of special education and related services, individualized to meet student needs. At no cost to the parents, these services are provided in compliance with state and federal law; and are reasonably calculated to yield meaningful educational benefit and student progress.[81] To identify students who may be eligible for special education services, various screening activities are conducted on an ongoing basis. These screening activities include: review of group-based data (cumulative records, enrollment records, health records, report cards, ability and achievement test scores); hearing, vision, motor, and speech/language screening; and review by the Special Education administration.[82] When screening results suggest that the student may be eligible, the District seeks parental consent to conduct a multidisciplinary evaluation. Parents who suspect their child is eligible may verbally request a multidisciplinary evaluation from a professional employee of the District or contact the district's Special Education Department.[83][84] The IDEA 2004 requires each school entity to publish a notice to parents, in newspapers or other media, including the student handbook and website regarding the availability of screening and intervention services and how to access them.
In 2010, the state of Pennsylvania provided $1,026,815,000 for Special Education services. This funding is in addition to the state's basic education per pupil funding, as well as, all other state and federal funding.[85] The Special Education funding structure is through the federal Individuals with Disabilities Education Act (IDEA) funds and state appropriations. IDEA funds are appropriated to the state on an annual basis and distributed through intermediate units (IUs) to school districts, while state funds are distributed directly to the districts. Total funds that are received by school districts are calculated through a formula. The Pennsylvania Department of Education oversees four appropriations used to fund students with special needs: Special Education; Approved Private Schools; Pennsylvania Chartered Schools for the Deaf and Blind; and Early Intervention. The Pennsylvania Special Education funding system assumes that 16% of the district’s students receive special education services. It also assumes that each student’s needs accrue the same level of costs.[86] Over identification of students, in order to increase state funding, has been an issue in the Commonwealth. Some districts have more than 20% of its students receiving special education services while others have 10% supported through special education.[87] The state requires each public school district and charter school to have a three-year special education plan to meet the unique needs of its special education students.[88] In 2012, the Obama Administration's US Department of Education issued a directive requiring schools include students with disabilities in extracurricular activities, including sports.[89]
The Salisbury Township School District received a $785,841 supplement for special education services in 2010.[90] For the 2011-12, 2012–13 and 2013-14 school years, all Pennsylvania public school districts received the same level of funding for special education that they received in 2010-11. This level funding is provided regardless of changes in the number of pupils who need special education services and regardless of the level of services the respective students required.[91][92] Additionally, the state provides supplemental funding for extraordinarily impacted students. The District must apply for this added funding.
Gifted education
The Salisbury Township School District Administration reported that 8.74% of its pupils were identified as gifted in 2013. The District reported that 126 pupils or 7.55% of its students were gifted in 2009. The highest percentage of gifted students reported among all 500 school districts and 100 public charter schools in Pennsylvania was North Allegheny School District with 15.5% of its students identified as gifted.[93] By law, the District must provide mentally gifted programs at all grade levels. The referral process for a gifted evaluation can be initiated by teachers or parents by contacting the student’s building principal and requesting an evaluation. All requests must be made in writing. To be eligible for mentally gifted programs in Pennsylvania, a student must have a cognitive ability of at least 130 as measured on a standardized ability test by a certified school psychologist. Other factors that indicate giftedness will also be considered for eligibility.[94][95] In March 2003, the Salisbury Township School Board established a policy regarding the treatment of gifted students.[96]
Budget
Pennsylvania public school districts budget and expend funds according to procedures mandated by the General Assembly and the Pennsylvania Department of Education (PDE). An annual operating budget is prepared by school district administrative officials. A uniform form is furnished by the PDE and submitted to the board of school directors for approval prior to the beginning of each fiscal year on July 1.
Under Pennsylvania’s Taxpayer Relief Act, Act 1 of the Special Session of 2006, all school districts of the first class A, second class, third class and fourth class must adopt a preliminary budget proposal. The proposal must include estimated revenues and expenditures and the proposed tax rates. This proposed budget must be considered by the Board no later than 90 days prior to the date of the election immediately preceding the fiscal year. The preliminary budget proposal must also be printed and made available for public inspection at least 20 days prior to its adoption. The board of school directors may hold a public hearing on the budget, but are not required to do so. The board must give at least 10 days’ public notice of its intent to adopt the final budget according to Act 1 of 2006.[97]
In 2012, the average teacher salary in Salisbury Township School District was $67,766 a year, while the cost of the benefits teachers received was $21,347 per employee, for a total annual average teacher compensation of $89,113.[98] The teacher's benefits package costs was in the top 10% among Pennsylvania public school educators. The District employed 149 teachers. In 2011, the average teacher salary was $67,452 and a top salary of $140,000.[99]
In 2009, the Salisbury Township School District reported employing 161 teachers and administrators with a median salary of $65,898 and a top salary of $133,110.[100] The teacher’s work day is 7.5 hours with 180 days in the contract year. Additionally, the teachers receive a defined benefit pension, health insurance, professional development reimbursement, paid personal days, 10 paid sick days, and other benefits.[101] In 2011, teachers in the Salisbury School District agreed to a new contract that included average annual raises of about 2.8 percent through the 2013-14 school year. The new contract adde $250 for single coverage and $500 for multiple-person coverage and teachers will contribute 1% of their salary towards their health insurance policy costs. The prior four-year contract, which expired Aug. 31, 2009, gave average annual pay hikes of 4.25 percent.[102][103]
Per pupil spending Salisbury Township School District administrative costs per pupil in 2008 was $887.79 per pupil which was in the top 20% in the Commonwealth. The lowest administrative cost per pupil in Pennsylvania was $398 per pupil.[104] The Pennsylvania School Boards Association collects and maintains statistics on salaries of public school district employees in Pennsylvania. According to the association's report, the average salary for a superintendent, for the 2007-08 school year, was $122,165. Superintendents and administrators receive a benefit package commensurate with that offered to the district's teachers' union.[105] According to PSBA, the median Superintendent salary rose to over $130,000 in 2011.[106]
In 2008, the Salisbury Township School District administration reported that per pupil spending was $14,753 which ranked 68th among Pennsylvania's then 501 public school districts. In 2010, the District’s per pupil spending had increased to $17,507.21, which ranked 49th in Pennsylvania.[107] In 2011, Pennsylvania’s per pupil spending was $13,467, ranking 6th in the United States.[108] In 2007, the Pennsylvania per pupil total expenditures was reported as $12,759.[109]
The U.S. Census Bureau reported that Pennsylvania spent $8,191 per pupil in school year 2000-01.[110] In 2007, the Pennsylvania per pupil total expenditures was reported as $12,759.[111] Among the fifty states, Pennsylvania’s total per pupil revenue (including all sources) ranked 11th at $15,023 per student, in 2008-09.[112] Pennsylvania’s total revenue per pupil rose to $16,186 ranking 9th in the nation in 2011.[113]
Reserves In 2008, the Salisbury Township School District reported a balance of $2,231,318, in its unreserved-designated fund. The unreserved-undesignated fund balance was reported as $2,267,978.[114] In 2013, Salisbury Township School District Administration reported an increase to $4,813,690 in the fund balance. Pennsylvania public school district reserve funds are divided into two categories – designated and undesignated. The undesignated funds are not committed to any planned project. Designated funds and any other funds, such as capital reserves, are allocated to specific projects. School districts are required by state law to keep 5 percent of their annual spending in the undesignated reserve funds to preserve bond ratings. According to the Pennsylvania Department of Education, from 2003 to 2010, as a whole, Pennsylvania school districts amassed nearly $3 billion in reserved funds.[115] In 2005, the total reserve funds held by Pennsylvania public school districts was $1.9 billion.[116] By 2013, reserves held by Pennsylvania public school districts, as a whole, had increased to over $3.8 billion.[117]
Audit In June 2013, the Pennsylvania Auditor General conducted a performance audit of the Salisbury Township School District. Several serious issues were identified including false income reports to the retirement board. The findings were reported to the School Board and the District’s administration.[118]
Tuition Students who live in the Salisbury Township School District's attendance area may choose to attend one of Pennsylvania's 157 public charter schools. A student living in a neighboring public school district or a foreign exchange student may seek admission to Salisbury Township School District. For these cases, the Pennsylvania Department of Education sets an annual tuition rate for each school district. It is the amount the public school district pays to a charter school for each resident student that attends the charter and it is the amount a nonresident student's parents must pay to attend the District's schools. The 2012 tuition rates are: Elementary School - $12,329.45, High School - $12,880.45.[119]
The district is funded by a combination of: a local earned income tax 0.5%,[120] a property tax, two per capita taxes $5 each, Business Privilege tax 1.5%, local services tax $10, a real estate transfer tax 0.5%, coupled with substantial funding from the Commonwealth of Pennsylvania and the federal government.[121] Grants can provide an opportunity to supplement school funding without raising local taxes. Interest earnings on accounts also provide nontax income to the District. In the Commonwealth of Pennsylvania, pension income and Social Security income are exempted from state personal income tax and local earned income tax, regardless of the level of the individual’s personal wealth.[122] The average Pennsylvania public school teacher pension in 2011 exceeds $60,000 a year plus they receive federal Social Security benefits: both are free of Pennsylvania state income tax and local income tax which funds local public schools.[123]
State basic education funding
According to a report from Representative Todd Stephens office, Salisbury Township School District receives 17.5% of its annual revenue from the state.[124]
For the 2013-14 school year, the Salisbury Township School District received a 2.1% increase or $2,179,617 in Pennsylvania Basic Education Funding. This is $44,265 more than its 2012-13 state BEF to the District. Additionally, Salisbury Township School District received $36,252 in Accountability Block Grant funding to focus on academic achievement and level funding for special education services. Among the public school districts in Lehigh County, Allentown School District received the highest percentage increase in BEF at 11%. The District has the option of applying for several other state and federal grants to increase revenues. The Commonwealth’s budget increased Basic Education Funding statewide by $123 million to over $5.5 billion. Most of Pennsylvania’s 500 public school districts received an increase of Basic Education Funding in a range of 0.9% to 4%. Eight public school districts received exceptionally high funding increases of 10% to 16%. The highest increase in state funding was awarded to Austin Area School District which received a 22.5% increase in Basic Education Funding.[125] The highest percent of state spending per student is in the Chester-Upland district, where roughly 78 percent comes from state coffers. In Philadelphia, it is nearly 49 percent.[126] As a part of the education budget, the state provided the PSERS (Pennsylvania school employee pension fund) with $1,017,000,000 and Social Security payments for school employees of $495 million.[127]
For the 2012-13 school year, the Salisbury Township School District received $2,135,352 .[128] The Governor's Executive Budget for 2012-2013 included $9.34 billion for kindergarten through 12th grade public education, including $5.4 billion in basic education funding, which was an increase of $49 million over the 2011-12 budget. In addition, the Commonwealth provided $100 million for the Accountability Block Grant (ABG) program. Salisbury Township School District received $36,252 in Accountability Block Grant funding to focus on academic achievement. The state also provided a $544.4 million payment for School Employees’ Social Security and $856 million for School Employees’ Retirement fund called PSERS.[129] This amount was a $21,823,000 increase (0.34%) over the 2011-2012 appropriations for Basic Education Funding, School Employees' Social Security, Pupil Transportation, Nonpublic and Charter School Pupil Transportation. Since taking office, Corbett’s first two budgets have restored more than $918 million in support of public schools, compensating for the $1 billion in federal stimulus dollars lost at the end of the 2010-11 school year.
In 2011-12, the Salisbury Township School District received a 2,135,352 in state Basic Education Funding.[130][131] Additionally, the School District received $32,252 in Accountability Block Grant funding. The enacted Pennsylvania state Education budget included $5,354,629,000 for the 2011-2012 Basic Education Funding appropriation. This amount was a $233,290,000 increase (4.6%) over the enacted State appropriation for 2010-2011.[132] The highest increase in state basic education funding was awarded to Duquesne City School District of Allegheny County, which got a 49% increase in state funding for 2011-12.[133] In 2010, the district reported that 286 students received free or reduced price lunches, due to the family meeting the federal poverty level.[134] Some public school Districts experienced a reduction in funding due to the loss of federal stimulus funding which ended in 2011.
In the 2010-11 budget year, the Commonwealth of Pennsylvania provided a 2% increase in Basic Education Funding for a total of $2,270,726 . Among the districts in Lehigh County, the highest increase went to Parkland School District which got a 6.53% increase. One hundred fifty Pennsylvania school districts received the base 2% increase. The highest increase in 2010-11 went to Kennett Consolidated School District in Chester County, which received a 23.65% increase in state funding.[135] Fifteen (15) Pennsylvania public school districts received a BEF increase of greater than 10%. The state's hold harmless policy regarding state basic education funding continued where each district received at least the same amount as it received the prior school year, even when enrollment had significantly declined. The amount of increase each school district received was set by Governor Edward Rendell and then Secretary of Education Gerald Zahorchak, as a part of the state budget proposal given each February. This was the second year of Governor Rendell’s policy to fund some public school districts at a far greater rate than others.[136]
In the 2009-10 budget year, the Commonwealth of Pennsylvania provided Salisbury Township School District received a 4.25%% increase in Basic Education Funding for a total of $2,226,202. Among the districts in Lehigh County, the highest increase went to Whitehall-Coplay School District which got a 15.17%. Allentown School District received a 13.47% increase. Ninety (90) Pennsylvania public school districts received the base 2% increase. Muhlenberg School District in Berks County received a 22.31% increase in state basic education funding in 2009.[137] The amount of increase each school district received was set by Governor Edward G. Rendell and the Secretary of Education Gerald Zahorchak, as a part of the state budget proposal.[138]
The state Basic Education Funding to the Salisbury Township School District in 2008-09 was $2,135,351.74. According to the Pennsylvania Department of Education, 218 district students received free or reduced- price lunches due to low family income in the 2007–2008 school year.[139] According to the U.S. Census Bureau, Pennsylvania spent $7,824 Per Pupil in the year 2000. This amount increased up to $12,085 by the year 2008.[140][141]
Accountability Block Grants
Beginning in 2004-2005, the state launched the Accountability Block Grant school funding. This program has provided $1.5 billion to Pennsylvania’s school districts. The Accountability Block Grant program requires that its taxpayer dollars are focused on specific interventions that are most likely to increase student academic achievement. These interventions include: teacher training, All Day Kindergarten, lower class size K-3rd grade, literacy and math coaching programs that provide teachers with individualized job-embedded professional development to improve their instruction, before or after school tutoring assistance to struggling students. For 2010-11, the Salisbury Township School District applied for and received $98,397 in addition to all other state and federal funding. The district uses the funding to provide New Curriculum and Course Offerings.[142][143] In 2009, 100% of the kindergarteners in Area School District attended full-day kindergarten.[144]
Classrooms for the Future grant
The Classroom for the Future state program provided districts with hundreds of thousands of extra state funding to buy laptop computers for each core curriculum high school class (English, Science, History, Math) and paid for teacher training to optimize the computers use. The program was funded from 2006 to 2009. The Salisbury Township School District did not apply to participate in 2006-07. In 2007-08, the District received $162,577. The District also received $45,413 in 2008-09.[145] Among the public school districts in Lehigh County the highest award was given to Allentown School District which received $2,073,899. The highest funding statewide was awarded to Philadelphia City School District in Philadelphia County - $9,409,073. The grant program was discontinued by Governor Edward Rendell as part of the 2009-10 state budget.
Other grants
The Salisbury Township School District did not participate in: Pennsylvania Department of Environmental Protection's Environmental Education annual grants, PA Science Its Elementary grants (discontinued effective with 2009-10 budget by Governor Rendell), Education Assistance Grants, 2012 Striving Readers Comprehensive Literacy grant, 2012 and 2013 Pennsylvania Hybrid Learning Grants,[146] nor the federal 21st Century Learning grants.
Federal Stimulus grant
The Salisbury Township School District received an extra $808,042 in American Recovery and Reinvestment Act of 2009 (ARRA) - Federal Stimulus money to be used in specific programs like special education and meeting the academic needs of low-income students.[147][148] The funding was limited to the 2009-10 and 2010-2011 school years.[149] Due to the temporary nature of the funding, schools were repeatedly advised to use the funds for one time expenditures like: acquiring equipment, making repairs to buildings, training teachers to provide more effective instruction or purchasing books and software.
Race to the Top grant
Salisbury Township School District officials did not apply for the federal Race to the Top grant which would have provided over one million dollars, in additional federal funding, to improve student academic achievement.[150] Participation required the administration, the school board and the local teachers' union to sign an agreement to prioritize improving student academic success. In Pennsylvania, 120 public school districts and 56 charter schools agreed to participate.[151] Pennsylvania was not approved for the grant. The failure of districts to agree to participate was cited as one reason that Pennsylvania was not approved.[152][153][154]
Local Services Tax
All local taxing authorities are required by the Local Tax Enabling Act to exempt disabled veterans and members of the armed forces reserve who are called to active duty at any time during the tax year from any local services tax and to exempt from any local services tax levied at a rate in excess of $10 those persons whose total income and net profits from all sources within the political subdivision is less than $12,000 for the tax year. The Local Tax Enabling Act also authorizes, but does not require, taxing authorities to exempt from per capita, occupation, and earned income taxes and any local services tax levied at a rate of $10 or less per year, any person whose total income from all sources is less than $12,000 per year.
Real estate taxes
Property tax rates in 2013-14 were set by the school board at 16.9203 mills. A mill is $1 of tax for every $1,000 of a property's assessed value. Irregular property reassessments have become a serious issue in the commonwealth as it creates a significant disparity in taxation within a community and across a region.[155] Property taxes, in the Commonwealth of Pennsylvania, apply only to real estate - land and buildings. The property tax is not levied on cars, business inventory, or other personal property. Certain types of property are exempt from property taxes, including: places of worship, places of burial, private social clubs, charitable and educational institutions and all government property (local, state and federal). Additionally, service related, disabled US military veterans may seek an exemption from paying property taxes. Pennsylvania school district revenues are dominated by two main sources: 1) Property tax collections, which account for the vast majority (between 75-85%) of local revenues; and 2) Act 511 tax collections, which are around 15% of revenues for school districts.[156] When a Pennsylvania public school district includes municipalities in two counties, each of which has different rates of property tax assessment, a state board equalizes the tax rates between the counties.[157] In 2010, miscalculations by the State Tax Equalization Board (STEB) were widespread in the Commonwealth and adversely impacted funding for many school districts, including those that did not cross county borders.[158]
In Salisbury Township School District Lehigh Valley Hospital is not required to make annual property tax payments, however the Hospital does make a smaller "Payment in Lieu of Taxes".[159]
In 2013, the school board rebalanced property taxes changing the property tax millage rate to 16.5076 mills. Before property reassessment, the property tax rate would have been 50.1580 mills.[160] The change was due to Lehigh County wide property reassessment done in 2012.[161][162]
The average yearly property tax paid by Lehigh County residents amounts to about 4.39% of their yearly income in 2013. Lehigh County ranked 149th out of the 3143 United States counties for property taxes as a percentage of median income.[171] Lehigh County has one of the highest median property taxes in the United States, and is ranked 157th of the 3143 counties in order of median property taxes. According to a report prepared by the Pennsylvania Department of Education, the total real estate taxes collected by all school districts in Pennsylvania rose from $6,474,133,936 in 1999-00 to $10,438,463,356 in 2008-09 and to $11,153,412,490 in 2011.[172] Property taxes in Pennsylvania are relatively high on a national scale. According to the Tax Foundation, Pennsylvania ranked 11th in the U.S. in 2008 in terms of property taxes paid as a percentage of home value (1.34%) and 12th in the country in terms of property taxes as a percentage of income (3.55%).[173]
Act 1 Adjusted Index
The Act 1 of 2006 Index regulates the rates at which each school district can raise property taxes in Pennsylvania. Districts are not permitted to raise property taxes above their annual Act 1 Index unless they either: allow Districts voters to approve the increase through a vote by referendum or they receive an exception from the Pennsylvania Department of Education. The base index for the school year is published by the PDE in the fall of each year. Each individual school district’s Act 1 Index can be adjusted higher, depending on a number of factors, such as local property values and the personal income of district residents. Originally, Act 1 of 2006 included 10 exceptions, including: increasing pension costs, increases in special education costs, a catastrophe like a fire or flood, increase in health insurance costs for contracts in effect in 2006 or dwindling tax bases. The base index is the average of the percentage increase in the statewide average weekly wage, as determined by the PA Department of Labor and Industry, for the preceding calendar year and the percentage increase in the Employment Cost Index for Elementary and Secondary Schools, as determined by the Bureau of Labor Statistics in the U.S. Department of Labor, for the previous 12-month period ending June 30. For a school district with a market value/personal income aid ratio (MV/PI AR) greater than 0.4000, its index equals the base index multiplied by the sum of .75 and its MV/PI AR for the current year.[174]
In June 2011, the Pennsylvania General Assembly passed legislation eliminating six of the exceptions to the Act 1 Index.[175] Several exceptions were maintained: 1) costs to pay interest and principal on indebtedness incurred prior to September 4, 2004 for Act 72 schools and prior to June 27, 2006 for non-Act 72 schools; 2) costs to pay interest and principal on electoral debt; 3) costs incurred in providing special education programs and services (beyond what is already paid by the State); and 4) costs due to increases of more than the Index in the school’s share of payments to PSERS (PA school employees pension fund) taking into account the state mandated PSERS contribution rate.[176][177] The legislature also froze the payroll amount public school districts use to calculate the pension-plan exception at the 2012 payroll levels. Further increases in payroll cannot be used to raise the district’s exception for pension payments.
A specific timeline for Act I Index decisions is published annually, by the Pennsylvania Department of Education.[178]
The School District Adjusted Index history for the Salisbury Township School District:
|
For the 2013-14 budget year, Salisbury Township School Board applied for two exceptions to exceed their Act 1 Index limit for: rapidly escalating teacher pension costs and for School Construction Grandfathered Debt. The School Construction Grandfathered Debt request was denied by the PDE. For the school budget year 2013-14, 311 Pennsylvania public school districts adopted a resolution certifying that tax rates would not be increased above their index. Another 171 school districts adopted a preliminary budget leaving open the option of exceeded the Index limit. For the exception for pension costs, 89 school districts received approval to exceed the Index in full while others received a partial approval of their request. For special education costs, 75 districts received approval to exceed their tax limit. For the pension costs exception, 169 school districts received approval to exceed the Index. Eleven Pennsylvania public school districts received an approval for grandfathered construction debts.[183]
For the 2012-13 budget year, Salisbury Township School Board applied for several exceptions to exceed the Act 1 Index: for School Construction Grandfathered Debt, Special education costs and for rapidly escalating pension costs. For 2012-2013, 274 school districts adopted a resolution certifying that tax rates would not be increased above their index; 223 school districts adopted a preliminary budget leaving open the option of exceeded the Index limit. For the exception for pension costs, 194 school districts received approval to exceed the Index. For special education costs, 129 districts received approval to exceed the tax limit.[184]
For the 2011-12 school year, the Salisbury Township School Board applied for several exceptions to exceed the Act 1 Index, including:: Maintenance of Local Tax Revenue, Maintenance of Selected Revenue, escalating Teacher Pensions, Special Education Expenditures and School Construction Grandfathered Debt. Each year, the Salisbury Township School Board has the option of adopting either: 1) a resolution in January certifying they will not increase taxes above their index or 2) a preliminary budget in February. A school district adopting the resolution may not apply for referendum exceptions or ask voters for a tax increase above the inflation index.
According to a state report, for the 2011-12 school year budgets, 247 school districts adopted a resolution certifying that tax rates would not be increased above their index; 250 school districts adopted a preliminary budget. Of the 250 school districts that adopted a preliminary budget, 231 adopted real estate tax rates that exceeded their index. Tax rate increases in the other 19 school districts that adopted a preliminary budget did not exceed the school district’s index. Of the districts who sought exceptions: 221 used the pension costs exemption and 171 sought a Special Education costs exemption. Only 1 school district sought an exemption for Nonacademic School Construction Project, while 1 sought an exception for Electoral debt for school construction.[185]
For the budget in 2010-11, the Salisbury Township School Board applied for several exceptions to exceed the Act 1 index, including: rising teacher pension costs, increasing special education costs, and School Construction Grandfathered Debt.[186]
For the 2009-10 school budget, the Salisbury Township School Board did not apply for exceptions to exceed the Index.[187] In the Spring of 2010, 135 Pennsylvania school boards asked to exceed their adjusted index. Approval was granted to 133 of them and 128 sought an exception for pension costs increases.[188]
Property tax relief
In 2012, Salisbury Township School District approved 4,256 homestead properties receiving $119 in property tax relief.[189] In 2009, Salisbury Township School District approved 4,246 homestead properties to receive $118 in property tax relief.[190] The tax relief was subtracted from the total annual school property tax bill. Property owners apply for the relief through the county Treasurer's office. Farmers can qualify for a farmstead exemption on building used for agricultural purposes. The farm must be at least 10 contiguous acres (40,000 m2) and must be the primary residence of the owner. Farmers can qualify for both the homestead exemption and the farmstead exemption. The amount of property tax relief each Pennsylvania public school district receives is announced by the PDE in May of each year. The amount of tax relief is dependent on the total tax revenue collected on the casino slots in the previous year. Thirty five percent of the slots tax revenues are used for property tax relief. In Lehigh County, the highest tax relief went to Allentown School District which was set at $530.[191] The highest property tax relief provided, among Pennsylvania school districts, goes to the homesteads of Chester Upland School District in Delaware County which received $632 per approved homestead in 2010. Chester-Upland School District has consistently been the top recipient since the programs inception.[192] The tax relief was started by Governor Rendell with passage of the gaming law. Rendell promised taxpayers substantial property tax relief from legalized gambling.
According to a 2010 report by Pennsylvania Auditor General Jack Wagner, 76% of eligible property owners, in Lehigh County, applied for the property tax relief in 2009.[193]
In Pennsylvania, the homestead exclusion reduces the assessed values of homestead properties, reducing the property tax on these homes. The homestead exclusion allows homeowners real property tax relief of up to one half of the median assessed value of homesteads in the taxing jurisdiction (county, school district, city, borough, or township).[194]
Additionally, the Pennsylvania Property Tax/Rent Rebate program is provided for low income Pennsylvanians aged 65 and older; widows and widowers aged 50 and older; and people with disabilities age 18 and older. The income limit is $35,000 for homeowners. The maximum rebate for both homeowners and renters is $650. Applicants can exclude one-half (1/2) of their Social Security income, consequently people who have an income of substantially more than $35,000 still qualify for a rebate. Individuals must apply annually for the rebate. This tax rebate can be taken in addition to Homestead/Farmstead Property Tax Relief. In 2012, the Pennsylvania Secretary of the Treasury reported issuing more than half a million property tax rebates totaling $238 million.[195] The Property tax/rent rebate program is funded by revenues from the Pennsylvania Lottery. In 2012, these property tax rebates were increased by an additional 50 percent for senior households in the state, so long as those households have incomes under $30,000 and pay more than 15% of their income in property taxes.[196]
Enrollment
According to Pennsylvania Department of Education (PDE) enrollment reports, there were 1,807 students enrolled in K-12 in 2006-07 school year at Salisbury Township School District. Enrollment declined to 1,629 students in 2010-11. By October 2013, enrollment had declined further to 1,592 pupils in K-12. Enrollment had declined by 215 pupils or 12% since 2006. Enrollment is projected by the PDE to further decline to 1,500 students by 2020.[197] In 2008, the Salisbury Township School District administrative costs were very high at $887.79 per pupil. This was the highest administrative per pupil spending in Lehigh County with Allentown School District spending the least at $534.24 per pupil. By 2010, the per pupil administrative spending had risen to $958.53.[198] The lowest administrative cost per pupil in Pennsylvania was $398 per pupil.[199] A study of Pennsylvania public school spending, conducted by Standard and Poor's, examined the consolidation of small public school district in Pennsylvania in 2007. The study found that consolidation of the administration functions, with an adjacent school district, would achieve substantial administrative cost savings which varied by district.[200]
According to a 2009 school district administration consolidation proposal, by Governor Edward Rendell, the excessive administrative overhead dollars could be redirected to improve lagging academic achievement, to enrich the academic programs or to reduce local property taxes.[201] Consolidation of two central administrations into one would not require the closing of any schools. The Governor's proposal called for the savings to be redirected to improving lagging reading and science achievement, to enriching the academic programs or to reducing residents' property taxes.[202] In March 2011, the Pennsylvania Institute of Certified Public Accountants Fiscal Responsibility Task Force released a report which found that consolidating school district administrations with one neighboring district would save the Commonwealth $1.2 billion without forcing the consolidation of any schools.[203]
Pennsylvania’s birth rate has been declining for two decades. According to data from the Pennsylvania Department of Health, in 1990, the Commonwealth of Pennsylvania’s annual birth rate was 171,053.[204] In 2000, Pennsylvania’s birth rate declined to 145,874.[205] Finally in 2011, the State’s birth rate declined further to 142,021.[206] In Lehigh County, the birth rate was 4,147 in 1990. In 2000, Lehigh County's birth rate declined to 3,770 births.
Extracurriculars
The Salisbury Township School District offers a wide variety of clubs, activities and an extensive, costly sports program. Eligibility for participation is determined by school board policy and in compliance with standards set by the Pennsylvania Interscholastic Athletic Association (PIAA).[207][208]
In 2008, the District spent $1,000,000 to install artificial turf in its football field. A goal was set for donations to cover roughly 50% of the costs with the rest to be born by the local taxpayers in added property taxes.[209][210] The school district paid the full cost when the install was completed. The fund raising provided $60,000 to the district.[211] In January 2012, the Salisbury Education Foundation notified the school Board that they would not be making payments on the turf project. Additionally, they informed the Board that the Turf Committee no longer exists.[212]
By Pennsylvania law, all K-12 students residing in the district, including those who attend a private nonpublic school, cyber charter school, charter school and those homeschooled, are eligible to participate in the extracurricular programs including all athletics. They must meet the same eligibility rules as the students enrolled in the district's schools.[213]
Sports
The District funds
- Varsity
|
|
- Middle School Sports
|
|
According to PIAA directory July 2013 [214]
References
- ↑ Pennsylvania Department of Education, Ed Names and Addresses - Salisbury Township School District, 2014
- ↑ National center for Education Statistics, Common Core of Data - Salisbury Township School District, 2011
- ↑ Pennsylvania Department of Education (December 5, 2013). "Salisbury School District School Performance report fast facts".
- ↑ Pennsylvania Department of Education, Enrollment and Projections by LEA, 2010
- ↑ Pennsylvania Department of Education, Enrollment and Projections by LEA, 2009
- ↑ Pennsylvania Department of Education (July 2011). "Enrollment and Projections by school district".
- ↑ Salisbury Township School District Business Manager (June 26, 2013). "Salisbury Township School District Budget 2013-14" (PDF).
- ↑ Precious Petty (June 14, 2012). "Salisbury Township School Board OKs final 2012-13 budget, 4 percent". The Express-Times.
- ↑ Salisbury Township School District Business Manager (June 8, 2011). "Salisbury Township School District Budget 2011-12" (PDF).
- ↑ US Census Bureau, 2010 Census Poverty Data by Local Education Agency, 2011
- ↑ US Census Bureau, American Fact Finder, 2009
- ↑ US Census Bureau (2010). "American Fact Finder, State and County quick facts".
- ↑ US Census Bureau (September 2011). "Income, Poverty, and Health Insurance Coverage in the United States: 2010" (PDF).
- ↑ Michael Sauter & Alexander E.M. Hess, (August 31, 2013). "America's most popular six-figure jobs". USA Today.
- ↑ proximityone (2014). "School District Comparative Analysis Profiles".
- ↑ Pennsylvania Public School Code Governance 2010
- ↑ Pittsburgh Business Times (April 5, 2013). "Guide to Pennsylvania Schools Statewide ranking 2013".
- ↑ "Statewide Honor Roll Rankings 2013". Pittsburgh Business Times. April 5, 2013.
- ↑ Pittsburgh Business Times, Pennsylvania School District Rankings 2008, May 6, 2008
- ↑ "Three of top school districts in state hail from Allegheny County". Pittsburgh Business Times. May 23, 2007.
- ↑ Pittsburgh Business Times, Statewide Overachivers Ranking Information, April 4, 2013
- ↑ "Overachiever statewide ranking". Pittsburgh Business Times. May 6, 2010.
- ↑ Pennsylvania Department of Education (September 21, 2012). "Salisbury Township School District Adequate Yearly Progress Overview 2012".
- ↑ Pennsylvania Department of Education, Salisbury Township School District AYP Overview 2003-2012, 2012
- ↑ Pennsylvania Department of Education (October 2013). "School Performance profile Salisbury Senior High School".
- ↑ Pennsylvania Department of Education (September 21, 2012). "Salisbury Township School District AYP Data Table 2012".
- ↑ Pennsylvania Department of Education, School District AYP Data Table 2011, September 29, 2011
- ↑ Pennsylvania Department of Education (March 15, 2011). "New 4-year Cohort Graduation Rate Calculation Now Being Implemented".
- ↑ The Times-Tribune (June 27, 2010). "PA School District Statistical Snapshot Database 2008-09".
- ↑ The Times-Tribune (June 25, 2009). "County School Districts Graduation Rates 2008".
- ↑ Pennsylvania Partnerships for Children (2008). "High School Graduation rate 2007" (PDF).
- ↑ Pennsylvania Department of Education, School Performance Profile, Harry S Truman Elementary School Fast Facts, 2013
- ↑ National Center for Education Statistics, Common Core Data – Harry S Truman Elementary School, 2011
- ↑ Pennsylvania Department of Education, Professional Qualifications of Teachers Harry S Truman Elementary School, September 21, 2012
- ↑ Pennsylvania Partnership for Children, Full-Day Kindergarten Enrollment, 2010
- ↑ Salisbury Township School District administration, APPLICATION FOR PRESCHOOL PROGRAM & EARLY HEAD START HARRY S TRUMAN ELEMENTARY, 2014
- ↑ Pennsylvania Department of Education (October 4, 2013). "Harry S Truman Elementary School Academic Performance Data 2013".
- ↑ Pennsylvania Department of Education (September 21, 2012). "Harry S. Truman Elementary School AYP Overview 2012".
- ↑ Pennsylvania Department of Education, AYP Status 2003-2012 by LEA and School, 2013
- ↑ Pennsylvania Department of Education (September 21, 2012). "Harry S. Truman Elementary School Academic Achievement Report Card 2012" (PDF).
- ↑ Pennsylvania Department of Education, Harry S. Truman Elementary School Academic Achievement Report Card 2010, October 20, 2010
- ↑ Pennsylvania Department of Education, Harry S. Truman Elementary School Academic Achievement Report Card 2009, September 14, 2009
- ↑ Pennsylvania Department of Education, Harry S. Truman Elementary School Academic Achievement Report Card 2008, August 15, 2008
- ↑ Pennsylvania Department of Education, Harry S. Truman Elementary School Academic Achievement Report Card 2007, 2007
- ↑ The Times-Tribune (September 14, 2009). "Grading Our Schools database, 2009 PSSA results".
- ↑ The Times-Tribune (2009). "Grading Our Schools database, 2009 Science PSSA results".
- ↑ Pittsburgh Post Gazette (October 15, 2012). "How is your school doing?".
- ↑ Pennsylvania Department of Education (2013). "School Performance Profile, Western Salisbury Elementary School Fast Facts".
- ↑ National Center for Education Statistics, Common Core Data – Western Salisbury Elementary School, 2011
- ↑ Pennsylvania Department of Education, Professional Qualifications of Teachers Elementary School, September 21, 2012
- ↑ Pennsylvania Partnership for Children, Full-Day Kindergarten Enrollment, 2010
- ↑ Pennsylvania Department of Education (October 4, 2013). "Western Salisbury Elementary School Academic Performance Data 2013".
- ↑ Pennsylvania Department of Education, (September 21, 2012). "Western Salisbury Elementary School AYP Overview 2012".
- ↑ Pennsylvania Department of Education, AYP status by LEA and School 2003-2012, 2012
- ↑ Pennsylvania Department of Education (September 21, 2012). "Western Salisbury Elementary School Report Card 2012" (PDF).
- ↑ Pennsylvania Department of Education, Western Salisbury Elementary School Report Card 2010, October 20, 2010
- ↑ Pennsylvania Department of Education, Western Salisbury Elementary School Report Card 2009, September 15, 2009
- ↑ Pennsylvania Department of Education, Western Salisbury Elementary School Report Card 2008, August 15, 2008
- ↑ Pittsburgh Post Gazette (October 15, 2012). "How is your school doing?".
- ↑ Pennsylvania Department of Education (October 4, 2013). "School Performance Profile Salisbury Middle School".
- ↑ Pennsylvania Department of Education, Professional Qualifications of Teachers Salisbury Middle School, October 4, 2013
- ↑ National Center for Education Statistics, Common Core Data – Salisbury Middle School, 2011
- ↑ Pennsylvania Department of Education, Professional Qualifications of Teachers Salisbury Middle School, September 21, 2012
- ↑ Pennsylvania Department of Education (October 4, 2013). "Salisbury Middle School Academic Performance Data 2013,".
- ↑ Pennsylvania Department of Education (September 21, 2012). "Salisbury Middle School AYP Overview 2012".
- ↑ Pennsylvania Department of Education (2014). "State Academic Standards".
- ↑ Pittsburgh Post Gazette (October 15, 2012). "How is your school doing?".
- ↑ Pennsylvania Department of Education, Salisbury Middle School Academic Achievement Report Card 2010, October 20, 2010
- ↑ Pennsylvania Department of Education (August 15, 2008). "Reading and Math PSSA 2008 by Schools".
- ↑ Pennsylvania Department of Education (September 21, 2012). "Salisbury Middle School Academic Achievement Report Card 2012" (PDF).
- ↑ Pennsylvania Department of Education Report (September 14, 2010). "2010 PSSAs: Reading, Math, Writing Results".
- ↑ Pennsylvania Department of Education (2009). "2009 PSSAs: Reading, Math, Writing and Science Results".
- ↑ Pennsylvania Department of Education Report (August 2010). "Science PSSA 2010 by Schools".
- ↑ Pennsylvania Department of Education Report (August 2009). "Science PSSA 2009 by Schools".
- ↑ Pennsylvania Department of Education Report (August 15, 2008). "Science PSSA 2008 by Schools".
- ↑ Pennsylvania Department of Education, Salisbury Middle School Academic Achievement Report Card 2009, September 14, 2009
- ↑ Pennsylvania Department of Education, Salisbury Middle School Academic Achievement Report Card 2008, August 15, 2008
- ↑ Pennsylvania Department of Education, Salisbury Middle School Academic Achievement Report Card 2007, 2007
- ↑ Pennsylvania Bureau of Special Education Services (2010–2011). "Salisbury Township School District Special Education Data Report LEA Performance on State Performance Plan (SPP) Targets".
- ↑ Pennsylvania Department of Education, Testimony Hearing on Special Education Senate Republican Policy Committee, January 2013
- ↑ Pennsylvania Bureau of Special Education (2008). "Pennsylvania Parent Guide to Special Education Services".
- ↑ Nora Perron-Jones, Director of Special Education (2014). "Special Education".
- ↑ Pennsylvania Department of Education - Salisbury Township School District Administration (January 6, 2011). "Procedural Safeguards Notice".
- ↑ Pennsylvania Department of Education, Bureau of Special Education (September 2005). "Gaskin Settlement Agreement Overview Facts Sheet" (PDF).
- ↑ Pennsylvania Department of Education. "Pennsylvania Special Education Funding".
- ↑ Browne, Patrick., Senate Education Committee Hearing on Special Education Funding & Accountability testimony, November 1, 2011
- ↑ Kintisch, Baruch., Public Hearing: Special Education Funding & Accountability Testimony, Education Law Center, November 11, 2011
- ↑ Amy Morton, Executive Deputy Secretary, Public Hearing: Special Education Funding & Accountability Testimony, Pennsylvania Department of Education, November 11, 2011
- ↑ US Department of Education, U.S. Department of Education Clarifies Schools' Obligation to Provide Equal Opportunity to Students with Disabilities to Participate in Extracurricular Athletics, January 25, 2013
- ↑ Pennsylvania Department of Education (July 2010). "Special Education Funding from Pennsylvania State_2010-2011".
- ↑ Pennsylvania Department of Education (2011). "Special Education Funding 2011-2012 Fiscal Year".
- ↑ Pennsylvania Department of Education (April 2012). "Investing in PA kids,".
- ↑ Pennsylvania Department of Education. "Gifted Students as Percentage of Total Enrollment by School District/Charter School - Revised December 1, 2009 Child Count (Collected July 2010)" (PDF). Archived from the original (PDF) on March 29, 2012.
- ↑ Pennsylvania Department of Education and Pennsylvania School Board. "CHAPTER 16. Special Education For Gifted Students". Retrieved February 4, 2011.
- ↑ Pennsylvania Department of Education (March 26, 2010). "Special Education for Gifted Students Notice of Parental rights" (PDF).
- ↑ Salisbury Township School Board (March 19, 2003). "Gifted Education Policy 114" (PDF).
- ↑ Pennsylvania General Assembly, Taxpayer Relief Act, Act 1 of the Special Session of 2006, June 27, 2006
- ↑ Pennsylvania Department of Education (2013). "Investing in Pennsylvania Students".
- ↑ "Salisbury Township School District Payroll report 2012". OpenPA Gov.org. 2013.
- ↑ Asbury Park Press (2009). "PA. Public School Salaries".
- ↑ Salisbury Township School Board (2010). "Salisbury Township School District Teacher Union Employment Contract 2010".
- ↑ Patrick Lester, Salisbury, teachers agree to four-year Contract, The Morning Call, September 27, 2011
- ↑ "Testimony of Jeffery T. Sultanik, Esquire Before the GOP Policy Committee" (PDF). March 25, 2010.
- ↑ Fenton, Jacob., Pennsylvania School District Data: Will School Consolidation Save Money?, The Morning Call, February 2009
- ↑ Pennsylvania School Board Association (October 2009). "Public School Salaries 11th Annual".
- ↑ Pennsylvania School Association (June 22, 2012). "School Management Salaries Report". School Leader News.
- ↑ Pennsylvania Department of Education (2010). "2009-10 Selected Data - 2009-10 Total Expenditures per ADM".
- ↑ US Census Bureau, States Ranked According to Per Pupil Public Elementary-Secondary School System Finance Amounts: Fiscal Year 2011, May 2013
- ↑ US Census Bureau (2009). "Total and current expenditures per pupil in fall enrollment in public elementary and secondary education, by function and state or jurisdiction: 2006-07".
- ↑ US Census Bureau (March 2003). "Public Education Finances 2000-01 Annual Survey of Local Government Finances" (PDF).
- ↑ US Census Bureau (2009). "Total and current expenditures per pupil in fall enrollment in public elementary and secondary education, by function and state or jurisdiction: 2006-07".
- ↑ United States Census Bureau (2009). "States Ranked According to Per Pupil Elementary-Secondary Public School System Finance Amounts: 2008-09" (PDF).
- ↑ US Census Bureau (May 2013). "States Ranked According to Per Pupil Public Elementary-Secondary School System Finance Amounts: Fiscal Year 2011" (PDF).
- ↑ Pennsylvania Department of Education. "Fund Balances by Local Education Agency 1997 to 2008".
- ↑ Murphy, Jan., Pennsylvania's public schools boost reserves, CentreDaily Times, September 22, 2010
- ↑ John Baer (December 9, 2013). "Pa. schools and $$ behind the curtain". Philadelphia Daily News.
- ↑ Melissa Daniels (June 1, 2013). "PA school districts look to cash stash to balance budgets". PA Independent.
- ↑ Pennsylvania Auditor General (June 2013). "Salisbury Township School District Lehigh County, Pennsylvania Performance Audit Report".
- ↑ Pennsylvania Department of Education (May 2012). "Pennsylvania Public School District Tuition Rates".
- ↑ Pennsylvania of Community & Economic Development (2012). "Earned Income Tax".
- ↑ Penn State Cooperative Extension (2010). "What are the Local Taxes in Pennsylvania?, Local Tax Reform Education Project" (PDF).
- ↑ Pennsylvania Department of Revenue (April 2010). "Personal Income Taxation Guidelines".
- ↑ John Finnerty (2013). "PA teachers pensions". CNHI Harrisburg Bureau.
- ↑ Pennsylvania Representative Todd Stephens (January 23, 2014). "LEEF Funding Chart 2014".
- ↑ Democrat Appropriations Committee, Report on Education funding by LEA, July 2, 2013
- ↑ Sam Wood & Brian X. McCrone (January 29, 2014). "Montgomery County lawmaker proposes using Pa. horse racing funds for education". Philadelphia Inquirer.
- ↑ Pennsylvania Office of the Budget, 2013-14 State Budget Highlights, 2013
- ↑ Senator Jake Corman (June 28, 2012). "Pennsylvania Education funding by Local School District" (PDF).
- ↑ Pennsylvania General Assembly Sen Jake Corman (June 29, 2012). "SB1466 of 2012 General Fund Appropriation".
- ↑ PA Senate Appropriations Committee (June 28, 2011). "School District 2011-12 Funding Report".
- ↑ Pennsylvania Department of Education (July 2011). "Basic Education Funding".
- ↑ Pennsylvania Department of Education (June 30, 2011). "Basic Education Funding".
- ↑ Pennsylvania Department of Education (June 30, 2011). "Basic Education Funding 2011-2012 Fiscal Year".
- ↑ Pennsylvania Department of Education, District Allocations Report 2009, 2009-10
- ↑ Pennsylvania House Appropriations Committee (June 30, 2010). "PA Basic Education Funding-Printout2 2010-2011" (PDF).
- ↑ Office of the Budget (February 2010). "Pennsylvania Budget Proposal 2010".
- ↑ Pennsylvania Department of Education (October 2009). "Funding Allocations by district 2009-10".
- ↑ Pennsylvania Office of Budget (February 2009). "Governor's Budget Proposal 2009 Pennsylvania Department of Education Budget Proposal 2009".
- ↑ Pennsylvania Department of Education, Funding Report by LEA, 2009
- ↑ U.S. Census Bureau., Annual Survey of Local Government Finances., 2000
- ↑ U.S. Census Bureau., 2008 Survey of Local Government Finances – School Systems, 2010
- ↑ Pennsylvania Department of Education (2010). "Accountability Block Grant report Grantee list 2010".
- ↑ Pennsylvania Department of Education (2008). "Accountability Block Grant Mid Year report".
- ↑ Pennsylvania Partnership for Children, Full-Day Kindergarten Enrollment, 2011
- ↑ Pennsylvania Auditor General (December 22, 2008). "Classrooms for the Future grants audit" (PDF).
- ↑ Pennsylvania Department of Education Press Office (October 17, 2013). "Acting Secretary of Education Says Hybrid Learning Benefits Students; Highlights Success of First-Year Pilot Program".
- ↑ Commonwealth of Pennsylvania (2009). "County ARRA FUNDING Report".
- ↑ ProPublica (2009). "Recovery Tracker Eye on the stimulus".
- ↑ "School stimulus money". Pittsburgh Post-Gazette. March 12, 2009.
- ↑ Pennsylvania Department of Education, Race To The Top Webinar powerpoint for districts December 2009, December 9, 2009
- ↑ Governor's Press Office release (January 20, 2010). "Pennsylvania's 'Race to the Top' Fueled by Effective Reforms, Strong Local Support,".
- ↑ Race to the Top Fund, U.S. Department of Education, March 29, 2010.
- ↑ Gerald Zahorchak (December 2008). "Pennsylvania Race to the Top Letter to Superintendents" (PDF).
- ↑ Pennsylvania Department of Education (January 19, 2009). "Pennsylvania Race to the Top -School Districts Title I Allocations 2009-10".
- ↑ Pennsylvania Department of Education (2012). "Real Estate Tax Rates by School District 2012-13 Real Estate Mills".
- ↑ Pennsylvania Department of Education (2004). "Act 511 Tax Report".
- ↑ State Tax Equalization Board (2011). "State Tax Equalization Board About US".
- ↑ Pennsylvania Auditor General office - Bureau of Audits (February 2011). "A Special Performance Audit of the Pennsylvania State Tax Equalization Boards" (PDF).
- ↑ Salisbury Township School District Administration (January 16, 2012). "Operations Subcommittee Meeting" (PDF).
- ↑ Salisbury Township School District Business Manager (June 26, 2013). "Salisbury Township School District Budget report 2012-13" (PDF).
- ↑ Lehigh County (February 24, 2012). "Lehigh County reassessment".
- ↑ Lehigh Valley Reassessment Office (2012). "Reassessment Overview" (PDF).
- ↑ Pennsylvania Department of Education, Finances_Real Estate Tax Rates 2012-13, 2012
- ↑ Pennsylvania Department of Education (2011). "Real Estate Tax Millage by School District,".
- ↑ Pennsylvania Department of Education (2010). "Real Estate Tax Millage by School District,".
- ↑ Pennsylvania Department of Education, Financial Elements Reports, 2010
- ↑ Pennsylvania Department of Education, Financial Elements Reports 2008-09 Real Estate Mills, 2009
- ↑ Pennsylvania Department of Education, Real Estate Tax Millage by School District, 2008
- ↑ Pennsylvania Department of Education, Real Estate Tax Millage by School District, 2006
- ↑ Pennsylvania Department of Education, Real Estate Tax Millage by School District, 2005
- ↑ Tax-rates.org., The 2013 Tax Resource County Property Taxes, 2014
- ↑ Pennsylvania Department of Education, Pennsylvania School Finances - Summaries of Annual Financial Report Data 2010-11, 2011
- ↑ New Census Data on Property Taxes on Homeowners, Tax Foundation, September 22, 2009.
- ↑ Pennsylvania Department of Education (2010). "2010-11 Act 1 of 2006 Referendum Exception Guidelines".
- ↑ Kaitlynn Riely (August 4, 2011). "Law could restrict school construction projects". Pittsburgh Post-Gazette.
- ↑ Pennsylvania General Assembly (June 29, 2011). "SB330 of 2011". Retrieved 17 July 2016.
- ↑ Eric Boehm (July 1, 2011). "Property tax reform final piece of state budget". PA Independent.
- ↑ Pennsylvania Department of Education (2011). "Special Session Act 1 of 2006 the Taxpayer Relief Act information".
- ↑ Pennsylvania Department of Education (May 2011). "Special Session Act 1 of 2006 School District Adjusted Index3.9or 2006-2007 through 2011-2012".
- ↑ Pennsylvania Department of Education, 2012-2013 School District Adjusted Index, September 2011
- ↑ Pennsylvania Department of Education, 2013-2014 School District Adjusted Index, September 2012
- ↑ Pennsylvania Department of Education, 2014-2015 School District Adjusted Index, September 2013
- ↑ Pennsylvania Department of Education, Report on Referendum Exceptions For School Year 2013-2014, April 2013
- ↑ Pennsylvania Department of Education, Report on Referendum Exceptions For School Year 2012-2013, March 30, 2012
- ↑ Pennsylvania Department of Education (April 2011). "Report on Exceptions".
- ↑ Pennsylvania Department of Education (May 2010). "Report on Referendum Exceptions for 2010-2011".
- ↑ Pennsylvania Department of Education (May 2009). "Report on Referendum Exceptions for 2009-10".
- ↑ Scarcella, Frank & Pursell, Tricia (May 25, 2010). "Local school tax assessments exceed state averages". The Daily Item.
- ↑ Pennsylvania Department of Education (May 1, 2012). "2012-2013 Estimated State Property Tax Relief per Homestead".
- ↑ Pennsylvania Department of Education (May 1, 2009). "2009 Estimated State Property Tax Relief per Homestead".
- ↑ Pennsylvania Department of Education, Tax Relief per Homestead, May 1, 2009.
- ↑ Tax Relief per Homestead 2009, Pennsylvania Department of Education Report, May 1, 2009
- ↑ Jack Wagner (February 23, 2010). "Property Tax Relief In Pennsylvania: Homeowners Need More Help, Less Hype" (PDF).
- ↑ Penn State College of Agricultural Sciences Cooperative Extension (1998). "Understanding the Homestead and Farmstead Exclusions" (PDF).
- ↑ Elias, Joe., Pennsylvania Treasury Department to issue $238 million in property tax rebates, The Harrisburg Patriot-News, |June 30, 2012
- ↑ Pennsylvania Department of Revenue., Property Tax/Rent Rebate Program, June 2012
- ↑ Pennsylvania Department of Education (January 2010). "School District Enrollment Data and Projections".
- ↑ Pennsylvania Department of Education, Finances by LEA Expenditures2010, 2011
- ↑ Fenton, Jacob., Pennsylvania School District Data: Will School Consolidation Save Money?, The Morning Call, February 2009
- ↑ Pennsylvania Legislative Budget & Finance Committee (2007). "Study of the Cost-Effectiveness of Consolidating Pennsylvania School Districts".
- ↑ Edward Rendell; Governor and Mary Soderberg; Secretary of the Budget (February 2009). "2009–10 Executive Budget Facts Pennsylvania School District Consolidation,".
- ↑ Murphy, Jan, (February 4, 2009). "Rendell calls for consolidation of state school districts". The Patriot News.
- ↑ "Report of the Fiscal Responsibility Task Force" (PDF). Retrieved April 2011. Check date values in:
|access-date=(help) - ↑ Pennsylvania Department of Health, Health Statistics - Resident Live Birth rate by county, 1990
- ↑ Pennsylvania Department of Health, Health Statistics - Resident Live Birth rate by county, 2000
- ↑ Pennsylvania Department of Health, Health Statistics - Resident Live Birth rate by county, 2013
- ↑ Salisbury Township School Board (August 20, 2008). "Policy 123 - Interscholastic Athletics".
- ↑ Salisbury Township School Board (August 20, 2008). "Policy 122 - Extracurricular/Cocurricular Activities".
- ↑ "Salisbury Township School District administration". Turf Project. 2008.
- ↑ Kelly Martin (December 21, 2007). "School district OK's plan to use Artificial Turf". The Morning Call.
- ↑ The Salisbury Synthetic Turf Committee (2009). "Friends of the Falcons Report" (PDF).
- ↑ STSD Operations Subcommittee Meeting, Meeting Minutes, January 16, 2012
- ↑ Pennsylvania Office of the Governor Press Release (November 10, 2005). "Home-Schooled, Charter School Children Can Participate in School District Extracurricular Activities".
- ↑ Pennsylvania Interscholastic Athletics Association (2013). "PIAA School Directory".
External links
Lehigh County, Pennsylvania Schools | |||||||||||||||||||||||||||||||||
|---|---|---|---|---|---|---|---|---|---|---|---|---|---|---|---|---|---|---|---|---|---|---|---|---|---|---|---|---|---|---|---|---|---|
| |||||||||||||||||||||||||||||||||
| |||||||||||||||||||||||||||||||||
Coordinates: 40°35′22″N 75°25′46″W / 40.58951°N 75.42938°W