Salamanca (Spanish Congress electoral district)
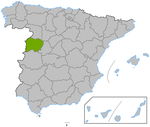
Salamanca is one of the 52 electoral districts (Spanish: circunscripciones) used for the Spanish Congress of Deputies - the lower chamber of the Spanish Parliament, the Cortes Generales. It is one of the nine electoral districts which correspond to the provinces of Castile and León. Salamanca is the largest municipality and at the 2008 election accounted for 156,000 voters out of a total electorate of 351,000. Salamanca was one of only four districts (along with Vizcaya, Burgos and Cuenca) where the electorate fell between 2000 and 2004.
Boundaries and electoral system
Under Article 68 of the Spanish constitution [1] the boundaries must be the same as the province of Salamanca and under Article 140 this can only be altered with the approval of congress. Voting is on the basis of universal suffrage in a secret ballot. The electoral system used is closed list proportional representation with seats allocated using the D'Hondt method. Only lists which poll 3% or more of all valid votes cast, including votes "en blanco" i.e. for "none of the above" can be considered for seats. Under article 12 of the constitution, the minimum voting age is 18.
.svg.png) |
| This article is part of a series on the politics and government of Spain |
|
Related topics |
Eligibility
Article 67.3 of the Spanish Constitution prohibits dual membership of the Cortes and regional assemblies, meaning that candidates must resign from Regional Assemblies if elected. Article 70 also makes active judges, magistrates, public defenders, serving military personnel, active police officers and members of constitutional and electoral tribunals ineligible. [1]
Number of members
Salamanca has returned four members at every election since the restoration of democracy.
Under Spanish electoral law, all provinces are entitled to a minimum of 2 seats with a remaining 248 seats apportioned according to population. [2] These laws are laid out in detail in the 1985 electoral law. (Ley Orgánica del Régimen Electoral General) The practical effect of this has been to overrepreseent smaller provinces like Salamanca at the expense of larger provinces. Salamanca had a ratio of 78,106 voters per deputy in 2004 [3] a figure below the Spanish average of 98,777 voters per deputy. [4]
Summary of seats won 1977–2008
| 1977 | 1979 | 1982 | 1986 | 1989 | 1993 | 1996 | 2000 | 2004 | 2008 | 2011 | |
|---|---|---|---|---|---|---|---|---|---|---|---|
| Democratic Centre Union (UCD) | 3 | 3 | |||||||||
| Spanish Socialist Workers' Party (PSOE) | 1 | 1 | 3 | 2 | 2 | 2 | 1 | 1 | 2 | 2 | 1 |
| People's Party (PP) | 1 | 1 | 2 | 2 | 3 | 3 | 2 | 2 | 3 | ||
| Democratic and Social Centre (CDS) | 1 | ||||||||||
Seats shown for the Peoples Party include seats won by their predecessors the Popular Alliance in 1982 and the Popular Coalition in 1986.
Vote share summary 1977–2008
| 1977 | 1979 | 1982 | 1986 | 1989 | 1993 | 1996 | 2000 | 2004 | 2008 | 2011 | |
|---|---|---|---|---|---|---|---|---|---|---|---|
| Democratic Centre Union (UCD) | 56.1 | 53.5 | 13.7 | ||||||||
| Spanish Socialist Workers' Party (PSOE) | 22.8 | 26.6 | 46.0 | 38.7 | 37.0 | 37.3 | 35.0 | 32.7 | 39.8 | 40.0 | 26.2 |
| People's Party (PP) | 7.9 | 7.7 | 29.7 | 35.8 | 40.7 | 48.6 | 54.1 | 58.5 | 54.3 | 53.8 | 60.0 |
| Popular Socialist Party (PSP) | 6.2 | ||||||||||
| United Left (IU) | 2.9 | 4.0 | 1.2 | 1.9 | 5.7 | 6.7 | 8.1 | 3.7 | 2.0 | 1.7 | 4.3 |
| Independent | 3.1 | 4.0 | |||||||||
| Democratic and Social Centre (CDS) | 3.8 | 18.3 | 12.5 | 3.9 | 0.3 | 0.2 | 0.2 | ||||
| Union, Progress and Democracy | 4.3 | ||||||||||
Only parties or coalitions which polled more than 3%, the threshold for winning seats, are shown above. Results for the Peoples Party include the results of their predecessors the Popular Alliance in 1982 and the Popular Coalition in 1986. Others shows the votes won by an Independent countryside candidate in 1979 and the Agrarian Electoral Bloc in 1982. Votes shown for United Left before 1986 are those for the Communist Party of Spain.
Results
Although the PSOE topped the poll in their two best elections in 1982 and 1986, Salamanca has generally favoured the parties of the centre right who have topped the poll at every other election since the restoration of democracy. In 2004, PP led by 12% in Salamanca municipality - a figure quite close to the average.
2008 General Election
Summary of the 11 March 2008 Congress of Deputies election results in Salamanca.
| Parties and alliances | Votes | % | Seats | Members elected |
|---|---|---|---|---|
| People's Party (Partido Popular) | 127,130 | 53.78 | 2 | |
| Spanish Socialist Workers' Party (Partido Socialista Obrero Español) | 94,474 | 39.96 | 2 | |
| United Left | 4,085 | 1.73 | 0 | |
| Union, Progress and Democracy | 4,083 | 1.73 | 0 | |
| Others | 3,708 | 1.6 | 0 |
2004 General Election
Summary of the 14 March 2004 Congress of Deputies election results in Salamanca.
| Parties and alliances | Votes | % | Seats | Members elected |
|---|---|---|---|---|
| People's Party (Partido Popular) | 128,932 | 54.25 | 2 | |
| Spanish Socialist Workers' Party (Partido Socialista Obrero Español) | 94,655 | 39.83 | 2 | |
| United Left | 4,713 | 1.98 | 0 | |
| Others | 4,661 | 1.95 | 0 |
Source: [5]
2000 General Election
Summary of the 12 March 2000 Congress of Deputies election results in Salamanca.
| Parties and alliances | Votes | % | Seats | Members elected |
|---|---|---|---|---|
| People's Party (Partido Popular) | 130,360 | 58.52 | 3 | |
| Spanish Socialist Workers' Party (Partido Socialista Obrero Español) | 72,769 | 32.67 | 1 | |
| United Left | 8,195 | 3.68 | 0 | |
| Others | 6,811 | 3.10 | 0 |
External links
References
- 1 2 Spanish Constitution
- ↑ General features of Spanish electoral system
- ↑ Salamanca election result 2004
- ↑ 2004 Spanish election
- ↑ Interior ministry link to election results