Richland, Oregon
| Richland, Oregon | |
|---|---|
| City | |
|
Main Street | |
 Location in Oregon | |
| Coordinates: 44°46′7″N 117°10′7″W / 44.76861°N 117.16861°WCoordinates: 44°46′7″N 117°10′7″W / 44.76861°N 117.16861°W | |
| Country | United States |
| State | Oregon |
| County | Baker |
| Incorporated | 1917 |
| Government | |
| • Mayor | Gloria Wilson |
| Area[1] | |
| • Total | 0.08 sq mi (0.21 km2) |
| • Land | 0.08 sq mi (0.21 km2) |
| • Water | 0 sq mi (0 km2) |
| Elevation | 2,231 ft (680 m) |
| Population (2010)[2] | |
| • Total | 156 |
| • Estimate (2012[3]) | 154 |
| • Density | 1,950.0/sq mi (752.9/km2) |
| Time zone | Pacific (UTC-8) |
| • Summer (DST) | Pacific (UTC-7) |
| ZIP code | 97870 |
| Area code(s) | 541 |
| FIPS code | 41-61700[4] |
| GNIS feature ID | 1148423[5] |

Richland is a city in Baker County, Oregon, United States. The population was 156 at the 2010 census.
History
Richland was platted in 1897 and replaced New Bridge as the primary rural service center in the area.[6]
Geography
Richland is along Oregon Route 86 between Baker City and Oxbow on the Oregon–Idaho border.
According to the United States Census Bureau, the city has a total area of 0.08 square miles (0.21 km2), all of it land.[1]
Climate
According to the Köppen Climate Classification system, Richland has a dry, hot summer humid continental climate, abbreviated "Dsa" on climate maps.
| Climate data for Richland | |||||||||||||
|---|---|---|---|---|---|---|---|---|---|---|---|---|---|
| Month | Jan | Feb | Mar | Apr | May | Jun | Jul | Aug | Sep | Oct | Nov | Dec | Year |
| Record high °F (°C) | 62 (17) |
76 (24) |
85 (29) |
92 (33) |
98 (37) |
105 (41) |
111 (44) |
109 (43) |
105 (41) |
92 (33) |
78 (26) |
65 (18) |
111 (44) |
| Average high °F (°C) | 38.1 (3.4) |
45.7 (7.6) |
55.2 (12.9) |
65.4 (18.6) |
74.1 (23.4) |
82.4 (28) |
92.3 (33.5) |
91.2 (32.9) |
81.4 (27.4) |
68 (20) |
50.7 (10.4) |
40.4 (4.7) |
65.4 (18.6) |
| Average low °F (°C) | 19.7 (−6.8) |
24.5 (−4.2) |
28.8 (−1.8) |
33.5 (0.8) |
40.6 (4.8) |
47.1 (8.4) |
52.8 (11.6) |
50.7 (10.4) |
42 (6) |
33.1 (0.6) |
26.6 (−3) |
21.9 (−5.6) |
35.1 (1.7) |
| Record low °F (°C) | −27 (−33) |
−26 (−32) |
−9 (−23) |
13 (−11) |
12 (−11) |
19 (−7) |
25 (−4) |
31 (−1) |
18 (−8) |
6 (−14) |
−7 (−22) |
−22 (−30) |
−27 (−33) |
| Average precipitation inches (mm) | 1.27 (32.3) |
0.85 (21.6) |
0.81 (20.6) |
0.9 (23) |
1.33 (33.8) |
1.03 (26.2) |
0.39 (9.9) |
0.54 (13.7) |
0.54 (13.7) |
0.72 (18.3) |
1.27 (32.3) |
1.3 (33) |
10.95 (278.1) |
| Average snowfall inches (cm) | 6.4 (16.3) |
2.7 (6.9) |
0.7 (1.8) |
0.2 (0.5) |
0 (0) |
0 (0) |
0 (0) |
0 (0) |
0 (0) |
0.1 (0.3) |
2.1 (5.3) |
5.1 (13) |
17.4 (44.2) |
| Average precipitation days | 7 | 5 | 5 | 5 | 6 | 5 | 2 | 3 | 3 | 5 | 7 | 7 | 60 |
| Source: [7] | |||||||||||||
Demographics
| Historical population | |||
|---|---|---|---|
| Census | Pop. | %± | |
| 1910 | 334 | — | |
| 1920 | 244 | −26.9% | |
| 1930 | 212 | −13.1% | |
| 1940 | 254 | 19.8% | |
| 1950 | 220 | −13.4% | |
| 1960 | 228 | 3.6% | |
| 1970 | 133 | −41.7% | |
| 1980 | 181 | 36.1% | |
| 1990 | 161 | −11.0% | |
| 2000 | 147 | −8.7% | |
| 2010 | 156 | 6.1% | |
| Est. 2015 | 176 | [8] | 12.8% |
2010 census
As of the census[2] of 2010, there were 156 people, 93 households, and 46 families residing in the city. The population density was 1,950.0 inhabitants per square mile (752.9/km2). There were 116 housing units at an average density of 1,450.0 per square mile (559.8/km2). The racial makeup of the city was 94.9% White, 1.3% African American, 1.3% Native American, and 2.6% from two or more races. No people from Richland reported as Asian or Hispanic or Latino of any race.
There were 93 households of which 2.2% had children under the age of 18 living with them, 48.4% were married couples living together, 1.1% had a female householder with no husband present, and 50.5% were non-families. 38.7% of all households were made up of individuals and 23.6% had someone living alone who was 65 years of age or older. The average household size was 1.68 and the average family size was 2.11.
The median age in the city was 64.4 years. 1.9% of residents were under the age of 18; 2.4% were between the ages of 18 and 24; 7% were from 25 to 44; 40.4% were from 45 to 64; and 48.1% were 65 years of age or older. The gender makeup of the city was 50.6% male and 49.4% female.
2000 census


As of the census[4] of 2000, there were 147 people, 86 households, and 41 families residing in the city. The population density was 1,849.1 people per square mile (709.5/km²). There were 121 housing units at an average density of 1,522.0 per square mile (584.0/km²). The racial makeup of the city was 97.28% White, 0.68% Native American, 0.68% Asian, and 1.36% from two or more races. Hispanic or Latino of any race were 0.68% of the population.
There were 86 households out of which 7.0% had children under the age of 18 living with them, 41.9% were married couples living together, 5.8% had a female householder with no husband present, and 51.2% were non-families. 45.3% of all households were made up of individuals and 29.1% had someone living alone who was 65 years of age or older. The average household size was 1.71 and the average family size was 2.31.
In the city the population was spread out with 8.2% under the age of 18, 1.4% from 18 to 24, 8.8% from 25 to 44, 35.4% from 45 to 64, and 46.3% who were 65 years of age or older. The median age was 63 years. For every 100 females there were 93.4 males. For every 100 females age 18 and over, there were 98.5 males.
The median income for a household in the city was $17,344, and the median income for a family was $27,500. Males had a median income of $25,000 versus $19,688 for females. The per capita income for the city was $13,462. There were 11.4% of families and 18.4% of the population living below the poverty line, including 37.5% of under eighteens and 13.0% of those over 64.
References
- 1 2 "US Gazetteer files 2010". United States Census Bureau. Archived from the original on January 24, 2012. Retrieved 2012-12-21.
- 1 2 "American FactFinder". United States Census Bureau. Retrieved 2012-12-21.
- ↑ "Population Estimates". United States Census Bureau. Archived from the original on June 17, 2013. Retrieved 2013-06-02.
- 1 2 "American FactFinder". United States Census Bureau. Retrieved 2008-01-31.
- ↑ "US Board on Geographic Names". United States Geological Survey. 2007-10-25. Retrieved 2008-01-31.
- ↑ Bailey, Barbara Ruth (1982). Main Street: Northeastern Oregon. Oregon Historical Society. p. 53. ISBN 0-87595-073-6.
- ↑ "RICHLAND, OR (357160)". Western Regional Climate Center. Retrieved November 26, 2015.
- ↑ "Annual Estimates of the Resident Population for Incorporated Places: April 1, 2010 to July 1, 2015". Retrieved July 2, 2016.
- ↑ "Census of Population and Housing". Census.gov. Archived from the original on May 11, 2015. Retrieved June 4, 2015.
External links
- Listing for Richland in the Oregon Blue Book
-
 Media related to Richland, Oregon at Wikimedia Commons
Municipalities and communities of Baker County, Oregon, United States | ||
|---|---|---|
| Cities | 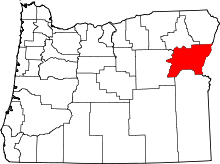 | |
| Unincorporated communities | ||
| Ghost towns | ||