Results of the New Zealand voting system referendum, 2011
| |||||
| Part A Should New Zealand keep the Mixed Member Proportional (MMP) voting system? | |||||
| Yes | No | ||||
| Response | Keep the MMP voting system | Change to another voting system | |||
| Votes | 1,267,955 | 926,819 | |||
| Percentage | 57.77% | 42.23% | |||
| Swinga | |
| |||
| | |||||
| Part B If New Zealand were to change to another voting system, which voting system would you choose? | |||||
| Option 1 | Option 2 | ||||
| Response | First Past the Post (FPP) | Preferential Voting (PV) | |||
| Votes | 704,117 | 188,164 | |||
| Percentage | 46.66% | 12.47% | |||
| Option 3 | Option 4 | ||||
| Response | Single Transferable Vote (STV) | Supplementary Member (SM) | |||
| Votes | 252,503 | 364,373 | |||
| Percentage | 16.73% | 24.14% | |||
| | |||||
| ^a Swing is from the 1993 referendum result | |||||
The New Zealand voting system referendum, 2011 is a referendum being held to decide whether to retain the existing mixed member proportional (MMP) voting system, or to change to another voting system, in electing Members of Parliament to New Zealand's House of Representatives.[1] It will be held in conjunction with the 2011 general election,[2][3] which is set down to be held on Saturday 26 November 2011.
The questions being asked are:
Part A
Should New Zealand keep the Mixed Member Proportional (MMP) voting system?
- I vote to keep the MMP voting system
- I vote to change to another voting system
Part B
If New Zealand were to change to another voting system, which voting system would you choose?
- I would choose the First Past the Post system (FPP)
- I would choose the Preferential Voting system (PV)
- I would choose the Single Transferable Vote system (STV)
- I would choose the Supplementary Member system (SM)[4]
Advance votes (votes cast before election day) will be progressively released after polling closes at 7:00pm on 26 November (NZDT; UTC+13). Official results for the referendum will be released on 10 December 2011.[5]
Overview
Part A
| Response | Votes | % | |
|---|---|---|---|
| valid | total | ||
| I vote to keep the MMP voting system | 1,267,955 | 57.77 | 56.17 |
| I vote to change to another voting system | 926,819 | 42.23 | 41.06 |
| Total valid votes | 2,194,774 | 100.00 | 97.23 |
| Informal votes | 62,469 | – | 2.77 |
| Total votes | 2,257,243 | – | 100.00 |
| Turnout | 73.51% | ||
| Electorate | 3,070,847[7] | ||
| Keep 1,267,955 (57.77%) |
Change 926,819 (42.23%) | |||
| ▲ | ||||
Part B
| Response | Votes | % | |
|---|---|---|---|
| valid | total | ||
| First Past the Post (FPP) I would choose the First Past the Post system (FPP) | 704,117 | 46.66 | 31.19 |
| Preferential Voting (PV) I would choose the Preferential Voting system (PV) | 188,164 | 12.47 | 8.34 |
| Single Transferable Vote (STV) I would choose the Single Transferable Vote system (STV) | 252,503 | 16.3 | 11.19 |
| Supplementary Member (SM) I would choose the Supplementary Member system (SM) | 364,373 | 24.14 | 16.14 |
| Total valid votes | 1,509,157 | 100.00 | 66.86 |
| Informal votes | 748,086 | – | 33.14 |
| Total votes cast | 2,257,243 | – | 100.00 |
| Turnout | 73.51% | ||
| Electorate | 3,070,847[7] | ||
By electorate
Part A
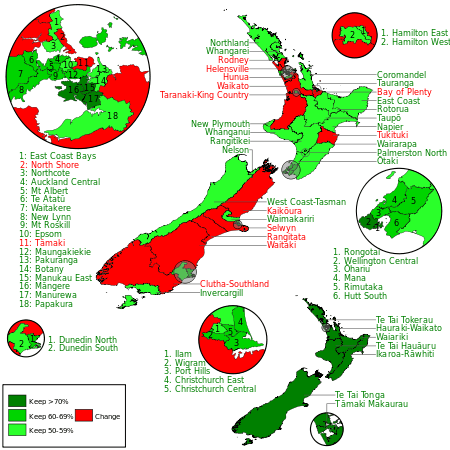
| # | Electorate name | Keep (%) |
Keep (num) |
Change (%) |
Change (num) |
Informal (num) |
Total votes |
|---|---|---|---|---|---|---|---|
| 01 | Auckland Central | 65.8% | 22,027 | 34.2% | 11,539 | 595 | 34,341 |
| 02 | Bay of Plenty | 49.5% | 17,431 | 50.5% | 17,812 | 1,167 | 36,410 |
| 03 | Botany | 55.4% | 15,683 | 44.6% | 12,631 | 902 | 29,216 |
| 04 | Christchurch Central | 62.5% | 17,106 | 37.5% | 10,278 | 835 | 28,219 |
| 05 | Christchurch East | 60.6% | 16,972 | 39.8% | 11,210 | 785 | 28,967 |
| 06 | Clutha-Southland | 44.6% | 13,858 | 55.4% | 17,202 | 976 | 32,306 |
| 07 | Coromandel | 50.3% | 16,884 | 49.7% | 16,703 | 1,193 | 34,780 |
| 08 | Dunedin North | 68.7% | 20,274 | 31.3% | 9,232 | 646 | 30,152 |
| 09 | Dunedin South | 59.4% | 20,510 | 40.6% | 14,019 | 1,061 | 35,590 |
| 10 | East Coast | 55.3% | 16,122 | 44.7% | 13,047 | 935 | 30,104 |
| 11 | East Coast Bays | 51.3% | 16,846 | 48.7% | 16,015 | 811 | 33,672 |
| 12 | Epsom | 50.1% | 18,129 | 49.9% | 18,028 | 765 | 36,922 |
| 13 | Hamilton East | 59.4% | 19,354 | 40.6% | 13,222 | 961 | 33,537 |
| 14 | Hamilton West | 57.8% | 18,138 | 42.2% | 13,231 | 960 | 32,329 |
| 15 | Helensville | 46.6% | 16,376 | 53.4% | 18,780 | 868 | 36,024 |
| 16 | Hunua | 46.4% | 16,066 | 53.6% | 18,573 | 997 | 35,636 |
| 17 | Hutt South | 63.3% | 20,544 | 36.7% | 11,921 | 713 | 33,178 |
| 18 | Ilam | 54.4% | 18,241 | 45.6% | 15,303 | 830 | 34,374 |
| 19 | Invercargill | 50.8% | 16,145 | 49.2% | 15,629 | 947 | 32,721 |
| 20 | Kaikōura | 49.6% | 16,583 | 50.4% | 16,834 | 997 | 34,414 |
| 21 | Mana | 65.2% | 22,159 | 34.8% | 11,815 | 828 | 34,802 |
| 22 | Māngere | 76.7% | 18,847 | 23.3% | 5,729 | 964 | 25,540 |
| 23 | Manukau East | 73.7% | 19,374 | 26.3% | 6,908 | 1,221 | 27,503 |
| 24 | Manurewa | 70.4% | 17,306 | 29.6% | 7,273 | 1,155 | 25,734 |
| 25 | Maungakiekie | 63.1% | 20,876 | 36.9% | 12,233 | 925 | 34,304 |
| 26 | Mount Albert | 67.8% | 21,943 | 32.2% | 10,441 | 877 | 33,261 |
| 27 | Mount Roskill | 66.6% | 21,045 | 33.4% | 10,545 | 1,112 | 32,702 |
| 28 | Napier | 51.4% | 17,052 | 48.6% | 16,122 | 1,052 | 34,226 |
| 29 | Nelson | 58.6% | 20,259 | 41.4% | 14,336 | 952 | 35,547 |
| 30 | New Lynn | 64.3% | 21,189 | 35.7% | 11,756 | 1,033 | 33,978 |
| 31 | New Plymouth | 52.8% | 17,490 | 47.2% | 15,629 | 1,051 | 34,170 |
| 32 | North Shore | 49.4% | 17,985 | 50.6% | 18,415 | 909 | 37,309 |
| 33 | Northcote | 57.7% | 18,718 | 42.3% | 13,728 | 755 | 33,201 |
| 34 | Northland | 52.0% | 16,696 | 48.0% | 15,411 | 1,006 | 33,113 |
| 35 | Ōhariu | 62.0% | 23,148 | 38.0% | 14,181 | 630 | 37,959 |
| 36 | Ōtaki | 54.6% | 20,106 | 45.4% | 16,730 | 1,106 | 37,942 |
| 37 | Pakuranga | 51.1% | 16,302 | 48.9% | 15,576 | 944 | 32,822 |
| 38 | Palmerston North | 61.1% | 19,822 | 38.9% | 12,639 | 824 | 33,285 |
| 39 | Papakura | 52.6% | 16,240 | 47.4% | 14,623 | 966 | 31,859 |
| 40 | Port Hills | 62.5% | 20,442 | 37.5% | 12,241 | 780 | 33,463 |
| 41 | Rangitata | 48.3% | 51.7% | ||||
| 42 | Rangitīkei | 50.7% | 49.3% | ||||
| 43 | Rimutaka | 60.1% | 39.9% | ||||
| 44 | Rodney | 46.4% | 53.6% | ||||
| 45 | Rongotai | 72.9% | 27.1% | ||||
| 46 | Rotorua | 56.6% | 43.4% | ||||
| 47 | Selwyn | 49.4% | 50.6% | ||||
| 48 | Tāmaki | 47.3% | 52.7% | ||||
| 49 | Taranaki-King Country | 46.7% | 53.3% | ||||
| 50 | Taupō | 50.5% | 49.5% | ||||
| 51 | Tauranga | 51.5% | 48.5% | ||||
| 52 | Te Atatū | 62.1% | 37.9% | ||||
| 53 | Tukituki | 49.8% | 50.2% | ||||
| 54 | Waikato | 47.6% | 52.4% | ||||
| 55 | Waimakariri | 51.1% | 48.9% | ||||
| 56 | Wairarapa | 50.5% | 49.5% | ||||
| 57 | Waitakere | 62.8% | 37.2% | ||||
| 58 | Waitaki | 47.6% | 52.4% | ||||
| 59 | Wellington Central | 70.9% | 29.1% | ||||
| 60 | West Coast-Tasman | 53.3% | 46.7% | ||||
| 61 | Whanganui | 54.1% | 45.9% | ||||
| 62 | Whangarei | 52.8% | 47.2% | ||||
| 63 | Wigram | 61.1% | 38.9% | ||||
| 64 | Hauraki-Waikato | 82.1% | 14,731 | 17.9% | 3,202 | 454 | 18,387 |
| 65 | Ikaroa-Rawhiti | 84.2% | 15,347 | 15.8% | 2,883 | 454 | 18,684 |
| 66 | Tāmaki Makaurau | 83.0% | 15,371 | 17.0% | 3,158 | 422 | 18,951 |
| 67 | Te Tai Hauāuru | 82.9% | 15,166 | 17.1% | 3,120 | 410 | 18,696 |
| 68 | Te Tai Tokerau | 82.8% | 16,127 | 17.2% | 3,355 | 457 | 19,939 |
| 69 | Te Tai Tonga | 78.9% | 13,863 | 21.1% | 3,699 | 379 | 17,941 |
| 70 | Waiariki | 85.5% | 15,931 | 14.5% | 2,708 | 416 | 19,055 |
| Total | 57.7% | 1,267,955 | 42.2% | 926,819 | 62,469 | 2,257,243 |
Part B
| Electorate | FPP (%) | FPP (num) | PV (%) | PV (num) | STV (%) | STV (num) | SM (%) | SM (num) | Invalid/blank | Total votes | Turnout (%) |
|---|---|---|---|---|---|---|---|---|---|---|---|
| Total | |||||||||||
| Auckland Central | |||||||||||
| Bay of Plenty | |||||||||||
| Botany | |||||||||||
| Christchurch Central | |||||||||||
| Christchurch East | |||||||||||
| Clutha-Southland | |||||||||||
| Coromandel | |||||||||||
| Dunedin North | |||||||||||
| Dunedin South | |||||||||||
| East Coast | |||||||||||
| East Coast Bays | |||||||||||
| Epsom | |||||||||||
| Hamilton East | |||||||||||
| Hamilton West | |||||||||||
| Helensville | |||||||||||
| Hunua | |||||||||||
| Hutt South | |||||||||||
| Ilam | |||||||||||
| Invercargill | |||||||||||
| Kaikōura | |||||||||||
| Mana | |||||||||||
| Māngere | |||||||||||
| Manukau East | |||||||||||
| Manurewa | |||||||||||
| Maungakikie | |||||||||||
| Mount Albert | |||||||||||
| Mount Roskill | |||||||||||
| Napier | |||||||||||
| Nelson | |||||||||||
| New Lynn | |||||||||||
| New Plymouth | |||||||||||
| North Shore | |||||||||||
| Northcote | |||||||||||
| Northland | |||||||||||
| Ōhariu | |||||||||||
| Ōtaki | |||||||||||
| Pakuranga | |||||||||||
| Palmerston North | |||||||||||
| Papakura | |||||||||||
| Port Hills | |||||||||||
| Rangitata | |||||||||||
| Rangitīkei | |||||||||||
| Rimutaka | |||||||||||
| Rodney | |||||||||||
| Rongotai | |||||||||||
| Rotorua | |||||||||||
| Selwyn | |||||||||||
| Tāmaki | |||||||||||
| Taranaki-King Country | |||||||||||
| Taupō | |||||||||||
| Tauranga | |||||||||||
| Te Atatū | |||||||||||
| Tukituki | |||||||||||
| Waikato | |||||||||||
| Waimakariri | |||||||||||
| Wairarapa | |||||||||||
| Waitakere | |||||||||||
| Waitaki | |||||||||||
| Wellington Central | |||||||||||
| West Coast-Tasman | |||||||||||
| Whanganui | |||||||||||
| Whangarei | |||||||||||
| Wigram | |||||||||||
| Hauraki-Waikato | |||||||||||
| Ikaroa-Rāwhiti | |||||||||||
| Tāmaki Makaurau | |||||||||||
| Te Tai Hauāuru | |||||||||||
| Te Tai Tokerau | |||||||||||
| Te Tai Tonga | |||||||||||
| Waiariki |
References
- ↑ "Labour would not support MMP referendum - Clark". The Dominion Post. 8 May 2008. Retrieved 17 July 2009.
- ↑ "Cabinet preparing for MMP referendum: Key". The New Zealand Herald. 7 September 2009.
- ↑ "MMP referendum to be held with 2011 election". The New Zealand Herald. 20 October 2009.
- ↑ "Ministry of Justice FAQ". Minister of Justice (New Zealand). Retrieved 24 January 2010.
- ↑ "2011 GENERAL ELECTION AND REFERENDUM TIMETABLE". Elections New Zealand. Retrieved 6 May 2011.
- 1 2 "2011 Referendum on the Voting System Preliminary Results for Advance Votes". Electoral Commission. Retrieved 10 December 2011.
- 1 2 "Enrolment statistics for the whole of New Zealand". Electoral Commission. 26 November 2011. Retrieved 10 December 2011.
External links
- electionresults.govt.nz - Referendum results