Quinn, South Dakota
| Quinn, South Dakota | |
|---|---|
| Town | |
|
Man in his "claim shack" on his homestead claim, Quinn, circa 1905 | |
 Location in Pennington County and the state of South Dakota | |
| Coordinates: 43°59′15″N 102°7′38″W / 43.98750°N 102.12722°WCoordinates: 43°59′15″N 102°7′38″W / 43.98750°N 102.12722°W | |
| Country | United States |
| State | South Dakota |
| County | Pennington |
| Founded | 1907[1] |
| Incorporated | 1920[2] |
| Area[3] | |
| • Total | 1.16 sq mi (3.00 km2) |
| • Land | 1.16 sq mi (3.00 km2) |
| • Water | 0 sq mi (0 km2) |
| Elevation | 2,612 ft (796 m) |
| Population (2010)[4] | |
| • Total | 54 |
| • Estimate (2013[5]) | 57 |
| • Density | 46.6/sq mi (18.0/km2) |
| Time zone | Mountain (MST) (UTC-7) |
| • Summer (DST) | MDT (UTC-6) |
| ZIP code | 57775 |
| Area code(s) | 605 |
| FIPS code | 46-52500[6] |
| GNIS feature ID | 1262249[7] |

Quinn is a town in Pennington County, South Dakota, United States. The population was 54 at the 2010 census. The town is the home of the Badlands Observatory.
History
Quinn was laid out in 1907.[8] The town was named for Michael Quinn, a local rancher.[9] A post office called Quinn has been in operation since 1907.[10]
Geography
Quinn is located at 43°59′15″N 102°07′38″W / 43.987562°N 102.127109°W.[11]
According to the United States Census Bureau, the town has a total area of 1.16 square miles (3.00 km2), all of it land.[3]
Quinn has been assigned the ZIP code 57775 and the FIPS place code 52500.
Climate
| Month | Jan | Feb | Mar | Apr | May | Jun | Jul | Aug | Sep | Oct | Nov | Dec | Year |
|---|---|---|---|---|---|---|---|---|---|---|---|---|---|
| Record high °F (°C) | 73 (23) |
75 (24) |
88 (31) |
95 (35) |
105 (41) |
114 (46) |
117 (47) |
113 (45) |
108 (42) |
98 (37) |
85 (29) |
77 (25) |
117 (47) |
| Average high °F (°C) | 35 (2) |
39 (4) |
48 (9) |
60 (16) |
70 (21) |
80 (27) |
90 (32) |
89 (32) |
78 (26) |
64 (18) |
48 (9) |
36 (2) |
90 (32) |
| Daily mean °F (°C) | 22 (−6) |
26 (−3) |
35 (2) |
45 (7) |
56 (13) |
66 (19) |
75 (24) |
73 (23) |
61 (16) |
48 (9) |
34 (1) |
23 (−5) |
47 (8.3) |
| Average low °F (°C) | 9 (−13) |
12 (−11) |
21 (−6) |
30 (−1) |
42 (6) |
52 (11) |
59 (15) |
56 (13) |
44 (7) |
31 (−1) |
19 (−7) |
9 (−13) |
32 (0) |
| Record low °F (°C) | −42 (−41) |
−41 (−41) |
−33 (−36) |
−12 (−24) |
13 (−11) |
30 (−1) |
34 (1) |
27 (−3) |
10 (−12) |
−7 (−22) |
−29 (−34) |
−41 (−41) |
−42 (−41) |
| Average precipitation inches (mm) | 0.37 (9.4) |
0.60 (15.2) |
1.18 (30) |
1.70 (43.2) |
2.83 (71.9) |
2.98 (75.7) |
2.22 (56.4) |
1.46 (37.1) |
1.32 (33.5) |
1.36 (34.5) |
0.64 (16.3) |
0.38 (9.7) |
17.04 (432.9) |
| Source: The Weather Channel[12] | |||||||||||||
Demographics
| Historical population | |||
|---|---|---|---|
| Census | Pop. | %± | |
| 1930 | 141 | — | |
| 1940 | 189 | 34.0% | |
| 1950 | 214 | 13.2% | |
| 1960 | 162 | −24.3% | |
| 1970 | 105 | −35.2% | |
| 1980 | 80 | −23.8% | |
| 1990 | 72 | −10.0% | |
| 2000 | 44 | −38.9% | |
| 2010 | 54 | 22.7% | |
| Est. 2015 | 57 | [13] | 5.6% |
2010 census
As of the census[4] of 2010, there were 54 people, 23 households, and 14 families residing in the town. The population density was 46.6 inhabitants per square mile (18.0/km2). There were 27 housing units at an average density of 23.3 per square mile (9.0/km2). The racial makeup of the town was 85.2% White, 7.4% Native American, 1.9% Asian, 1.9% from other races, and 3.7% from two or more races. Hispanic or Latino of any race were 1.9% of the population.
There were 23 households of which 30.4% had children under the age of 18 living with them, 47.8% were married couples living together, 8.7% had a female householder with no husband present, 4.3% had a male householder with no wife present, and 39.1% were non-families. 30.4% of all households were made up of individuals and 21.7% had someone living alone who was 65 years of age or older. The average household size was 2.35 and the average family size was 3.07.
The median age in the town was 41.5 years. 25.9% of residents were under the age of 18; 5.7% were between the ages of 18 and 24; 24.1% were from 25 to 44; 31.5% were from 45 to 64; and 13% were 65 years of age or older. The gender makeup of the town was 57.4% male and 42.6% female.
2000 census
As of the census[6] of 2000, there were 44 people, 18 households, and 10 families residing in the town. The population density was 45.9 people per square mile (17.7/km2). There were 23 housing units at an average density of 24.0 per square mile (9.3/km2). The racial makeup of the town was 93.18% White and 6.82% Native American.
There were 18 households out of which 44.4% had children under the age of 18 living with them, 61.1% were married couples living together, and 38.9% were non-families. 38.9% of all households were made up of individuals and 22.2% had someone living alone who was 65 years of age or older. The average household size was 2.44 and the average family size was 3.36.
In the town the population was spread out with 34.1% under the age of 18, 29.5% from 25 to 44, 25.0% from 45 to 64, and 11.4% who were 65 years of age or older. The median age was 35 years. For every 100 females there were 69.2 males. For every 100 females age 18 and over, there were 93.3 males.
The median income for a household in the town was $40,750, and the median income for a family was $41,750. Males had a median income of $28,750 versus $22,500 for females. The per capita income for the town was $13,119. None of the population or families were below the poverty line.
References
- ↑ "SD Towns" (PDF). South Dakota State Historical Society. Retrieved 2010-02-15.
- ↑ United States Census Bureau. "Census of Population and Housing". Archived from the original on May 11, 2015. Retrieved June 5, 2014.
- 1 2 "US Gazetteer files 2010". United States Census Bureau. Archived from the original on January 24, 2012. Retrieved 2012-06-21.
- 1 2 "American FactFinder". United States Census Bureau. Retrieved 2012-06-21.
- ↑ "Population Estimates". United States Census Bureau. Retrieved June 5, 2014.
- 1 2 "American FactFinder". United States Census Bureau. Retrieved 2008-01-31.
- ↑ "US Board on Geographic Names". United States Geological Survey. 2007-10-25. Retrieved 2008-01-31.
- ↑ Federal Writers' Project (1940). South Dakota place-names, v.1-3. University of South Dakota. p. 57.
- ↑ Chicago and North Western Railway Company (1908). A History of the Origin of the Place Names Connected with the Chicago & North Western and Chicago, St. Paul, Minneapolis & Omaha Railways. p. 116.
- ↑ "Pennington County". Jim Forte Postal History. Retrieved 26 March 2015.
- ↑ "US Gazetteer files: 2010, 2000, and 1990". United States Census Bureau. 2011-02-12. Retrieved 2011-04-23.
- ↑ "Monthly Averages for Quinn, SD". The Weather Channel. Retrieved June 4, 2014.
- ↑ "Annual Estimates of the Resident Population for Incorporated Places: April 1, 2010 to July 1, 2015". Retrieved July 2, 2016.
- ↑ "Census of Population and Housing". Census.gov. Archived from the original on May 11, 2015. Retrieved June 4, 2015.
Municipalities and communities of Pennington County, South Dakota, United States | ||
|---|---|---|
| Cities | 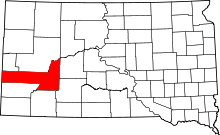 | |
| Towns | ||
| CDPs | ||
| Other unincorporated communities | ||
| Ghost towns | ||
| Footnotes | ‡This populated place also has portions in an adjacent county or counties | |