Pressure system

A pressure system is a relative peak or lull in the sea level pressure distribution. The surface pressure at sea level varies minimally, with the lowest value measured 870.0 hectopascals (25.69 inHg) and the highest recorded 1,085.7 hectopascals (32.06 inHg). High- and low-pressure systems evolve due to interactions of temperature differentials in the atmosphere, temperature differences between the atmosphere and water within oceans and lakes, the influence of upper-level disturbances, as well as the amount of solar heating or radiational cooling an area receives. Pressure systems cause weather experienced locally. Low-pressure systems are associated with clouds and precipitation that minimize temperature changes through the day, whereas high-pressure systems normally associated with dry weather and mostly clear skies with larger diurnal temperature changes due to greater radiation at night and greater sunshine during the day. Pressure systems are analyzed by those in the field of meteorology within surface weather maps.
Low-pressure system
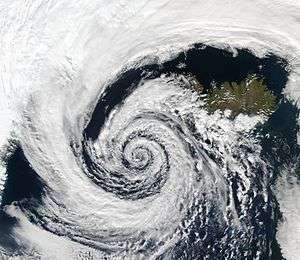
A low-pressure area, or "low", is a region where the atmospheric pressure at sea level is below that of surrounding locations. Low-pressure systems form under areas of wind divergence that occur in upper levels of the troposphere.[1] The formation process of a low-pressure area is known as cyclogenesis.[2] Within the field of atmospheric dynamics, areas of wind divergence aloft occur in two areas:
- on the east side of upper troughs, which form half of a Rossby wave within the Westerlies (a trough with large wavelength, which extends through the troposphere)
- ahead of embedded shortwave troughs, which have smaller wavelengths
Diverging winds aloft ahead of these troughs cause atmospheric lift within the troposphere below, which lowers surface pressures as upward motion partially counteracts the force of gravity.[3]
Thermal lows form due to localized heating caused by greater sunshine over deserts and other land masses. Since localized areas of warm air are less dense than their surroundings, this warmer air rises, which lowers atmospheric pressure near that portion of the Earth's surface.[4] Large-scale thermal lows over continents help create pressure gradients that drive monsoon circulations.[5] Low-pressure areas can also form due to organized thunderstorm activity over warm water.[6] When such an occurrence occurs over the tropics in concert with the Intertropical Convergence Zone, it is known as a monsoon trough.[7] Monsoon troughs reach their northerly extent in August and their southerly extent in February.[8][9][10] When a convective low acquires a well-defined circulation in the tropics it is termed a tropical cyclone.[6] Tropical cyclones can form during any month of the year globally, but can occur in either the northern hemisphere or the southern hemisphere during November.[11]
Atmospheric lift caused by low-level wind convergence into the surface low brings clouds and potentially precipitation.[12] The low-pressure area's cloudy skies act to minimize diurnal temperature extremes. Since clouds reflect sunlight, incoming shortwave solar radiation is less, which causes lower temperatures during the day. At night, the absorptive effect of clouds on outgoing longwave radiation, such as heat energy from the surface, allows for warmer diurnal low temperatures in all seasons. The stronger the area of low pressure the stronger the winds experienced in its vicinity.[13] Around the world, low-pressure systems are most frequently located over the Tibetan Plateau and in the lee of the Rocky mountains.[14] In Europe (in particular, in the United Kingdom), recurring low-pressure weather systems are typically known as depressions. The lowest recorded non-tornadic barometric pressure was 870 hectopascals (26 inHg), occurred in the Western Pacific during Typhoon Tip on 12 October 1979.[15]
High-pressure system

High-pressure systems are frequently associated with light winds at the surface and subsidence through the lower portion of the troposphere. In general, subsidence will dry out an air mass by adiabatic or compressional heating.[17] Thus, high pressure typically brings clear skies.[18] During the day, since no clouds are present to reflect sunlight, there is more incoming shortwave solar radiation and temperatures rise. At night, the absence of clouds means that outgoing longwave radiation (i.e. heat energy from the surface) is not absorbed, giving cooler diurnal low temperatures in all seasons. When surface winds become light, the subsidence produced directly under a high-pressure system can lead to a buildup of particulates in urban areas under the ridge, leading to widespread haze.[19] If the low-level relative humidity rises towards 100 percent overnight, fog can form.[20]
Strong but vertically shallow high-pressure systems moving from higher latitudes to lower latitudes in the northern hemisphere are associated with continental arctic air masses.[21] The low, sharp temperature inversion can lead to areas of persistent stratocumulus or stratus cloud, known in colloquial terms as anticyclonic gloom. The type of weather brought about by an anticyclone depends on its origin. For example, extensions of the Azores high bubble pressure may bring about anticyclonic gloom during the winter, as they are warmed at the base and will trap moisture as they move over the warmer oceans. High pressures that build to the north and extend southwards will often bring clear weather. This is due to being cooled at the base (as opposed to warmed), which helps prevent clouds from forming. The highest barometric pressure ever recorded on Earth was 1,085.7 hectopascals (32.06 inHg) measured in Tonsontsengel, Mongolia on 19 December 2001.[22]
Surface weather maps
A surface weather analysis is a type of weather map that depicts positions for high- and low-pressure areas, as well as various types of synoptic scale systems such as frontal zones. Isotherms can be drawn on these maps, which are lines of equal temperature. Isotherms are drawn normally as solid lines at a preferred temperature interval.[23] They show temperature gradients, which can be useful in finding fronts, which are on the warm side of large temperature gradients. By plotting the freezing line, isotherms can be useful in determination of precipitation type. Mesoscale convective systems such as tropical cyclones, outflow boundaries and squall lines also are analyzed on surface weather analyses.
Isobaric analysis is performed on these maps, which involves the construction of lines of equal mean sea level pressure. The innermost closed lines indicate the positions of relative maxima and minima in the pressure field. The minima are called low-pressure areas, and the maxima are called high-pressure areas. A High is often shown as H, and a low is shown as L. Elongated areas of low pressure, or troughs, are sometimes plotted as thick, brown dashed lines down the trough axis.[24] Isobars are commonly used to place surface boundaries from the horse latitudes poleward, while streamline analyses are used in the tropics.[25] A streamline analysis is a series of arrows oriented parallel to wind, showing wind motion within a certain geographic area. Cs depict cyclonic flow or likely areas of low pressure, while As depict anticyclonic flow or likely positions of high-pressure areas.[26] An area of confluent streamlines shows the location of shearlines within the tropics and subtropics.[27]
References
- ↑ Joel Norris (2005-03-19). "QG Notes" (PDF). University of California, San Diego. Retrieved 2009-10-26.
- ↑ Arctic Climatologyal Snow and Ice Data Center. Retrieved on 2009-02-21.
- ↑ Roger G. Barry and Richard J. Chorley (187). Atmosphere, Weather & Climate (5 ed.). Routledge. pp. 194–199. ISBN 0-415-04585-1.
- ↑ Glossary of Meteorology (June 2000). "Thermal Low". American Meteorological Society. Retrieved 2009-03-02.
- ↑ Mary E. Davis and Lonnie G. Thompson (2005). "Forcing of the Asian monsoon on the Tibetan Plateau: Evidence from high-resolution ice core and tropical coral records" (PDF). Journal of Geophysical Research. 110: 1 of 13. Bibcode:2005JGRD..11004101D. doi:10.1029/2004JD004933.
- 1 2 Atlantic Oceanographic and Meteorological Laboratory, Hurricane Research Division (2004). "Frequently Asked Questions: What is an extra-tropical cyclone?". NOAA. Retrieved 2007-03-23.
- ↑ Glossary of Meteorology (June 2000). "Monsoon trough". American Meteorological Society. Retrieved 2009-06-04.
- ↑ National Centre for Medium Range Forecasting (2004-10-24). "Chapter-II Monsoon-2004: Onset, Advancement and Circulation Features" (PDF). Retrieved 2010-11-23.
- ↑ Australian Broadcasting Corporation (2000). Monsoon. Retrieved on 2008-05-03.
- ↑ U. S. Navy. 1.2 Pacific Ocean Surface Streamline Pattern. Retrieved on 2006-11-26.
- ↑ Atlantic Oceanographic and Meteorological Laboratory, Hurricane Research Division (2010-01-21). "Frequently Asked Questions: When is hurricane season?". National Oceanic and Atmospheric Administration. Retrieved 2010-11-23.
- ↑ Robert Penrose Pearce (2002). Meteorology at the Millennium. Academic Press. p. 66. ISBN 978-0-12-548035-2. Retrieved 2009-01-02.
- ↑ JetStream (2008). Origin of Wind. National Weather Service Southern Region Headquarters. Retrieved on 2009-02-16.
- ↑ L. de la Torre, Nieto R., Noguerol M., Añel J.A., Gimeno L. (2008). A climatology based on reanalysis of baroclinic developmental regions in the extratropical northern hemisphere. Ann New York Academy of Science;vol. 1146: pp. 235-255. Retrieved on 2009-03-02.
- ↑ Chris Landsea (2010-04-21). "Subject: E1), Which is the most intense tropical cyclone on record?". Atlantic Oceanographic and Meteorological Laboratory. Retrieved 2010-11-23.
- ↑ "An Australian "Anti-storm"". NASA. 2012-06-08. Retrieved 2013-02-12.
- ↑ Office of the Federal Coordinator for Metmmmeorology (2006). Appendix G: Glossary. NOAA. Retrieved on 2009-02-16.
- ↑ Jack Williams (2007). What's happening inside highs and lows. USA Today. Retrieved on 2009-02-16.
- ↑ Myanmar government (2007). "Haze". Internet Wayback Machine. Archived from the original on 2008-02-24. Retrieved 2007-02-11.
- ↑ Robert Tardif (2002). Fog characteristics. NCAR National Research Laboratory. Retrieved on 2007-02-11.
- ↑ CBC News (2009). Blame Yukon: Arctic air mass chills rest of North America. Canadian Broadcasting Centre. Retrieved on 2009-02-16.
- ↑ Christopher C. Burt (2004). Extreme Weather (1 ed.). Twin Age Ltd. p. 234. ISBN 0-393-32658-6.
- ↑ DataStreme Atmosphere (2008-04-28). "Air Temperature Patterns". American Meteorological Society. Archived from the original on 2008-05-11. Retrieved 2010-02-07.
- ↑ Edward J. Hopkins, Ph.D. (1996-06-10). "Surface Weather Analysis Chart". University of Wisconsin. Retrieved 2007-05-10.
- ↑ Bureau of Meteorology (2010). "The Weather Map". Commonwealth of Australia. Retrieved 2010-02-06.
- ↑ National Weather Service Forecast Office Honolulu, Hawaii (2010-02-07). "Pacific Streamline Analysis". Pacific Region Headquarters. Retrieved 2010-02-07.
- ↑ David M. Roth (2006-12-14). "Unified Surface Analysis Manual" (PDF). Hydrometeorological Prediction Center. Retrieved 2006-10-22.