Pima County, Arizona
| Pima County, Arizona | ||
|---|---|---|
| ||
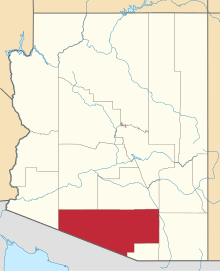 Location in the U.S. state of Arizona | ||
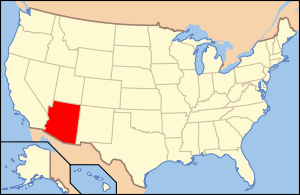 Arizona's location in the U.S. | ||
| Founded | November 9, 1864 | |
| Named for | Pima people | |
| Seat | Tucson | |
| Largest city | Tucson | |
| Area | ||
| • Total | 9,189 sq mi (23,799 km2) | |
| • Land | 9,187 sq mi (23,794 km2) | |
| • Water | 2.1 sq mi (5 km2), 0.02% | |
| Population (est.) | ||
| • (2015) | 1,010,025 | |
| • Density | 109/sq mi (42/km²) | |
| Congressional districts | 1st, 2nd, 3rd | |
| Time zone | Mountain: UTC-7 | |
| Website |
www | |


Pima County /ˈpiːmə/ is a county in the south central region of the U.S. state of Arizona. As of the 2010 census, the population was 980,263,[1] making it the second-most populous county in Arizona. The county seat is Tucson,[2] where nearly all of the population is centered. The county is named after the Pima Native Americans who are indigenous to this area.
Pima County comprises the Tucson, AZ Metropolitan Statistical Area.
Pima County contains parts of the Tohono O'odham Nation, as well as all of the San Xavier Indian Reservation, the Pascua Yaqui Indian Reservation, Organ Pipe Cactus National Monument, Ironwood Forest National Monument and Saguaro National Park.
The vast majority of the county population lies in and around the city of Tucson (2011 city population: 525,796), filling much of the eastern part of the county with urban development. Tucson, Arizona's second largest city, is a major commercial and academic center. Other urban areas include the Tucson suburbs of Oro Valley (population 41,335), Marana (population 35,232), Sahuarita (population 25,458), and South Tucson (population 5,695), a large ring of unincorporated urban development, and the growing satellite town Green Valley. The rest of the county is sparsely populated; the largest towns are Sells, the capital of the Tohono O'odham Nation, and Ajo in the far western region of the county.
History
Pima County, one of the four original counties in Arizona, was created by the 1st Arizona Territorial Legislature with land acquired through the Gadsden Purchase from Mexico in 1853. The original county consisted of all of Arizona Territory east of longitude 113° 20' and south of the Gila River.[3] Soon thereafter, the counties of Cochise, Graham and Santa Cruz were carved from the original Pima County.[4]
Geography
According to the U.S. Census Bureau, the county has a total area of 9,189 square miles (23,800 km2), of which 9,187 square miles (23,790 km2) is land and 2.1 square miles (5.4 km2) (0.02%) is water.[5]
Topographic features
Major highways
.svg.png) Interstate 10
Interstate 10.svg.png) Interstate 19
Interstate 19 State Route 77
 State Route 83
 State Route 85
 State Route 86
 State Route 210
Adjacent counties and municipios
- Yuma County – west
- Maricopa County – north
- Pinal County – north
- Graham County – northeast
- Cochise County – east
- Santa Cruz County – southeast
- Altar, Sonora, Mexico – south
- Caborca, Sonora, Mexico – south
- Plutarco Elías Calles, Sonora, Mexico – south
- Sáric, Sonora, Mexico – south
National protected areas
- Buenos Aires National Wildlife Refuge
- Cabeza Prieta National Wildlife Refuge (part)
- Coronado National Forest (part)
- Ironwood Forest National Monument (part)
- Las Cienegas National Conservation Area (part)
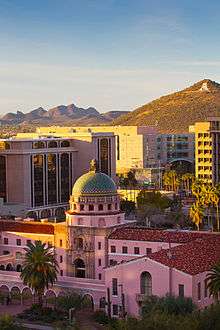 Old Pima County Courthouse
 - Organ Pipe Cactus National Monument
- Saguaro National Park
Sonoran Desert Conservation Plan
The award-winning Sonoran Desert Conservation Plan (SDCP) is Pima County’s plan for balancing the conservation and protection of our cultural and natural resource heritage with our efforts to maintain an economically vigorous and fiscally responsible community. Broadly defined, the SDCP considered the following elements: critical habitats and biological corridors, riparian areas, mountain parks, historical and cultural preservation, and ranch conservation. All five elements, along with fiscal analysis, were critical in forming a viable land management plan for Pima County.
- Sonoran Desert Conservation Plan Information
- Conservation Lands
- Species Protection
- Maps and Publications
- Cultural Resources
Demographics
| Historical population | |||
|---|---|---|---|
| Census | Pop. | %± | |
| 1870 | 5,716 | — | |
| 1880 | 17,006 | 197.5% | |
| 1890 | 12,673 | −25.5% | |
| 1900 | 14,689 | 15.9% | |
| 1910 | 22,818 | 55.3% | |
| 1920 | 34,680 | 52.0% | |
| 1930 | 55,676 | 60.5% | |
| 1940 | 72,838 | 30.8% | |
| 1950 | 141,216 | 93.9% | |
| 1960 | 265,660 | 88.1% | |
| 1970 | 351,667 | 32.4% | |
| 1980 | 531,443 | 51.1% | |
| 1990 | 666,880 | 25.5% | |
| 2000 | 843,746 | 26.5% | |
| 2010 | 980,263 | 16.2% | |
| Est. 2015 | 1,010,025 | [6] | 3.0% |
| U.S. Decennial Census[7] 1790–1960[8] 1900–1990[9] 1990–2000[10] 2010–2015[1] | |||
2000 census
As of the 2000 census, there were 843,746 people, 332,350 households, and 212,039 families residing in the county. The population density was 92 people per square mile (35/km²). There were 366,737 housing units at an average density of 40 per square mile (15/km²). The racial makeup of the county was 75.07% White, 3.03% Black or African American, 3.22% Native American, 2.04% Asian, 0.13% Pacific Islander, 13.30% from other races, and 3.21% from two or more races. 29.34% of the population were Hispanic or Latino of any race. 22.80% reported speaking Spanish at home.[11]
There were 332,350 households out of which 29.20% had children under the age of 18 living with them, 47.70% were married couples living together, 11.80% had a female householder with no husband present, and 36.20% were non-families. 28.50% of all households were made up of individuals and 9.40% had someone living alone who was 65 years of age or older. The average household size was 2.47 and the average family size was 3.06.
In the county the population was spread out with 24.60% under the age of 18, 10.90% from 18 to 24, 28.40% from 25 to 44, 21.90% from 45 to 64, and 14.20% who were 65 years of age or older. The median age was 36 years. For every 100 females there were 95.70 males. For every 100 females age 18 and over, there were 92.70 males.
The median income for a household in the county was $36,758, and the median income for a family was $44,446. Males had a median income of $32,156 versus $24,959 for females. The per capita income for the county was $19,785. About 10.50% of families and 14.70% of the population were below the poverty line, including 19.40% of those under age 18 and 8.20% of those age 65 or over.
2010 census
As of the 2010 United States Census, there were 980,263 people, 388,660 households, and 243,167 families residing in the county.[12] The population density was 106.7 inhabitants per square mile (41.2/km2). There were 440,909 housing units at an average density of 48.0 per square mile (18.5/km2).[13] The racial makeup of the county was 74.3% white, 3.5% black or African American, 3.3% American Indian, 2.6% Asian, 0.2% Pacific islander, 12.3% from other races, and 3.7% from two or more races. Those of Hispanic or Latino origin made up 34.6% of the population.[12] In terms of ancestry, 16.2% were German, 10.6% were Irish, 9.9% were English, and 2.8% were American.[14]
Of the 388,660 households, 29.8% had children under the age of 18 living with them, 44.5% were married couples living together, 12.8% had a female householder with no husband present, 37.4% were non-families, and 29.2% of all households were made up of individuals. The average household size was 2.46 and the average family size was 3.06. The median age was 37.7 years.[12]
The median income for a household in the county was $45,521 and the median income for a family was $57,377. Males had a median income of $42,313 versus $33,487 for females. The per capita income for the county was $25,093. About 11.2% of families and 16.4% of the population were below the poverty line, including 22.6% of those under age 18 and 8.5% of those age 65 or over.[15]
Metropolitan Statistical Area
The United States Office of Management and Budget has designated Pima County as the Tucson, AZ Metropolitan Statistical Area.[16] The United States Census Bureau ranked the Tucson, AZ Metropolitan Statistical Area as the 53rd most populous metropolitan statistical area of the United States as of July 1, 2012.[17]
The Office of Management and Budget has further designated the Tucson, AZ Metropolitan Statistical Area as a component of the more extensive Tucson-Nogales, AZ Combined Statistical Area,[16] the 53rd most populous combined statistical area and the 59th most populous primary statistical area of the United States as of July 1, 2012.[17][18]
Politics
Pima County is governed by a 5-member Board of Supervisors that set ordinances and run services for the areas that do not fall within any city or town jurisdiction.
Districts
The Pima County Board of Supervisors is responsible for steering public policy in the region.
The five-member board provides direction to the County Administrator and the county’s various departments as they work to ensure safe communities, nurture economic development, sustainably manage natural resources and protect public health.
In addition to overseeing the delivery of a host of municipal services, from roads to parks and libraries and law enforcement, board members also are responsible for approving the county budget.
Elected to four-year terms, board members also set the amount of taxes to be levied.
Board of Supervisors
| Party | District | Name | First elected | Area(s) represented | |
|---|---|---|---|---|---|
| Republican | District 1 | Ally Miller | 2012 | Oro Valley, Marana, Catalina Foothills | |
| Democrat | District 2 | Ramon Valadez | Appointed 2003 | Tucson, Sahuarita, South Tucson | |
| Democrat | District 3 | Sharon Bronson | 1996 | Tucson, Marana, Three Points, Sahuarita | |
| Republican | District 4 | Ray Carroll | Appointed 1997 | Tucson, Vail, Summerhaven, Green Valley | |
| Democratic | District 5 | Richard Elias | Appointed 2002 | Tucson, Sahuarita, Green Valley | |
Communities


Cities
- South Tucson
- Tucson (county seat)
Towns
- Marana (Partially in Pinal County)
- Oro Valley
- Sahuarita
Census-designated places
- Ajo
- Ak Chin
- Ali Chuk
- Ali Chukson
- Ali Molina
- Anegam
- Arivaca
- Arivaca Junction
- Avra Valley
- Casas Adobes
- Catalina
- Catalina Foothills
- Chiawuli Tak
- Charco
- Comobabi
- Corona de Tucson
- Cowlic
- Drexel Heights
- Elephant Head
- Flowing Wells
- Green Valley
- Gu Oidak
- Haivana Nakya
- Ko Vaya
- Littletown
- Maish Vaya
- Nelson
- Nolic
- Picture Rocks
- Pimaco Two
- Pisinemo
- Rillito
- Rincon Valley
- San Miguel
- Santa Rosa
- Sells
- South Komelik
- Summerhaven
- Summit
- Tanque Verde
- Three Points
- Topawa
- Tucson Estates
- Vail
- Valencia West
- Ventana
- Wahak Hotrontk
- Why
- Willow Canyon
Indian reservations
- Pascua Yaqui
- San Xavier
- Tohono O'odham (part)
Other communities
County population ranking
The population ranking of the following table is based on the 2010 census of Pima County.[20][21]
† county seat
| Rank | City/Town/etc. | Population (2010 Census) | Municipal type | Incorporated |
|---|---|---|---|---|
| 1 | † Tucson | 520,116 | City | 1775 |
| 2 | Casas Adobes | 66,795 | CDP | |
| 3 | Catalina Foothills | 50,796 | CDP | |
| 4 | Oro Valley | 41,011 | Town | 1974 |
| 5 | Marana | 34,961 | Town | 1977 |
| 6 | Drexel Heights | 27,749 | CDP | |
| 7 | Sahuarita | 25,259 | Town | 1994 |
| 8 | Green Valley | 21,391 | CDP | |
| 9 | Tanque Verde | 16,901 | CDP | |
| 10 | Flowing Wells | 16,419 | CDP | |
| 11 | Tucson Estates | 12,192 | CDP | |
| 12 | Vail | 10,208 | CDP | |
| 13 | Picture Rocks | 9,563 | CDP | |
| 14 | Valencia West | 9,355 | CDP | |
| 15 | Catalina | 7,569 | CDP | |
| 16 | Avra Valley | 6,050 | CDP | |
| 17 | Corona de Tucson | 5,675 | CDP | |
| 18 | South Tucson | 5,652 | City | 1940 |
| 19 | Three Points | 5,581 | CDP | |
| 20 | Summit | 5,372 | CDP | |
| 21 | Rincon Valley | 5,139 | CDP | |
| 22 | Ajo | 3,304 | CDP | |
| 23 | Sells | 2,495 | CDP | |
| 24 | Arivaca Junction | 1,090 | CDP | |
| 25 | Littletown | 873 | CDP | |
| 26 | Arivaca | 695 | CDP | |
| 27 | Pimaco Two | 682 | CDP | |
| 28 | Santa Rosa | 628 | CDP | |
| 29 | Elephant Head | 612 | CDP | |
| 30 | Pisinemo | 321 | CDP | |
| 31 | Topawa | 299 | CDP | |
| 32 | Nelson | 259 | CDP | |
| 33 | San Miguel | 197 | CDP | |
| 34 | Gu Oidak | 188 | CDP | |
| 35 | Why | 167 | CDP | |
| 36 | Ali Chuk | 161 | CDP | |
| 37 | Maish Vaya | 158 | CDP | |
| 38 | Anegam | 151 | CDP | |
| 39 | Cowlic | 135 | CDP | |
| 40 | Ali Chukson | 132 | CDP | |
| 41 | Wahak Hotrontk | 114 | CDP | |
| 42 | South Komelik | 111 | CDP | |
| 43 | Rillito | 97 | CDP | |
| 44 | Haivana Nakya | 96 | CDP | |
| 45 | Chiawuli Tak | 78 | CDP | |
| 46 | Ali Molina | 71 | CDP | |
| 47 | Charco | 52 | CDP | |
| 48 | Ventana | 49 | CDP | |
| 49 | Ko Vaya | 46 | CDP | |
| 50 | Summerhaven | 40 | CDP | |
| 51 | Nolic | 37 | CDP | |
| 52 | Ak Chin | 30 | CDP | |
| 53 | Comobabi | 8 | CDP | |
| 54 | Willow Canyon | 1 | CDP |
Tourist attractions
Yearly Events
- All Souls Procession
- El Tour de Tucson
- Fiesta de los Vaqueros
- Horse Racing
- Mariachi Festival
- Match Play Tournament
- Tucson Meet Yourself
- Pima County Fair
Locations of Interest
- Arizona-Sonora Desert Museum
- Old Tucson Studios
- Arizona Historical Society (museum)
- Tucson Gem & Mineral Show
- Titan Missile Museum
- Pima Air and Space Museum
- Mission San Xavier del Bac
- Kino Sports Complex (featuring Triple-A baseball and professional soccer team exhibitions)
Recreation Attractions
- Search Recreation Destinations
- Filter by destination type, activities or amenities
- The Loop (131 miles of walking and bike trails)
See all recreational items including arts and culture, classes, community centers, outdoor activities, parks and pools, special events, stadiums and hiking/trail maps. Learn more...
See also
| Wikimedia Commons has media related to Pima County, Arizona. |
- National Register of Historic Places listings in Pima County, Arizona
- Pima County Sheriff's Department
- John G.F. Speiden - Jay Six Ranch
- Federal Correctional Complex, Tucson
References
- 1 2 "State & County QuickFacts". United States Census Bureau. Retrieved May 18, 2014.
- ↑ "Find a County". National Association of Counties. Retrieved 2011-06-07.
- ↑ Wagoner, Jay J. (1970). Arizona Territory 1863–1912: A Political history. Tucson: University of Arizona Press. p. 58. ISBN 0-8165-0176-9.
- ↑ "History: Pima County". Pima County Justice Court (jp.pima.gov). September 27, 2000. Retrieved 2009-09-30. External link in
|publisher=(help) - ↑ "2010 Census Gazetteer Files". United States Census Bureau. August 23, 2012. Retrieved August 23, 2015.
- ↑ "County Totals Dataset: Population, Population Change and Estimated Components of Population Change: April 1, 2010 to July 1, 2015". Retrieved July 2, 2016.
- ↑ "U.S. Decennial Census". United States Census Bureau. Retrieved May 18, 2014.
- ↑ "Historical Census Browser". University of Virginia Library. Retrieved May 18, 2014.
- ↑ "Population of Counties by Decennial Census: 1900 to 1990". United States Census Bureau. Retrieved May 18, 2014.
- ↑ "Census 2000 PHC-T-4. Ranking Tables for Counties: 1990 and 2000" (PDF). United States Census Bureau. Retrieved May 18, 2014.
- ↑ "Language Map Data Center". Mla.org. 2013-04-03. Retrieved 2015-10-11.
- 1 2 3 "DP-1 Profile of General Population and Housing Characteristics: 2010 Demographic Profile Data". United States Census Bureau. Retrieved 2016-01-20.
- ↑ "Population, Housing Units, Area, and Density: 2010 - County". United States Census Bureau. Retrieved 2016-01-20.
- ↑ "DP02 SELECTED SOCIAL CHARACTERISTICS IN THE UNITED STATES – 2006-2010 American Community Survey 5-Year Estimates". United States Census Bureau. Retrieved 2016-01-20.
- ↑ "DP03 SELECTED ECONOMIC CHARACTERISTICS – 2006-2010 American Community Survey 5-Year Estimates". United States Census Bureau. Retrieved 2016-01-20.
- 1 2 "OMB Bulletin No. 13-01: Revised Delineations of Metropolitan Statistical Areas, Micropolitan Statistical Areas, and Combined Statistical Areas, and Guidance on Uses of the Delineations of These Areas" (PDF). United States Office of Management and Budget. February 28, 2013. Retrieved March 20, 2013.
- 1 2 "Table 1. Annual Estimates of the Population of Metropolitan and Micropolitan Statistical Areas: April 1, 2010 to July 1, 2012" (CSV). 2012 Population Estimates. United States Census Bureau, Population Division. March 2013. Retrieved March 20, 2013.
- ↑ "Table 2. Annual Estimates of the Population of Combined Statistical Areas: April 1, 2010 to July 1, 2012" (CSV). 2012 Population Estimates. United States Census Bureau, Population Division. March 2013. Retrieved March 20, 2013.
- ↑ "Board of Supervisors - Pima County". Pima.gov. 2013-04-16. Retrieved 2015-10-11.
- ↑ Center for New Media and Promotions(C2PO). "2010 Census". census.gov.
- ↑ Geographic Products Branch. "2010 Census Block Maps - Geography - U.S. Census Bureau". census.gov.
External links
- Official website
 Geographic data related to Pima County, Arizona at OpenStreetMap
- Pima County GIS Maps
- Pima County Government Departments
 |
Maricopa County and Pinal County | Graham County | | |
| Yuma County | |
Cochise County | ||
| ||||
| | ||||
| Altar, Sonora, Mexico; Caborca, Sonora, Mexico; Plutarco Elías Calles, Sonora, Mexico; and Sáric, Sonora, Mexico | Santa Cruz County |
Coordinates: 32°03′55″N 111°49′15″W / 32.06528°N 111.82083°W