Pavillion, Wyoming
| Pavillion, Wyoming | |
|---|---|
| Town | |
 Pavillion, Wyoming Location in the state of Wyoming | |
| Coordinates: 43°14′34″N 108°41′24″W / 43.24278°N 108.69000°WCoordinates: 43°14′34″N 108°41′24″W / 43.24278°N 108.69000°W | |
| Country | United States |
| State | Wyoming |
| County | Fremont |
| Area[1] | |
| • Total | 0.21 sq mi (0.54 km2) |
| • Land | 0.21 sq mi (0.54 km2) |
| • Water | 0 sq mi (0 km2) |
| Elevation | 5,463 ft (1,665 m) |
| Population (2010)[2] | |
| • Total | 231 |
| • Estimate (2012[3]) | 240 |
| • Density | 1,100.0/sq mi (424.7/km2) |
| Time zone | Mountain (MST) (UTC-7) |
| • Summer (DST) | MDT (UTC-6) |
| ZIP code | 82523 |
| Area code(s) | 307 |
| FIPS code | 56-60130[4] |
| GNIS feature ID | 1592630[5] |
Pavilion is a town in Fremont County, Wyoming, United States. The population was 231 at the 2010 census.
In 2010 the United States Environmental Protection Agency opened an investigation into the possible contamination of groundwater approximately five (5) miles east-northeast of Pavilion (not the Town of Pavilion's water supply).[6]
Geography
Pavilion is located at 43°14′34″N 108°41′24″W / 43.24278°N 108.69000°W (43.242885, -108.689996).[7]
According to the United States Census Bureau, the town has a total area of 0.21 square miles (0.54 km2), all of it land.[1]
Demographics
| Historical population | |||
|---|---|---|---|
| Census | Pop. | %± | |
| 1940 | 176 | — | |
| 1950 | 241 | 36.9% | |
| 1960 | 190 | −21.2% | |
| 1970 | 181 | −4.7% | |
| 1980 | 287 | 58.6% | |
| 1990 | 126 | −56.1% | |
| 2000 | 165 | 31.0% | |
| 2010 | 231 | 40.0% | |
| Est. 2015 | 238 | [8] | 3.0% |
2010 census
As of the census[2] of 2010, there were 231 people, 95 households, and 64 families residing in the town. The population density was 1,100.0 inhabitants per square mile (424.7/km2). There were 108 housing units at an average density of 514.3 per square mile (198.6/km2). The racial makeup of the town was 93.1% White, 3.0% Native American, 0.4% Asian, 0.4% from other races, and 3.0% from two or more races. Hispanic or Latino of any race were 5.6% of the population.
There were 95 households of which 30.5% had children under the age of 18 living with them, 49.5% were married couples living together, 11.6% had a female householder with no husband present, 6.3% had a male householder with no wife present, and 32.6% were non-families. 29.5% of all households were made up of individuals and 16.8% had someone living alone who was 65 years of age or older. The average household size was 2.43 and the average family size was 3.02.
The median age in the town was 42.3 years. 23.8% of residents were under the age of 18; 6.5% were between the ages of 18 and 24; 23% were from 25 to 44; 28.2% were from 45 to 64; and 18.6% were 65 years of age or older. The gender makeup of the town was 48.9% male and 51.1% female.
2000 census
As of the census[4] of 2000, there were 165 people, 77 households, and 50 families residing in the town. The population density was 861.2 people per square mile (335.3/km²). There were 89 housing units at an average density of 464.5 per square mile (180.9/km²). The racial makeup of the town was 93.94% White, 1.82% Native American, 0.61% from other races, and 3.64% from two or more races. Hispanic or Latino of any race were 2.42% of the population.
There were 77 households out of which 23.4% had children under the age of 18 living with them, 54.5% were married couples living together, 9.1% had a female householder with no husband present, and 33.8% were non-families. 31.2% of all households were made up of individuals and 15.6% had someone living alone who was 65 years of age or older. The average household size was 2.14 and the average family size was 2.69.
In the town the population was spread out with 21.8% under the age of 18, 9.1% from 18 to 24, 20.6% from 25 to 44, 32.7% from 45 to 64, and 15.8% who were 65 years of age or older. The median age was 44 years. For every 100 females there were 96.4 males. For every 100 females age 18 and over, there were 84.3 males.
The median income for a household in the town was $33,125, and the median income for a family was $41,250. Males had a median income of $30,833 versus $19,167 for females. The per capita income for the town was $17,790. About 3.3% of families and 3.5% of the population were below the poverty line, including none of those under the age of eighteen and 7.1% of those sixty five or over.
Education
Public education in the town of Pavilion is administered by Fremont County School District #6. Zoned campuses include Wind River Elementary School (grades K-5) and Wind River Middle/High School (grades 6-12).
Climate
Pavilion experiences a desert climate (Köppen BWk) with cold, dry winters and hot, slightly wetter summers.
| Climate data for Pavillion, Wyoming | |||||||||||||
|---|---|---|---|---|---|---|---|---|---|---|---|---|---|
| Month | Jan | Feb | Mar | Apr | May | Jun | Jul | Aug | Sep | Oct | Nov | Dec | Year |
| Record high °F (°C) | 63 (17) |
70 (21) |
76 (24) |
81 (27) |
90 (32) |
96 (36) |
100 (38) |
100 (38) |
97 (36) |
83 (28) |
69 (21) |
65 (18) |
100 (38) |
| Average high °F (°C) | 32.3 (0.2) |
38.4 (3.6) |
48.9 (9.4) |
58.5 (14.7) |
67.5 (19.7) |
77.5 (25.3) |
84.5 (29.2) |
82.8 (28.2) |
72.1 (22.3) |
59.5 (15.3) |
41.8 (5.4) |
33.1 (0.6) |
58.08 (14.49) |
| Daily mean °F (°C) | 20.8 (−6.2) |
26.2 (−3.2) |
35.8 (2.1) |
44.4 (6.9) |
53.4 (11.9) |
62.4 (16.9) |
68.6 (20.3) |
67.1 (19.5) |
57.1 (13.9) |
46.0 (7.8) |
30.7 (−0.7) |
21.8 (−5.7) |
44.53 (6.96) |
| Average low °F (°C) | 9.2 (−12.7) |
14.0 (−10) |
22.6 (−5.2) |
30.3 (−0.9) |
39.2 (4) |
47.2 (8.4) |
52.7 (11.5) |
51.3 (10.7) |
42.0 (5.6) |
32.5 (0.3) |
19.5 (−6.9) |
10.5 (−11.9) |
30.92 (−0.59) |
| Record low °F (°C) | −36 (−38) |
−27 (−33) |
−17 (−27) |
0 (−18) |
17 (−8) |
20 (−7) |
35 (2) |
34 (1) |
15 (−9) |
−5 (−21) |
−22 (−30) |
−40 (−40) |
−40 (−40) |
| Average precipitation inches (mm) | 0.19 (4.8) |
0.19 (4.8) |
0.36 (9.1) |
0.97 (24.6) |
1.79 (45.5) |
0.93 (23.6) |
0.79 (20.1) |
0.57 (14.5) |
0.90 (22.9) |
0.57 (14.5) |
0.36 (9.1) |
0.19 (4.8) |
7.81 (198.3) |
| Source #1: NOAA (normals, 1971–2000) [10] | |||||||||||||
| Source #2: The Weather Channel (Records) [11] | |||||||||||||
Fracking and water quality
In 2008 rural residents 5 miles east-northeast of Pavilion complained of discolored water, foul smells and illness that they suspected was due to fracking, and the EPA opened an investigation.[12][13] In 2010, the EPA investigators warned the affected rural residents not to drink their water after finding benzene, naphthalene, phenols, and metals in the water and recommended that the affected rural residents use fans while bathing or washing clothes to avoid the risk of explosion.[13] As of September 2012 testing and discussion about the results was still ongoing.[14][15] Eventually, in 2016, a study confirmed that chemicals used in fracking impact drinking water that is generated from wells.[16]
References
- 1 2 "US Gazetteer files 2010". United States Census Bureau. Archived from the original on January 24, 2012. Retrieved 2012-12-14.
- 1 2 "American FactFinder". United States Census Bureau. Retrieved 2012-12-14.
- ↑ "Population Estimates". United States Census Bureau. Archived from the original on June 17, 2013. Retrieved 2013-06-01.
- 1 2 "American FactFinder". United States Census Bureau. Retrieved 2008-01-31.
- ↑ "US Board on Geographic Names". United States Geological Survey. 2007-10-25. Retrieved 2008-01-31.
- ↑ "Groundwater Investigation Pavillion." EPA.
- ↑ "US Gazetteer files: 2010, 2000, and 1990". United States Census Bureau. 2011-02-12. Retrieved 2011-04-23.
- ↑ "Annual Estimates of the Resident Population for Incorporated Places: April 1, 2010 to July 1, 2015". Retrieved July 2, 2016.
- ↑ "Census of Population and Housing". Census.gov. Archived from the original on May 11, 2015. Retrieved June 4, 2015.
- ↑ "Climatography of the United States NO.81" (PDF). National Oceanic and Atmospheric Administration. Retrieved January 13, 2011.
- ↑ "Monthly Averages for Pavillion, WY". The Weather Channel. Retrieved January 13, 2011.
- ↑ Abrahm Lustgarten, "Feds Warn Residents Near Wyoming Gas Drilling Sites Not to Drink Their Water" ProPublica (September 1, 2010). Retrieved May 19, 2011
- 1 2 Nicholas Kusnetz, "Wyoming Fracking Rules Would Disclose Drilling Chemicals" ProPublica (September 14, 2010). Retrieved May 19, 2011
- ↑ Mark Drajem for Bloomberg News. Sep 27, 2012 Diesel in Water Near Fracking Confirms EPA Tests Wyoming Disputes
- ↑ EPA Office Website Groundwater Investigation: Pavillion
- ↑ DiGuilio DC, Jackson RB (March 29, 2016). "Impact to Underground Sources of Drinking Water and Domestic Wells from Production Well Stimulation and Completion Practices in the Pavillion, Wyoming, Field". Environmental Science and Technology. doi:10.1021/cas.est5b04970. Retrieved March 31, 2016.
Municipalities and communities of Fremont County, Wyoming, United States | ||
|---|---|---|
| Cities | 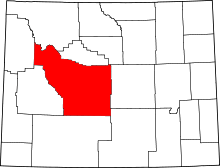 | |
| Towns | ||
| CDPs | ||
| Unincorporated communities | ||
| Ghost town | ||
| Indian reservation | ||