Paleocene–Eocene Thermal Maximum
The Paleocene–Eocene Thermal Maximum (PETM), alternatively "Eocene thermal maximum 1" (ETM1), and formerly known as the "Initial Eocene" or "Late Paleocene Thermal Maximum" was a time period with more than 8 °C warmer global average temperature than today. This climate event began at the time boundary between the Paleocene and Eocene geological epochs.[1] The exact age and duration of the event is uncertain but it is estimated to have occurred around 55.5 million years ago.[2]
The associated period of massive carbon injection into the atmosphere has been estimated to have lasted no longer than 20,000 years. The entire warm period lasted for about 200,000 years. Global temperatures increased by 5–8 °C.[3] The carbon dioxide was likely released in two pulses, the first lasting less than 2,000 years. Such a repeated carbon release is in line with current global warming.[2] A main difference is that during the Paleocene–Eocene Thermal Maximum, the planet was essentially ice-free.[4]
The onset of the Paleocene–Eocene Thermal Maximum has been linked to an initial 5 °C temperature rise and to extreme changes in Earth's carbon cycle.[3] The period is marked by a prominent negative excursion in carbon stable isotope (δ13C) records from around the globe; more specifically, there was a large decrease in 13C/12C ratio of marine and terrestrial carbonates and organic carbon.[3][5][6]
Stratigraphic sections of rock from this period reveal numerous other changes.[3] Fossil records for many organisms show major turnovers. For example, in the marine realm, a mass extinction of benthic foraminifera, a global expansion of subtropical dinoflagellates, and an appearance of excursion, planktic foraminifera and calcareous nanofossils all occurred during the beginning stages of PETM. On land, modern mammal orders (including primates) suddenly appear in Europe and in North America. Sediment deposition changed significantly at many outcrops and in many drill cores spanning this time interval.
At least since 1997, the Paleocene–Eocene Thermal Maximum has become a focal point of considerable geoscience research because it probably provides the best past analog by which to understand impacts of global climate warming and of massive carbon input to the ocean and atmosphere, including ocean acidification.[7] Although it is now widely accepted that the PETM represents a "case study" for global warming and massive carbon input to Earth's surface,[3][8] the cause, details and overall significance of the event remain perplexing.
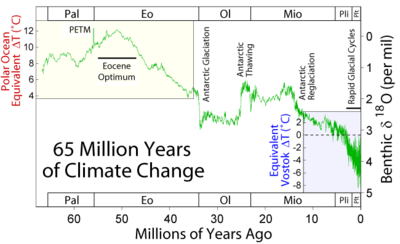
Axis scale: millions of years ago.
Setting
The configuration of oceans and continents was somewhat different during the early Paleogene relative to present-day. The Panama Isthmus did not yet connect North America and South America, and this allowed direct low-latitude circulation between the Pacific and Atlantic Oceans. Drake Passage, which now separates South America and Antarctica, was closed, and this perhaps prevented thermal isolation of Antarctica. The Arctic was also more restricted. Although various proxies for past atmospheric CO2 levels in the Eocene do not agree in absolute terms, all suggest that levels then were much higher than at present. In any case, there were no significant ice sheets during this time.[11]
Earth surface temperatures increased by about 6 °C from the late Paleocene through the early Eocene, culminating in the "Early Eocene Climatic Optimum" (EECO).[11] Superimposed on this long-term, gradual warming were at least two (and probably more) "hyperthermals". These can be defined as geologically brief (<200,000 year) events characterized by rapid global warming, major changes in the environment, and massive carbon addition. Of these, the PETM was the most extreme and perhaps the first (at least within the Cenozoic). Another hyperthermal clearly occurred at approximately 53.7 Ma, and is now called ETM-2 (also referred to as H-1, or the Elmo event). However, additional hyperthermals probably occurred at about 53.6 Ma (H-2), 53.3 (I-1), 53.2 (I-2) and 52.8 Ma (informally called K, X or ETM-3). The number, nomenclature, absolute ages, and relative global impact of the Eocene hyperthermals are the source of considerable current research. Whether they only occurred during the long-term warming, and whether they are causally related to apparently similar events in older intervals of the geological record (e.g. the Toarcian turnover of the Jurassic) are open issues.
Acidification of deep waters, and the later spreading from the North Atlantic can explain spatial variations in carbonate dissolution. Model simulations show acidic water accumulation in the deep North Atlantic at the onset of the event.[12]
Evidence for global warming
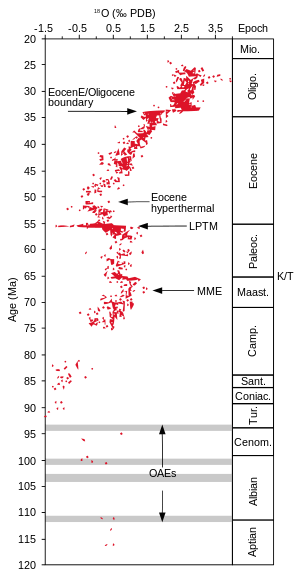
LPTM— Paleocene-Eocene Thermal Maximum
OAEs— Oceanic Anoxic Events
MME— Mid-Maastrichtian Event
At the start of the PETM, average global temperatures increased by approximately 6 °C (11 °F) within about 20,000 years. This warming was superimposed on "long-term" early Paleogene warming, and is based on several lines of evidence. There is a prominent (>1‰) negative excursion in the δ18O of foraminifera shells, both those made in surface and deep ocean water. Because there was a paucity of continental ice in the early Paleogene, the shift in δ18O very probably signifies a rise in ocean temperature.[13] The temperature rise is also supported by analyses of fossil assemblages, the Mg/Ca ratios of foraminifera, and the ratios of certain organic compounds, such as TEX86.
Precise limits on the global temperature rise during the PETM and whether this varied significantly with latitude remain open issues. Oxygen isotope and Mg/Ca of carbonate shells precipitated in surface waters of the ocean are commonly used measurements for reconstructing past temperature; however, both paleotemperature proxies can be compromised at low latitude locations, because re-crystallization of carbonate on the seafloor renders lower values than when formed. On the other hand, these and other temperature proxies (e.g., TEX86) are impacted at high latitudes because of seasonality; that is the “temperature recorder” is biased toward summer, and therefore higher values, when the production of carbonate and organic carbon occurred.
Certainly, the central Arctic Ocean was ice-free before, during and after the PETM. This can be ascertained from the composition of sediment cores recovered during the Arctic Coring Expedition (ACEX) at 87°N on Lomonosov Ridge.[14] Moreover, temperatures increased during the PETM, as indicated by the brief presence of subtropical dinoflagellates,[15] and a marked increase in TEX86.[16] The latter record is intriguing, though, because it suggests a 6 °C (11 °F) rise from ~17 °C (63 °F) before the PETM to ~23 °C (73 °F) during the PETM. Assuming the TEX86 record reflects summer temperatures, it still implies much warmer temperatures on the North Pole compared to present-day, but no significant latitudinal amplification relative to surrounding time.
The above considerations are important because, in many global warming simulations, high latitude temperatures increase much more at the poles through an ice-albedo feedback.[17] It may be the case, however, that during the PETM, this feedback was largely absent because of limited polar ice, so temperatures on the Equator and at the poles increased similarly.
Evidence for carbon addition
Clear evidence for massive addition of 13C-depleted carbon at the onset of the PETM comes from two observations. First, a prominent negative excursion in the carbon isotope composition (δ13C) of carbon-bearing phases characterizes the PETM in numerous (>130) widespread locations from a range of environments.[3] Second, carbonate dissolution marks the PETM in sections from the deep sea.
The total mass of carbon injected to the ocean and atmosphere during the PETM remains the source of debate. In theory, it can be estimated from the magnitude of the negative carbon isotope excursion (CIE), the amount of carbonate dissolution on the seafloor, or ideally both.[7][8] However, the shift in the δ13C across the PETM depends on the location and the carbon-bearing phase analyzed. In some records of bulk carbonate, it is about 2‰ (per mil); in some records of terrestrial carbonate or organic matter it exceeds 6‰.[3][18] Carbonate dissolution also varies throughout different ocean basins. It was extreme in parts of the north and central Atlantic Ocean, but far less pronounced in the Pacific Ocean.[8][19][20] With available information, estimates of the carbon addition range from about 2000 to 7000 gigatons.[8][19][20]
Timing of carbon addition and warming
The timing of the PETM δ13C excursion is of considerable interest. This is because the total duration of the CIE, from the rapid drop in δ13C through the near recovery to initial conditions, relates to key parameters of our global carbon cycle, and because the onset provides insight to the source of 13C-depleted CO2.
The total duration of the CIE can be estimated in several ways. The iconic sediment interval for examining and dating the PETM is a core recovered in 1987 by the Ocean Drilling Program at Hole 690B at Maud Rise in the South Atlantic Ocean. At this location, the PETM CIE, from start to end, spans about 2 m.[5] Long-term age constraints, through biostratigraphy and magnetostratigraphy, suggest an average Paleogene sedimentation rate of about 1.23 cm/1,000yrs. Assuming a constant sedimentation rate, the entire event, from onset though termination, was therefore estimated at about 200,000 years.[5] Subsequently, it was noted that the CIE spanned 10 or 11 subtle cycles in various sediment properties, such as Fe content. Assuming these cycles represent precession, a similar but slightly longer age was calculated by Rohl et al. 2000.[21] Interestingly and importantly, a ~200,000 duration for the CIE is estimated from models of global carbon cycling .[22] If a massive amount of 13C-depleted CO2 is rapidly injected into the modern ocean or atmosphere and projected into the future, a ~200,000 year CIE results because of slow flushing through quasi steady-state inputs (weathering and volcanism) and outputs (carbonate and organic) of carbon.
The above approach can be performed at many sections containing the PETM. This has led to an intriguing result.[23] At some locations (mostly deep-marine), sedimentation rates must have decreased across the PETM, presumably because of carbonate dissolution on the seafloor; at other locations (mostly shallow-marine), sedimentation rates must have increased across the PETM, presumably because of enhanced delivery of riverine material during the event.
Age constraints at several deep-sea sites have been independently examined using 3He contents, assuming the flux of this cosmogenic nuclide is roughly constant over short time periods.[24] This approach also suggests a rapid onset for the PETM CIE (<20,000 years). However, the 3He records support a faster recovery to near initial conditions (<100,000 years)[24] than predicted by flushing via weathering inputs and carbonate and organic outputs.
There is other evidence to suggest that warming predated the δ13C excursion by some 3,000 years.[25]
Effects
Weather
The climate would also have become much wetter, with the increase in evaporation rates peaking in the tropics. Deuterium isotopes reveal that much more of this moisture was transported polewards than normal.[26]
Ocean
Arctic Ocean freshwater amount increased, in part due to northern hemisphere rainfall patterns, fueled by poleward storm track migrations under global warming conditions.[26]
Anoxia
In parts of the oceans, especially the north Atlantic Ocean, bioturbation is absent. This may be due to bottom-water anoxia, or by changing ocean circulation patterns changing the temperatures of the bottom water. However, many ocean basins remain bioturbated through the PETM.[27]
Sea level
Despite the global lack of ice, the sea level would have risen due to thermal expansion.[16] Evidence for this can be found in the shifting palynomorph assemblages of the Arctic ocean, which reflect a relative decrease in terrestrial organic material compared to marine organic matter.[16]
Currents
At the start of the PETM, the ocean circulation patterns changed radically in the course of under 5,000 years.[28] Global-scale current directions reversed due to a shift in overturning from the southern hemisphere to northern hemisphere overturning.[28] This "backwards" flow persisted for 40,000 years.[28] Such a change would transport warm water to the deep oceans, enhancing further warming.[28]
Lysocline
The lysocline marks the depth at which carbonate starts to dissolve (above the lysocline, carbonate is oversaturated): today, this is at about 4 km, comparable to the median depth of the oceans. This depth depends on (among other things) temperature and the amount of CO2 dissolved in the ocean. Adding CO2 initially shallows the lysocline,[29] resulting in the dissolution of deep water carbonates. This deep-water acidification can be observed in ocean cores, which show (where bioturbation has not destroyed the signal) an abrupt change from grey carbonate ooze to red clays (followed by a gradual grading back to grey). It is far more pronounced in north Atlantic cores than elsewhere, suggesting that acidification was more concentrated here, related to a greater rise in the level of the lysocline. In parts of the southeast Atlantic, the lysocline rose by 2 km in just a few thousand years.[27]
Life
Stoichiometric magnetite (Fe
3O
4) particles were obtained from PETM-age marine sediments. The study from 2008 found elongate prism and spearhead crystal morphologies, considered unlike any magnetite crystals previously reported, and are potentially of biogenic origin.[30] These biogenic magnetite show unique gigantism, and probably are of aquatic origin. The study suggests that development of a thick suboxic zones with high iron bioavailability, the result of dramatic changes in weathering and sedimentation rates, drove diversification of magnetite-forming organisms, and likely including eukaryotes.[31] Biogenic magnetite were also found in human brain tissues. Biogenic magnetites in animals have a crucial role in geomagnetic field navigation.[32]
Ocean
The PETM is accompanied by a mass extinction of 35-50% of benthic foraminifera (especially in deeper waters) over the course of ~1,000 years – the group suffering more than during the dinosaur-slaying K-T extinction (e.g.,[33][34][35]). Contrarily, planktonic foraminifera diversified, and dinoflagellates bloomed. Success was also enjoyed by the mammals, who radiated extensively around this time.
The deep-sea extinctions are difficult to explain, because many species of benthic foraminifera in the deep-sea are cosmopolitan, and can find refugia against local extinction.[36] General hypotheses such as a temperature-related reduction in oxygen availability, or increased corrosion due to carbonate undersaturated deep waters, are insufficient as explanations. Acidification may also have played a role in the extinction of the calcifying foraminifera, and the higher temperatures would have increased metabolic rates, thus demanding a higher food supply. Such a higher food supply might not have materialized because warming and increased ocean stratification might have led to declining productivity [37] and/or increased remineralization of organic matter in the water column, before it reached the benthic foraminifera on the sea floor ([38]). The only factor global in extent was an increase in temperature. Regional extinctions in the North Atlantic can be attributed to increased deep-sea anoxia, which could be due to the slowdown of overturning ocean currents,[19] or the release and rapid oxidation of large amounts of methane. Oxygen minimum zones in the oceans may have expanded.[39]
In shallower waters, it's undeniable that increased CO2 levels result in a decreased oceanic pH, which has a profound negative effect on corals.[40] Experiments suggest it is also very harmful to calcifying plankton.[41] However, the strong acids used to simulate the natural increase in acidity which would result from elevated CO2 concentrations may have given misleading results, and the most recent evidence is that coccolithophores (E. huxleyi at least) become more, not less, calcified and abundant in acidic waters.[42] Interestingly, no change in the distribution of calcareous nanoplankton such as the coccolithophores can be attributed to acidification during the PETM.[42] Acidification did lead to an abundance of heavily calcified algae[43] and weakly calcified forams.[44]
Land
Humid conditions caused migration of modern Asian mammals northward, dependent on the climatic belts. Uncertainty remains for the timing and tempo of migration.[45]
The increase in mammalian abundance is intriguing. There is no evidence of any increased extinction rate among the terrestrial biota. Increased CO2 levels may have promoted dwarfing[46][47] – which may have encouraged speciation. Many major mammalian orders – including the Artiodactyla, horses, and primates – appeared and spread around the globe 13,000 to 22,000 years after the initiation of the PETM.[46]
Temperature
Proxy data from one of the studied sites show rapid +8 °C temperature rise, in accordance with existing regional records of marine and terrestrial environments.[45]
Terrestrial
During the PETM sediments are enriched with kaolinite from a detrital source due to denudation (initial processes such as volcanoes, earthquakes, and plate tectonics). This suggests increased precipitation, and enhanced erosion of older kaolinite-rich soils and sediments. Increased weathering from the enhanced runoff, formed thick paleosoil enriched with carbonate nodules (Microcodium like), and this suggests a semi-arid climate.[45]
Possible causes
Discriminating between different causes of the PETM is difficult. Temperatures were rising globally at a steady pace, and a mechanism must be invoked to produce a sudden spike which may have been accentuated by positive feedbacks. The biggest aid in disentangling these factors comes from a consideration of the carbon isotope mass balance. We know the entire exogenic carbon cycle (i.e. the carbon contained within the oceans and atmosphere, which can change on short timescales) underwent a −0.2 % to −0.3 % perturbation in δ13C, and by considering the isotopic signatures of other carbon reserves, can consider what mass of the reserve would be necessary to produce this effect. The assumption underpinning this approach is that the mass of exogenic carbon was the same in the Paleogene as it is today – something which is very hard to confirm.
Eruption of large kimberlite field
Although the cause of the initial warming has been attributed to a massive injection of carbon (CO2 and/or CH4) into the atmosphere, the source of the carbon has yet to be found. The emplacement of a large cluster of kimberlite pipes at ~56 Ma in the Lac de Gras region of northern Canada may have provided the carbon that triggered early warming in the form of exsolved magmatic CO2. Calculations indicate that the estimated 900-1,100 Pg[48] of carbon required for the initial ~3 °C of ocean water warming associated with the Paleocene-Eocene thermal maximum could have been released during the emplacement of a large kimberlite cluster.[49] The transfer of warm surface ocean water to intermediate depths led to thermal dissociation of seafloor methane hydrates providing the isotopically depleted carbon that produced the carbon isotopic excursion.The coeval ages of two other kimberlite clusters in the Lac de Gras field and two other early Cenozoic hyperthermals indicate that CO2 degassing during kimberlite emplacement is a plausible source of the CO2 responsible for these sudden global warming events.
Volcanic activity
In order to balance the mass of carbon and produce the observed δ13C value, at least 1,500 gigatons of carbon would have to have been degassed from the mantle via volcanoes over the course of the two 1,000 year steps. To put this in perspective, this is about 200 times the background rate of degassing for the rest of the Paleocene. There is no indication that such a burst of volcanic activity has occurred at any point in Earth's history. However, substantial volcanism had been active in East Greenland for around the preceding million years or so, but this struggles to explain the rapidity of the PETM. Even if the bulk of the 1,500 gigatons of carbon was released in a single pulse, further feedbacks would be necessary to produce the observed isotopic excursion.
On the other hand, there are suggestions that surges of activity occurred in the later stages of the volcanism and associated continental rifting. Intrusions of hot magma into carbon-rich sediments may have triggered the degassing of isotopically light methane in sufficient volumes to cause global warming and the observed isotope anomaly. This hypothesis is documented by the presence of extensive intrusive sill complexes and thousands of kilometer-sized hydrothermal vent complexes in sedimentary basins on the mid-Norwegian margin and west of Shetland.[50][51] Volcanic eruptions of a large magnitude can impact global climate, reducing the amount of solar radiation reaching the Earth's surface, lowering temperatures in the troposphere, and changing atmospheric circulation patterns. Large-scale volcanic activity may last only a few days, but the massive outpouring of gases and ash can influence climate patterns for years. Sulfuric gases convert to sulfate aerosols, sub-micron droplets containing about 75 percent sulfuric acid. Following eruptions, these aerosol particles can linger as long as three to four years in the stratosphere.[52] Further phases of volcanic activity could have triggered the release of more methane, and caused other early Eocene warm events such as the ETM2.[19] It has also been suggested that volcanic activity around the Caribbean may have disrupted the circulation of oceanic currents,[53] amplifying the magnitude of climate change.
Comet impact
A briefly popular theory held that a 12C-rich comet struck the earth and initiated the warming event. A cometary impact coincident with the P/E boundary can also help explain some enigmatic features associated with this event, such as the iridium anomaly at Zumaia, the abrupt appearance of kaolinitic clays with abundant magnetic nanoparticles on the coastal shelf of New Jersey, and especially the nearly simultaneous onset of the carbon isotope excursion and the thermal maximum. Indeed, a key feature and testable prediction of a comet impact is that it should produce virtually instantaneous environmental effects in the atmosphere and surface ocean with later repercussions in the deeper ocean.[54] Even allowing for feedback processes, this would require at least 100 gigatons of extraterrestrial carbon.[54] Such a catastrophic impact should have left its mark on the globe. Unfortunately, the evidence put forward does not stand up to scrutiny. An unusual 9-meter-thick clay layer supposedly formed soon after the impact, containing unusual amounts of magnetite, but it formed too slowly for these magnetic particles to have been a result of the comet's impact,[25] and it turns out they were created by bacteria.[55] However, recent analyses have shown that isolated particles of non-biogenic origin make up the majority of the magnetic particles in the thick clay unit.[56]
A 2016 report in Science describes the discovery of impact ejecta from three marine P-E boundary sections from the Atlantic margin of the eastern U.S., indicating that an extraterrestrial impact occurred during the carbon isotope excursion at the P-E boundary.[57][58] The silicate glass spherules found were identified as microtektites and microkrystites.[57]
Burning of peat
The combustion of prodigious quantities of peat was once postulated, because there was probably a greater mass of carbon stored as living terrestrial biomass during the Paleocene than there is today since plants in fact grew more vigorously during the period of the PETM. This theory was refuted, because in order to produce the δ13C excursion observed, over 90% of the Earth's biomass would have to have been combusted. However, the Paleocene is also recognized as a time of significant peat accumulation worldwide. A comprehensive search failed to find evidence for the combustion of fossil organic matter, in the form of soot or similar particulate carbon.[59]
Orbital forcing
The presence of later (smaller) warming events of a global scale, such as the Elmo horizon (aka ETM2), has led to the hypothesis that the events repeat on a regular basis, driven by maxima in the 400,000 and 100,000 year eccentricity cycles in the Earth's orbit. The current warming period is expected to last another 50,000 years due to a minimum in the eccentricity of the Earth's orbit. Orbital increase in insolation (and thus temperature) would force the system over a threshold and unleash positive feedbacks.[60]
Methane release
None of the above causes are alone sufficient to cause the carbon isotope excursion or warming observed at the PETM. The most obvious feedback mechanism that could amplify the initial perturbation is that of methane clathrates. Under certain temperature and pressure conditions, methane – which is being produced continually by decomposing microbes in sea bottom sediments – is stable in a complex with water, which forms ice-like cages trapping the methane in solid form. As temperature rises, the pressure required to keep this clathrate configuration stable increases, so shallow clathrates dissociate, releasing methane gas to make its way into the atmosphere. Since biogenic clathrates have a δ13C signature of −60 ‰ (inorganic clathrates are the still rather large −40 ‰), relatively small masses can produce large δ13C excursions. Further, methane is a potent greenhouse gas as it is released into the atmosphere, so it causes warming, and as the ocean transports this warmth to the bottom sediments, it destabilizes more clathrates. It would take around 2,300 years for an increased temperature to diffuse warmth into the sea bed to a depth sufficient to cause a release of clathrates, although the exact time-frame is highly dependent on a number of poorly constrained assumptions.[61] Ocean warming due to flooding and pressure changes due to a sea-level drop may have caused clathrates to become unstable and release methane. This can take place over as short of a period as a few thousand years. The reverse process, that of fixing methane in clathrates, occurs over a larger scale of tens of thousands of years.[62]
In order for the clathrate hypothesis to work, the oceans must show signs of having been warmer slightly before the carbon isotope excursion, because it would take some time for the methane to become mixed into the system and δ13C-reduced carbon to be returned to the deep ocean sedimentary record. Until recently, the evidence suggested that the two peaks were in fact simultaneous, weakening the support for the methane theory. But recent (2002) work has managed to detect a short gap between the initial warming and the δ13C excursion.[63] Chemical markers of surface temperature (TEX86) also indicate that warming occurred around 3,000 years before the carbon isotope excursion, but this does not seem to hold true for all cores.[25] Notably, deeper (non-surface) waters do not appear to display evidence of this time gap.[64] Moreover, the small apparent change in TEX86 that precede the δ13C anomaly can easily (and more plausibly) be ascribed to local variability (especially on the atlantic coastal plain, e.g. Sluijs, et al., 2007) as the TEX86 paleo-thermometer is prone to significant biological effects. The δ18O of benthic or plantonic forams does not show any pre-warming in any of these localities, and in an ice-free world, it is generally a much more reliable indicator of past ocean temperatures.
Analysis of these records reveals another interesting fact: planktonic (floating) forams record the shift to lighter isotope values earlier than benthic (bottom dwelling) forams. The lighter (lower δ13C) methanogenic carbon can only be incorporated into the forams' shells after it has been oxidised. A gradual release of the gas would allow it to be oxidised in the deep ocean, which would make benthic forams show lighter values earlier. The fact that the planktonic forams are the first to show the signal suggests that the methane was released so rapidly that its oxidation used up all the oxygen at depth in the water column, allowing some methane to reach the atmosphere unoxidised, where atmospheric oxygen would react with it. This observation also allows us to constrain the duration of methane release to under around 10,000 years.[63]
However, there are several major problems with the methane hydrate dissociation hypothesis. The most parsimonious interpretation for surface-water forams to show the δ13C excursion before their benthic counterparts (as in the Thomas et al. paper) is that the perturbation occurred from the top down, and not the bottom up. If the anomalous δ13C (in whatever form: CH4 or CO2) entered the atmospheric carbon reservoir first, and then diffused into the surface ocean waters, which mix with the deeper ocean waters over much longer time-scales, we would expect to observe the planktonics shifting toward lighter values before the benthics. Moreover, careful examination of the Thomas et al. data set shows that there is not a single intermediate planktonic foram value, implying that the perturbation and attendant δ13C anomaly happened over the lifespan of a single foram – much too fast for the nominal 10,000-year release needed for the methane hypothesis to work.
There is a debate about whether there was a large enough amount of methane hydrate to be a major carbon source; a recent paper proposed that was the case.[65] The present-day global methane hydrate reserve is poorly constrained, but is mostly considered to be between 2,000 and 10,000 Gt. However, because the global ocean bottom temperatures were ~6 °C higher than today, which implies a much smaller volume of sediment hosting gas hydrate than today, the global amount of hydrate before the PETM has been thought to be much less than present-day estimates. Many scientists have thus regarded the source of carbon for the PETM to be a mystery.[66] However, a recent paper using numerical simulations suggests that enhanced organic carbon sedimentation and methanogenesis could have compensated for the smaller volume of hydrate stability.[65]
Ocean circulation
The large scale patterns of ocean circulation are important when considering how heat was transported through the oceans. Our understanding of these patterns is still in a preliminary stage. Models show that there are possible mechanisms to quickly transport heat to the shallow, clathrate-containing ocean shelves, given the right bathymetric profile, but the models cannot yet match the distribution of data we observe. "Warming accompanying a south-to-north switch in deepwater formation would produce sufficient warming to destabilize seafloor gas hydrates over most of the world ocean to a water depth of at least 1900 m." (K. Bice and J. Marotzke) This destabilization could have resulted in the release of more than 2000 gigatons of methane gas from the clathrate zone of the ocean floor.[67]
Arctic freshwater input into the North Pacific could serve as a catalyst for methane hydrate destabilization, an event suggested as a precursor to the onset of the PETM.[68]
Comparison with today's climate change
Model simulations of peak carbon addition to the ocean–atmosphere system during the PETM give a probable range of 0.3–1.7 Pg C/yr, which is much slower than the currently observed rate of carbon emissions.[69]
Recovery
Climate proxies, such as ocean sediments (depositional rates) indicate a duration of ∼83 ka, with ∼33 ka in the early rapid phase and ∼50 ka in a subsequent gradual phase.[3]
The most likely method of recovery involves an increase in biological productivity, transporting carbon to the deep ocean. This would be assisted by higher global temperatures and CO2 levels, as well as an increased nutrient supply (which would result from higher continental weathering due to higher temperatures and rainfall; volcanoes may have provided further nutrients). Evidence for higher biological productivity comes in the form of bio-concentrated barium.[70] However, this proxy may instead reflect the addition of barium dissolved in methane.[71] Diversifications suggest that productivity increased in near-shore environments, which would have been warm and fertilized by run-off, outweighing the reduction in productivity in the deep oceans.[44]
See also
- Abrupt climate change
- Azolla event
- Canfield ocean
- Clathrate gun hypothesis
- Climate sensitivity
- Eocene
- Eocene Thermal Maximum 2
- Paleocene
- Paleogene
- Runaway climate change
Notes
- ↑ Westerhold, T..; Röhl, U.; Raffi, I.; Fornaciari, E.; Monechi, S.; Reale, V.; Bowles, J.; Evans, H. F. (2008). "Astronomical calibration of the Paleocene time" (PDF). Palaeogeography, Paleoclimatology, Palaeoecology. 257 (4): 377–403. doi:10.1016/j.palaeo.2007.09.016.
- 1 2 Bowen; et al. (2015). "Two massive, rapid releases of carbon during the onset of the Palaeocene–Eocene thermal maximum". Nature. 8: 44. doi:10.1038/ngeo2316.
- 1 2 3 4 5 6 7 8 McInherney, F.A..; Wing, S. (2011). "A perturbation of carbon cycle, climate, and biosphere with implications for the future". Annual Review of Earth and Planetary Sciences. 39: 489–516. Bibcode:2011AREPS..39..489M. doi:10.1146/annurev-earth-040610-133431.
- ↑ "PETM Weirdness". RealClimate. 2009.
- 1 2 3 Kennett, J.P.; Stott, L.D. (1991). "Abrupt deep-sea warming, palaeoceanographic changes and benthic extinctions at the end of the Paleocene" (PDF). Nature. 353 (6341): 225–229. doi:10.1038/353225a0.
- ↑ Koch, P.L.; Zachos, J.C.; Gingerich, P.D. (1992). "Correlation between isotope records in marine and continental carbon reservoirs near the Palaeocene/Eocene boundary". Nature. 358 (6384): 319–322. doi:10.1038/358319a0.
- 1 2 Dickens, G.R.; Castillo, M.M.; Walker, J.C.G. (1997). [ "A blast of gas in the latest Paleocene; simulating first-order effects of massive dissociation of oceanic methane hydrate"] Check
|url=value (help) (PDF). Geology. 25 (3): 259–262. doi:10.1130/0091-7613(1997)025<0259:abogit>2.3.co;2. PMID 11541226. Retrieved 2008-02-28. - 1 2 3 4 Zeebe, R.; Zachos, J.C.; Dickens, G.R. (2009). "Carbon dioxide forcing alone insufficient to explain Palaeocene–Eocene Thermal Maximum warming". Nature Geoscience. 2 (8): 576–580. doi:10.1038/ngeo578.
- ↑ Retallack, G. J. (1997). "Neogene Expansion of the North American Prairie". PALAIOS. 12 (4): 380–390. doi:10.2307/3515337. JSTOR 3515337. Retrieved 2008-02-11.
- ↑ Zachos, J. C.; Kump, L. R. (2005). "Carbon cycle feedbacks and the initiation of Antarctic glaciation in the earliest Oligocene". Global and Planetary Change. 47 (1): 51–66. Bibcode:2005GPC....47...51Z. doi:10.1016/j.gloplacha.2005.01.001.
- 1 2 Zachos, J.C.; Dickens, G.R.; Zeebe, R.E. (2008). "An early Cenozoic perspective on greenhouse warming and carbon-cycle dynamics" (PDF). Nature. 451 (7176): 279–83. Bibcode:2008Natur.451..279Z. doi:10.1038/nature06588. PMID 18202643.
- ↑ Kaitlin Alexander; Katrin J. Meissner & Timothy J. Bralower (11 May 2015). "Sudden spreading of corrosive bottom water during the Palaeocene–Eocene Thermal Maximum". Nature Geoscience. 8 (6): 458–461. doi:10.1038/ngeo2430.
- ↑ Thomas, Ellen; Shackleton, Nicholas J. (1996). "The Paleocene-Eocene benthic foraminiferal extinction and stable isotope anomalies". Geological Society London Special Publications. 101 (1): 401–441. Bibcode:1996GSLSP.101..401T. doi:10.1144/GSL.SP.1996.101.01.20. Retrieved April 2013. Check date values in:
|access-date=(help) - ↑ Moran, K.; Backman, J.; Pagani, others (2006). "The Cenozoic palaeoenvironment of the Arctic Ocean". Nature. 441 (7093): 601–605. doi:10.1038/nature04800. PMID 16738653.
- ↑ the dinoflagellates Apectodinium spp.
- 1 2 3 Sluijs, A.; Schouten, S.; Pagani, M.; Woltering, M.; Brinkhuis, H.; Damsté, J.S.S.; Dickens, G.R.; Huber, M.; Reichart, G.J.; Stein, R.; et al. (2006). "Subtropical Arctic Ocean temperatures during the Palaeocene/Eocene thermal maximum". Nature. 441 (7093): 610–613. Bibcode:2006Natur.441..610S. doi:10.1038/nature04668. PMID 16752441.
- ↑ Shellito, Cindy J.; Sloan, Lisa C.; Huber, Matthew (2003). "Climate model sensitivity to atmospheric CO2 levels in the Early-Middle Paleogene". Palaeogeography, Palaeoclimatology, Palaeoecology. 193 (1): 113–123. doi:10.1016/S0031-0182(02)00718-6.
- ↑ Norris, R.D.; Röhl, U. (1999). "Carbon cycling and chronology of climate warming during the Palaeocene/Eocene transition". Nature. 401 (6755): 775–778. Bibcode:1999Natur.401..775N. doi:10.1038/44545.
- 1 2 3 4 Panchuk, K.; Ridgwell, A.; Kump, L.R. (2008). "Sedimentary response to Paleocene-Eocene Thermal Maximum carbon release: A model-data comparison". Geology. 36 (4): 315–318. doi:10.1130/G24474A.1.
- 1 2 Cui, Y.; Kump, L.R.; Ridgwell, A.J.; Charles, A.J.; Junium, C.K.; Diefendorf, A.F.; Freeman, K.H.; Urban, N.M.; Harding, I.C. (2011). "Slow release of fossil carbon during the Palaeocene-Eocene thermal maximum". Nature Geoscience. 4 (7): 481–485. doi:10.1038/ngeo1179.
- ↑ Röhl, U.; Bralower, T.J.; Norris, R.D.; Wefer, G. (2000). "New chronology for the late Paleocene thermal maximum and its environmental implications". Geology. 28 (10): 927–930. Bibcode:2000Geo....28..927R. doi:10.1130/0091-7613(2000)28<927:NCFTLP>2.0.CO;2.
- ↑ Dickens, G.R. (2000). "Methane oxidation during the late Palaeocene thermal maximum". Bulletin Société Géologique de France. 171: 37–49.
- ↑ Giusberti, L.; Rio, D.; Agnini, C.; Backman, J.; Fornaciari, E.; Tateo, F.; Oddone, M. (2007). "Mode and tempo of the Paleocene-Eocene thermal maximum in an expanded section from the Venetian pre-Alps". Geological Society of America. 119 (3–4): 391–412. doi:10.1130/B25994.1.
- 1 2 Farley, K.A.; Eltgroth, S.F. (2003). "An alternative age model for the Paleocene—Eocene thermal maximum using extraterrestrial 3He". Earth and Planetary Science Letters. 208 (3–4): 135–148. Bibcode:2003E&PSL.208..135F. doi:10.1016/S0012-821X(03)00017-7.
- 1 2 3 Sluijs, A.; Brinkhuis, H.; Schouten, S.; Bohaty, S.M.; John, C.M.; Zachos, J.C.; Reichart, G.J.; Sinninghe Damste, J.S.; Crouch, E.M.; Dickens, G.R. (2007). "Environmental precursors to rapid light carbon injection at the Palaeocene/Eocene boundary". Nature. 450 (7173): 1218–21. Bibcode:2007Natur.450.1218S. doi:10.1038/nature06400. PMID 18097406.
- 1 2 Pagani, M.; Pedentchouk, N.; Huber, M.; Sluijs, A.; Schouten, S.; Brinkhuis, H.; Sinninghe Damsté, J.S.; Dickens, G.R.; Others (2006). "Arctic hydrology during global warming at the Palaeocene/Eocene thermal maximum". Nature. 442 (7103): 671–675. Bibcode:2006Natur.442..671P. doi:10.1038/nature05043. PMID 16906647.
- 1 2 Zachos, J.C.; Röhl, U.; Schellenberg, S.A.; Sluijs, A.; Hodell, D.A.; Kelly, D.C.; Thomas, E.; Nicolo, M.; Raffi, I.; Lourens, L.J.; et al. (2005). "Rapid Acidification of the Ocean During the Paleocene-Eocene Thermal Maximum" (PDF). Science. 308 (5728): 1611–1615. Bibcode:2005Sci...308.1611Z. doi:10.1126/science.1109004. PMID 15947184.
- 1 2 3 4 Nunes, F.; Norris, R.D. (2006). "Abrupt reversal in ocean overturning during the Palaeocene/Eocene warm period". Nature. 439 (7072): 60–3. Bibcode:2006Natur.439...60N. doi:10.1038/nature04386. PMID 16397495.
- ↑ Dickens, G.R.; Castillo, M.M.; Walker, J.C.G. (1997). "A blast of gas in the latest Paleocene; simulating first-order effects of massive dissociation of oceanic methane hydrate". Geology. 25 (3): 259–262. Bibcode:1997Geo....25..259D. doi:10.1130/0091-7613(1997)025<0259:ABOGIT>2.3.CO;2. PMID 11541226. Retrieved 2008-02-28.
- ↑ Peter C. Lippert (2008). "Big discovery for biogenic magnetite". PNAS. 105 (46): 17595–17596. doi:10.1073/pnas.0809839105. PMC 2584755
 . PMID 19008352.
 - ↑ Schumann; et al. (2008). "Gigantism in unique biogenic magnetite at the Paleocene–Eocene Thermal Maximum". PNAS. 105 (46): 17648–17653. doi:10.1073/pnas.0803634105. PMC 2584680. PMID 18936486.
- ↑ O. Strbak; P. Kopcansky; I. Frollo (2011). "Biogenic Magnetite in Humans and New Magnetic Resonance Hazard Questions" (PDF). Measurement Science Review. 11 (3). doi:10.2478/v10048-011-0014-1.
- ↑ Thomas, E., 1989. Development of Cenozoic deep-sea benthic foraminiferal faunas in Antarctic waters. Geological Society London Special Publication, 47: 283-296; doi:10.1144/GSL.SP.1989.047.01.21
- ↑ Thomas, E., 1990. Late Cretaceous-early Eocene mass extinctions in the deep sea. Geological Society of America Special Publication, 247, 481- 495; doi:10.1130/SPE247-p481
- ↑ Thomas, E., 1998, The biogeography of the late Paleocene benthic foraminiferal extinction, In: M.-P. Aubry, S. Lucas, and W. A. Berggren, eds., Late Paleocene-early Eocene Biotic and Climatic Events in the Marine and Terrestrial Records, Columbia University Press, 214-243
- ↑ Thomas, E., 2007. Cenozoic mass extinctions in the deep sea; what disturbs the largest habitat on Earth? S. Monechi, R. Coccioni, and M. Rampino, eds., "Large Ecosystem Perturbations: Causes and Consequences", Geological Society of America Special Paper, 424: 1-24.
- ↑ Winguth, A., Thomas, E., and Winguth, C., 2012. Global decline in ocean ventilation, oxygenation and productivity during the Paleocene-Eocene Thermal Maximum - Implications for the benthic extinction. Geology, 40: 263-266; doi:10.1130/G32529
- ↑ Ma, Z., Gray, E., Thomas, E., Murphy, B., Zachos, J. C., and Paytan, A., 2014. Carbon sequestration during the Paleocene-Eocene Thermal maximum by an efficient biological pump. Nature Geoscience 7: 382-388; doi:10.1038/NGEO2139
- ↑ 125. Zhou, X., Thomas, E., Rickaby, R. E. M., Winguth, A. M. E., and Lu, Z., 2014, I/Ca evidence for global upper ocean deoxygenation during the Paleocene-Eocene Thermal Maximum (PETM). Paleoceanography 29(10), 964-975; doi:10.1002/2014PA002702
- ↑ Langdon, C.; Takahashi, T.; Sweeney, C.; Chipman, D.; Goddard, J.; Marubini, F.; Aceves, H.; Barnett, H.; Atkinson, M.J. (2000). "Effect of calcium carbonate saturation state on the calcification rate of an experimental coral reef". Global Biogeochemical Cycles. 14 (2): 639–654. Bibcode:2000GBioC..14..639L. doi:10.1029/1999GB001195.
- ↑ Riebesell, U.; Zondervan, I.; Rost, B.; Tortell, P.D.; Zeebe, R.E.; Morel, F.M.M. (2000). "Reduced calcification of marine plankton in response to increased atmospheric CO2". Nature. 407 (6802): 364–367. doi:10.1038/35030078. PMID 11014189.
- 1 2 Iglesias-Rodriguez, M. Debora; Halloran, Paul R.; Rickaby, Rosalind E. M.; Hall, Ian R.; Colmenero-Hidalgo, Elena; Gittins, John R.; Green, Darryl R. H.; Tyrrell, Toby; Gibbs, Samantha J.; von Dassow, Peter; Rehm, Eric; Armbrust, E. Virginia; Boessenkool, Karin P. (April 2008). "Phytoplankton Calcification in a High-CO2 World". Science. 320 (5874): 336–40. Bibcode:2008Sci...320..336I. doi:10.1126/science.1154122. PMID 18420926.
- ↑ Bralower, T.J. (2002). "Evidence of surface water oligotrophy during the Paleocene-Eocene thermal maximum: Nannofossil assemblage data from Ocean Drilling Program Site 690, Maud Rise, Weddell Sea" (PDF). Paleoceanography. 17 (2): 13–1. Bibcode:2002PalOc..17b..13B. doi:10.1029/2001PA000662. Retrieved 2008-02-28.
- 1 2 Kelly, D.C.; Bralower, T.J.; Zachos, J.C. (1998). "Evolutionary consequences of the latest Paleocene thermal maximum for tropical planktonic foraminifera". Palaeogeography, Palaeoclimatology, Palaeoecology. 141 (1): 139–161. doi:10.1016/S0031-0182(98)00017-0. Retrieved 2008-02-28.
- 1 2 3 Thierry Adatte; Hassan Khozyem; Jorge E. Spangenberg; Bandana Samant & Gerta Keller (2014). "Response of terrestrial environment to the Paleocene-Eocene Thermal Maximum (PETM), new insights from India and NE Spain". Rendiconti della Società Geologica Italiana. 31: 5–6. doi:10.3301/ROL.2014.17.
- 1 2 Gingerich, P.D. (2003). "Mammalian responses to climate change at the Paleocene-Eocene boundary: Polecat Bench record in the northern Bighorn Basin, Wyoming". In Wing, Scott L. Causes and Consequences of Globally Warm Climates in the Early Paleogene (PDF). 369. Geological Society of America. pp. 463–78. doi:10.1130/0-8137-2369-8.463. ISBN 978-0-8137-2369-3. Retrieved April 2013. Check date values in:
|access-date=(help) - ↑ Secord, R.; Bloch, J. I.; Chester, S. G. B.; Boyer, D. M.; Wood, A. R.; Wing, S. L.; Kraus, M. J.; McInerney, F. A.; Krigbaum, J. (2012). "Evolution of the Earliest Horses Driven by Climate Change in the Paleocene-Eocene Thermal Maximum". Science. 335 (6071): 959–962. doi:10.1126/science.1213859. PMID 22363006.
- ↑ Carozza, D. A.; Mysak, L. A.; Schmidt, G. A. (2011). "Methane and environmental change during the Paleocene-Eocene thermal maximum (PETM): Modeling the PETM onset as a two-stage event". Geophysical Research Letters. 38 (5). doi:10.1029/2010GL046038.
- ↑ Patterson, M. V.; Francis, D. (2013). "Kimberlite eruptions as triggers for early Cenozoic hyperthermals". Geochemistry, Geophysics, Geosystems. 14 (2): 448–456. doi:10.1002/ggge.20054.
- ↑ Svensen, H.; Planke, S.; Malthe-Sørenssen, A.; Jamtveit, B.; Myklebust, R.; Eidem, T.; Rey, S. S. (2004). "Release of methane from a volcanic basin as a mechanism for initial Eocene global warming.". Nature. 429 (6991): 542–545. Bibcode:2004Natur.429..542S. doi:10.1038/nature02566. PMID 15175747.
- ↑ Storey, M.; Duncan, R.A.; Swisher III, C.C. (2007). "Paleocene-Eocene Thermal Maximum and the Opening of the Northeast Atlantic". Science. 316 (5824): 587–9. Bibcode:2007Sci...316..587S. doi:10.1126/science.1135274. PMID 17463286.
- ↑ Jason Wolfe (5 September 2000). "Volcanoes and Climate Change". Earth Observatory. NASA. Retrieved 19 February 2009.
- ↑ Bralower, T.J.; Thomas, D.J.; Zachos, J.C.; Hirschmann, M.M.; Röhl, U.; Sigurdsson, H.; Thomas, E.; Whitney, D.L. (1997). "High-resolution records of the late Paleocene thermal maximum and circum-Caribbean volcanism: Is there a causal link?". Geology. 25 (11): 963–966. Bibcode:1997Geo....25..963B. doi:10.1130/0091-7613(1997)025<0963:HRROTL>2.3.CO;2. Retrieved 2010-07-12.
- 1 2 Kent, D.V.; Cramer, B.S.; Lanci, L.; Wang, D.; Wright, J.D.; Van Der Voo, R. (2003). "A case for a comet impact trigger for the Paleocene/Eocene thermal maximum and carbon isotope excursion". Earth and Planetary Science Letters. 211 (1–2): 13–26. Bibcode:2003E&PSL.211...13K. doi:10.1016/S0012-821X(03)00188-2. Retrieved 2008-02-28.
- ↑ Kopp, R.E.; Raub, T.; Schumann, D.; Vali, H.; Smirnov, A.V.; Kirschvink, J.L. (2007). "Magnetofossil Spike During The Paleocene-eocene Thermal Maximum: Ferromagnetic Resonance, Rock Magnetic, And Electron Microscopy Evidence From The Atlantic Coastal Plain Of New Jersey". Palaeoceanography. 22 (4): PA4103. Bibcode:2007PalOc..22.4103K. doi:10.1029/2007PA001473.
- ↑ Wang, H.; Dennis V. Kent; Michael J. Jackson (2012). "Evidence for abundant isolated magnetic nanoparticles at the Paleocene–Eocene boundary". Proceedings of the National Academy of Sciences. 110 (2): 425–430. Bibcode:2013PNAS..110..425W. doi:10.1073/pnas.1205308110.
- 1 2 Schaller, M. F.; Fung, M. K.; Wright, J. D.; Katz, M. E.; Kent, D. V. (2016). "Impact ejecta at the Paleocene-Eocene boundary". Science. 354 (6309): 225–229. doi:10.1126/science.aaf5466. ISSN 0036-8075.
- ↑ Timmer, John. "Researchers push argument that comet caused ancient climate change". Ars Technica. Retrieved 2016-10-13.
- ↑ Moore, E; Kurtz, Andrew C. (2008). "Black carbon in Paleocene-Eocene boundary sediments: A test of biomass combustion as the PETM trigger". Palaeogeography Palaeoclimatology Palaeoecology. 267 (1–2): 147–152. doi:10.1016/j.palaeo.2008.06.010.
- ↑ Lourens, L.J.; Sluijs, A.; Kroon, D.; Zachos, J.C.; Thomas, E.; Röhl, U.; Bowles, J.; Raffi, I. (2005). "Astronomical pacing of late Palaeocene to early Eocene global warming events". Nature. 435 (7045): 1083–1087. Bibcode:2005Natur.435.1083L. doi:10.1038/nature03814. PMID 15944716.
- ↑ Katz, M.E.; Cramer, B.S.; Mountain, G.S.; Katz, S.; Miller, K.G. (2001). "Uncorking the bottle: What triggered the Paleocene/Eocene thermal maximum methane release" (PDF). Paleoceanography. 16 (6): 667. Bibcode:2001PalOc..16..549K. doi:10.1029/2000PA000615. Retrieved 2008-02-28.
- ↑ MacDonald, Gordon J. (1990). "Role of methane clathrates in past and future climates". Climatic Change. 16 (3): 247–281. doi:10.1007/BF00144504.
- 1 2 Thomas, D.J.; Zachos, J.C.; Bralower, T.J.; Thomas, E.; Bohaty, S. (2002). "Warming the fuel for the fire: Evidence for the thermal dissociation of methane hydrate during the Paleocene-Eocene thermal maximum". Geology. 30 (12): 1067–1070. Bibcode:2002Geo....30.1067T. doi:10.1130/0091-7613(2002)030<1067:WTFFTF>2.0.CO;2.
- ↑ Tripati, A.; Elderfield, H. (2005). "Deep-Sea Temperature and Circulation Changes at the Paleocene-Eocene Thermal Maximum". Science. 308 (5730): 1894–1898. Bibcode:2005Sci...308.1894T. doi:10.1126/science.1109202. PMID 15976299.
- 1 2 Gu, Guangsheng; Dickens, G.R.; Bhatnagar, G.; Colwell, F.S.; Hirasaki, G.J.; Chapman, W.G. (2011). "Abundant Early Palaeogene marine gas hydrates despite warm deep-ocean temperatures" (PDF). Nature Geoscience. 4 (12): 848–851. Bibcode:2011NatGe...4..848G. doi:10.1038/ngeo1301.
- ↑ Pagani, Mark; Caldeira, K.; Archer, D.; Zachos, J.C. (8 December 2006). "An Ancient Carbon Mystery". Science. 314 (5805): 1556–7. doi:10.1126/science.1136110. PMID 17158314.
- ↑ Bice, K.L.; Marotzke, J. (2002). "Could changing ocean circulation have destabilized methane hydrate at the Paleocene/Eocene boundary" (PDF). Paleoceanography. 17 (2): 1018. Bibcode:2002PalOc..17b...8B. doi:10.1029/2001PA000678. Retrieved 2008-02-29.
- ↑ Cope, Jesse Tiner (2009). "On The Sensitivity Of Ocean Circulation To Arctic Freshwater Pulses During The Paleocene/Eocene Thermal Maximum" (PDF). Retrieved 2013-08-07.
- ↑ Ying Cui; Lee R. Kump; Andy J. Ridgwell; Adam J. Charles; Christopher K. Junium; Aaron F. Diefendorf; Katherine H. Freeman; Nathan M. Urban & Ian C. Harding (2011). "Slow release of fossil carbon during the Palaeocene–Eocene Thermal Maximum". Nature Geoscience. 4 (7): 481–485. doi:10.1038/ngeo1179.
- ↑ Bains, S.; Norris, R.D.; Corfield, R.M.; Faul, K.L. (2000). "Termination of global warmth at the Palaeocene/Eocene boundary through productivity feedback". Nature. 407 (6801): 171–4. doi:10.1038/35025035. PMID 11001051.
- ↑ Dickens, G. R.; Fewless, T.; Thomas, E.; Bralower, T. J. (2003). "Excess barite accumulation during the Paleocene-Eocene thermal Maximum: Massive input of dissolved barium from seafloor gas hydrate reservoirs". Special Paper 369: Causes and consequences of globally warm climates in the early Paleogene. 369. p. 11. doi:10.1130/0-8137-2369-8.11. ISBN 0-8137-2369-8.
Further reading
- Jardine, Phil (2011). "Paleocene–Eocene Thermal Maximum". Palaeontology Online. 1 (5): 1–7.