p-chart
| p-chart | |
|---|---|
| Originally proposed by | Walter A. Shewhart |
| Process observations | |
| Rational subgroup size | n > 1 |
| Measurement type | Fraction nonconforming in a sample |
| Quality characteristic type | Attributes data |
| Underlying distribution | Binomial distribution |
| Performance | |
| Size of shift to detect | ≥ 1.5σ |
| Process variation chart | |
| Not applicable | |
| Process mean chart | |
 | |
| Center line | |
| Control limits | |
| Plotted statistic | |


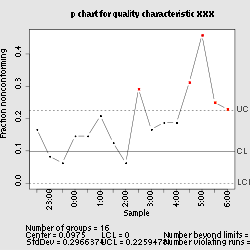
In statistical quality control, the p-chart is a type of control chart used to monitor the proportion of nonconforming units in a sample, where the sample proportion nonconforming is defined as the ratio of the number of nonconforming units to the sample size, n.[1]
The p-chart only accommodates "pass"/"fail"-type inspection as determined by one or more go-no go gauges or tests, effectively applying the specifications to the data before they are plotted on the chart. Other types of control charts display the magnitude of the quality characteristic under study, making troubleshooting possible directly from those charts.
Assumptions
The binomial distribution is the basis for the p-chart and requires the following assumptions:[2]:267
- The probability of nonconformity p is the same for each unit;
- Each unit is independent of its predecessors or successors;
- The inspection procedure is same for each sample and is carried out consistently from sample to sample
Calculation and plotting
The control limits for this chart type are where is the estimate of the long-term process mean established during control-chart setup.[2]:268 Naturally, if the lower control limit is less than or equal to zero, process observations only need be plotted against the upper control limit. Note that observations of proportion nonconforming below a positive lower control limit are cause for concern as they are more frequently evidence of improperly calibrated test and inspection equipment or inadequately trained inspectors than of sustained quality improvement.[2]:279

Some organizations may elect to provide a standard value for p, effectively making it a target value for the proportion nonconforming. This may be useful when simple process adjustments can consistently move the process mean, but in general, this makes it more challenging to judge whether a process is fully out of control or merely off-target (but otherwise in control).[2]:269
Potential pitfalls
There are two circumstances that merit special attention:
- Ensuring enough observations are taken for each sample
- Accounting for differences in the number of observations from sample to sample
Adequate sample size
Sampling requires some careful consideration. If the organization elects to use 100% inspection on a process, the production rate determines an appropriate sampling rate which in turn determines the sample size.[2]:277 If the organization elects to only inspect a fraction of units produced, the sample size should be chosen large enough so that the chance of finding at least one nonconforming unit in a sample is high—otherwise the false alarm rate is too high. One technique is to fix sample size so that there is a 50% chance of detecting a process shift of a given amount (for example, from 1% defective to 5% defective). If δ is the size of the shift to detect, then the sample size should be set to .[2]:278 Another technique is to choose the sample size large enough so that the p-chart has a positive lower control limit or .


Varying sample sizes
In the case of 100% inspection, variation in the production rate (e.g., due to maintenance or shift changes) conspires to produce different sample sizes for each observation plotted on the p-chart. There are three ways to deal with this:
| Technique | Description |
|---|---|
| Use variable-width control limits[2]:280 | Each observation plots against its own control limits: , where ni is the size of the sample that produced the ith observation on the p-chart |
| Use control limits based on an average sample size[2]:282 | Control limits are , where is the average size of all the samples on the p-chart, |
| Use a standardized control chart[2]:283 | Control limits are ±3 and the observations, , are standardized using , where ni is the size of the sample that produced the ith observation on the p-chart |


Sensitivity of control limits
Some practitioners have pointed out that the p-chart is sensitive to the underlying assumptions, using control limits derived from the binomial distribution rather than from the observed sample variance. Due to this sensitivity to the underlying assumptions, p-charts are often implemented incorrectly, with control limits that are either too wide or too narrow, leading to incorrect decisions regarding process stability. A p-chart is a form of the Individuals chart (also referred to as "XmR" or "ImR"), and these practitioners recommend the individuals chart as a more robust alternative for count-based data.[3]
See also
References
- ↑ "Proportions Control Charts". NIST/Sematech Engineering Statistics Handbook. National Institute of Standards and Technology. Retrieved 2010-01-05. External link in
|work=(help) - 1 2 3 4 5 6 7 8 9 Montgomery, Douglas (2005). Introduction to Statistical Quality Control. Hoboken, New Jersey: John Wiley & Sons, Inc. ISBN 978-0-471-65631-9. OCLC 56729567.
- ↑ Wheeler, Donald (2000). Understanding Variation: The Key to Managing Chaos. SPC Press. p. 140. ISBN 0-945320-53-1.